Magnetic Nanoparticles Market Size - Global Industry, Share, Analysis, Trends and Forecast 2024 - 2032
Published :
Report ID:
Pages :
Format :
Magnetic Nanoparticles Market Size - Global Industry, Share, Analysis, Trends and Forecast 2024 - 2032
Report Coverage
- Industry Dynamics
- Market Size and Forecast Data
- Segment Analysis
- Competitive Landscape
- Regional Analysis with a Niche Focus on Country-Level Data
- High Level Analysis - Porter's, PESTEL, Value Chain, etc.
- Company Profiles of Key Players
- Option to Customize the Report As Per Your Specific Need
Request Sample Report
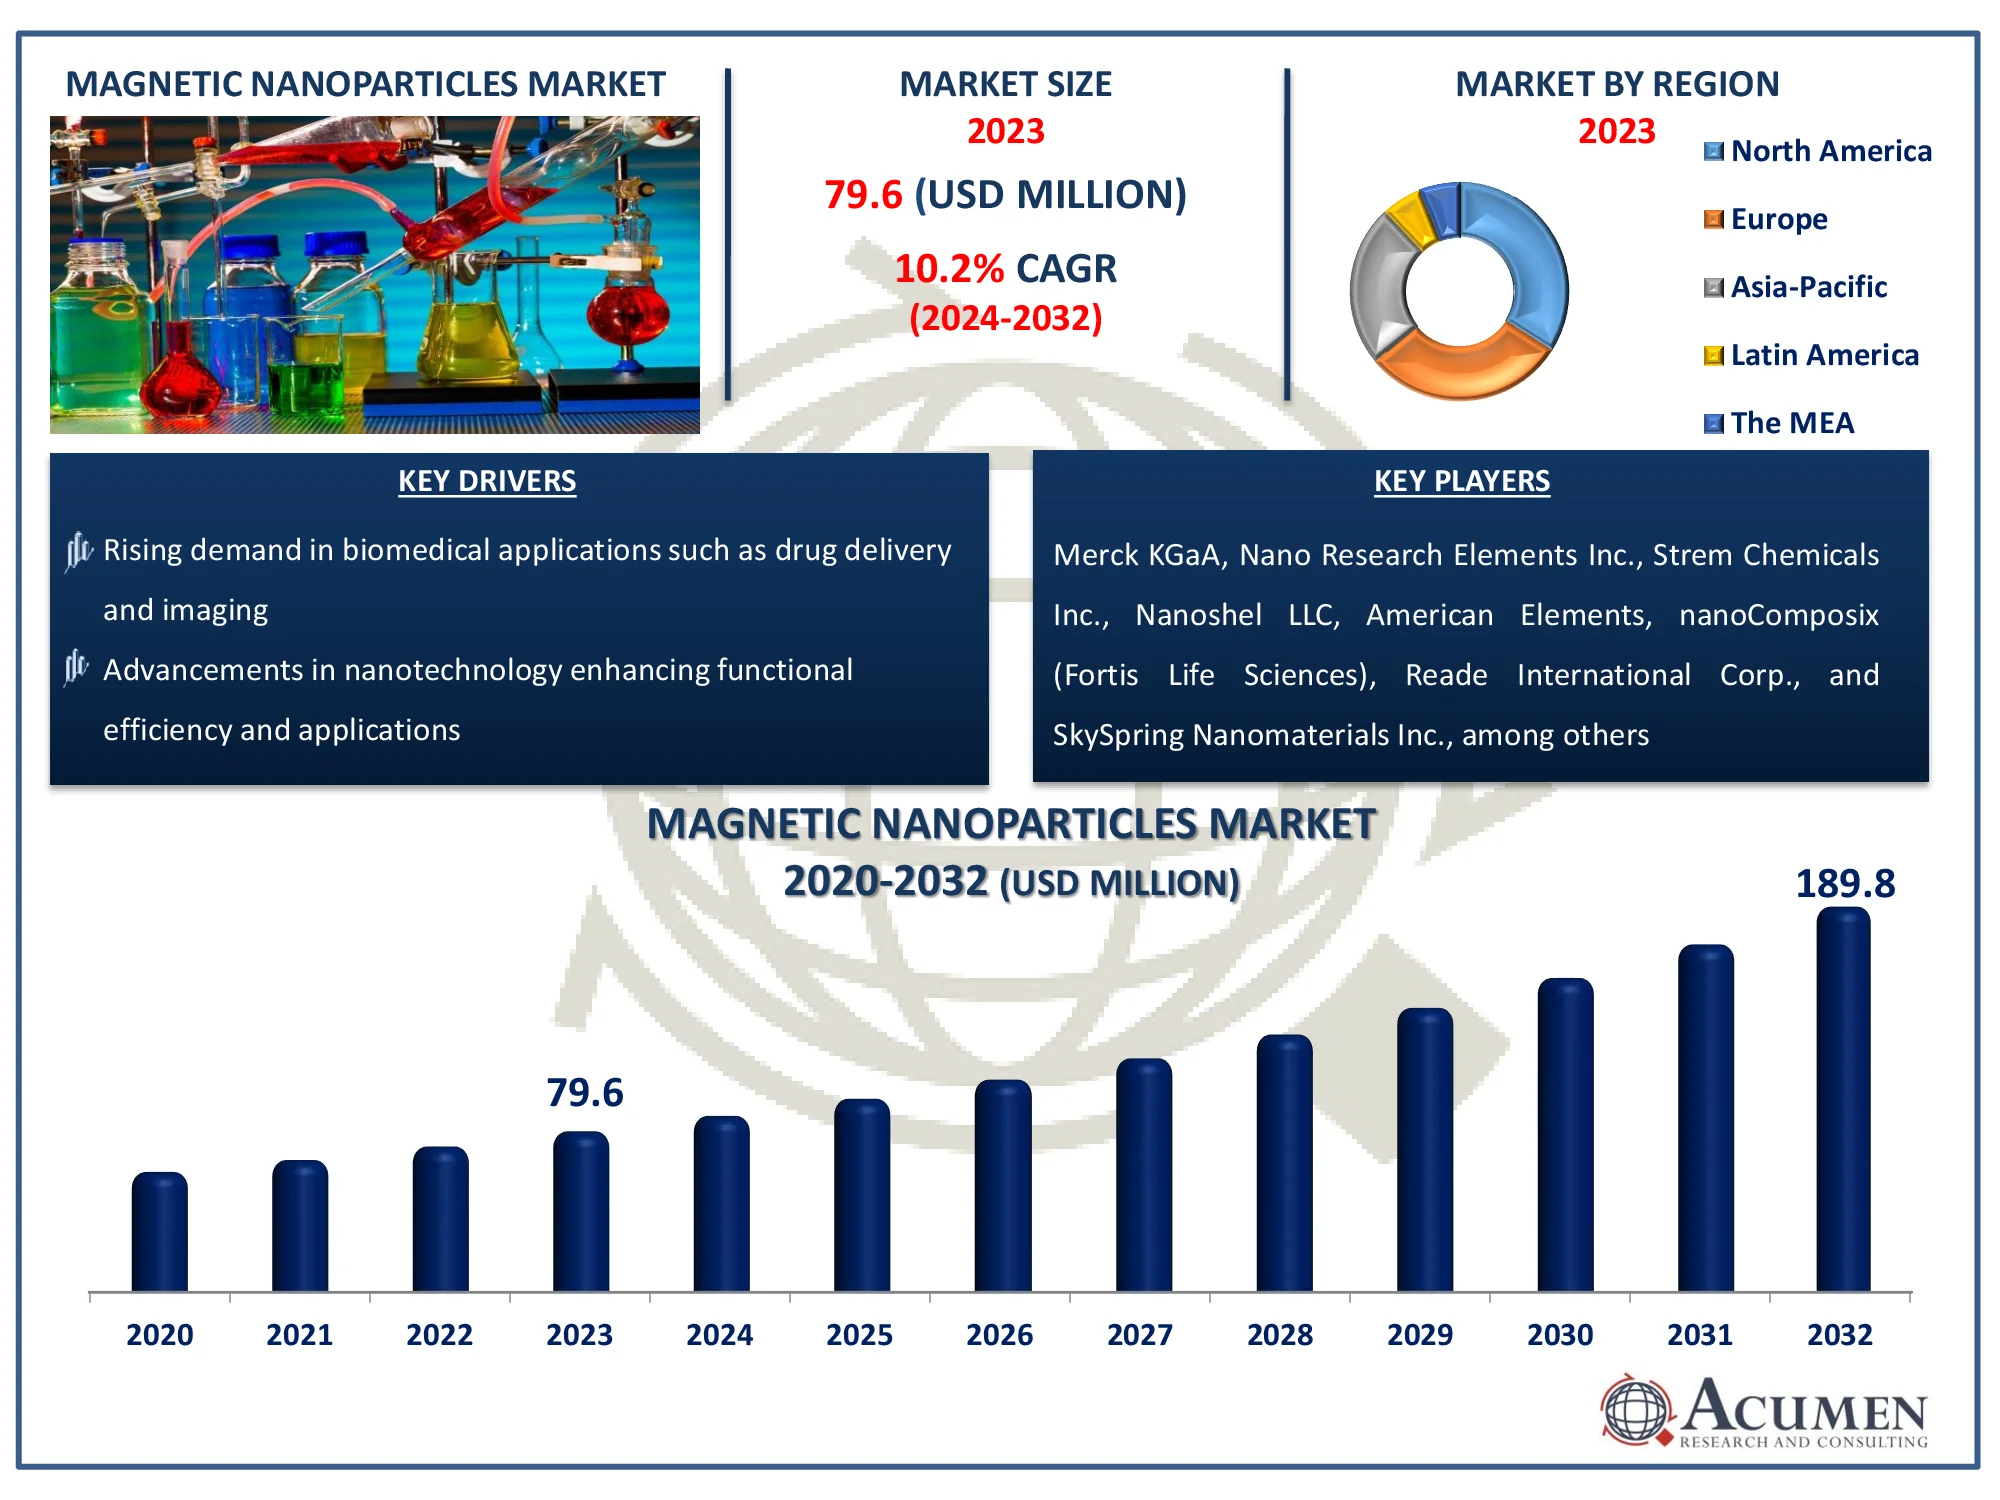
The Global Magnetic Nanoparticles Market Size accounted for USD 79.6 Million in 2023 and is estimated to achieve a market size of USD 189.8 Million by 2032 growing at a CAGR of 10.2% from 2024 to 2032.
Magnetic Nanoparticles Market Highlights
- Global magnetic nanoparticles market revenue is poised to garner USD 189.8 million by 2032 with a CAGR of 10.2% from 2024 to 2032
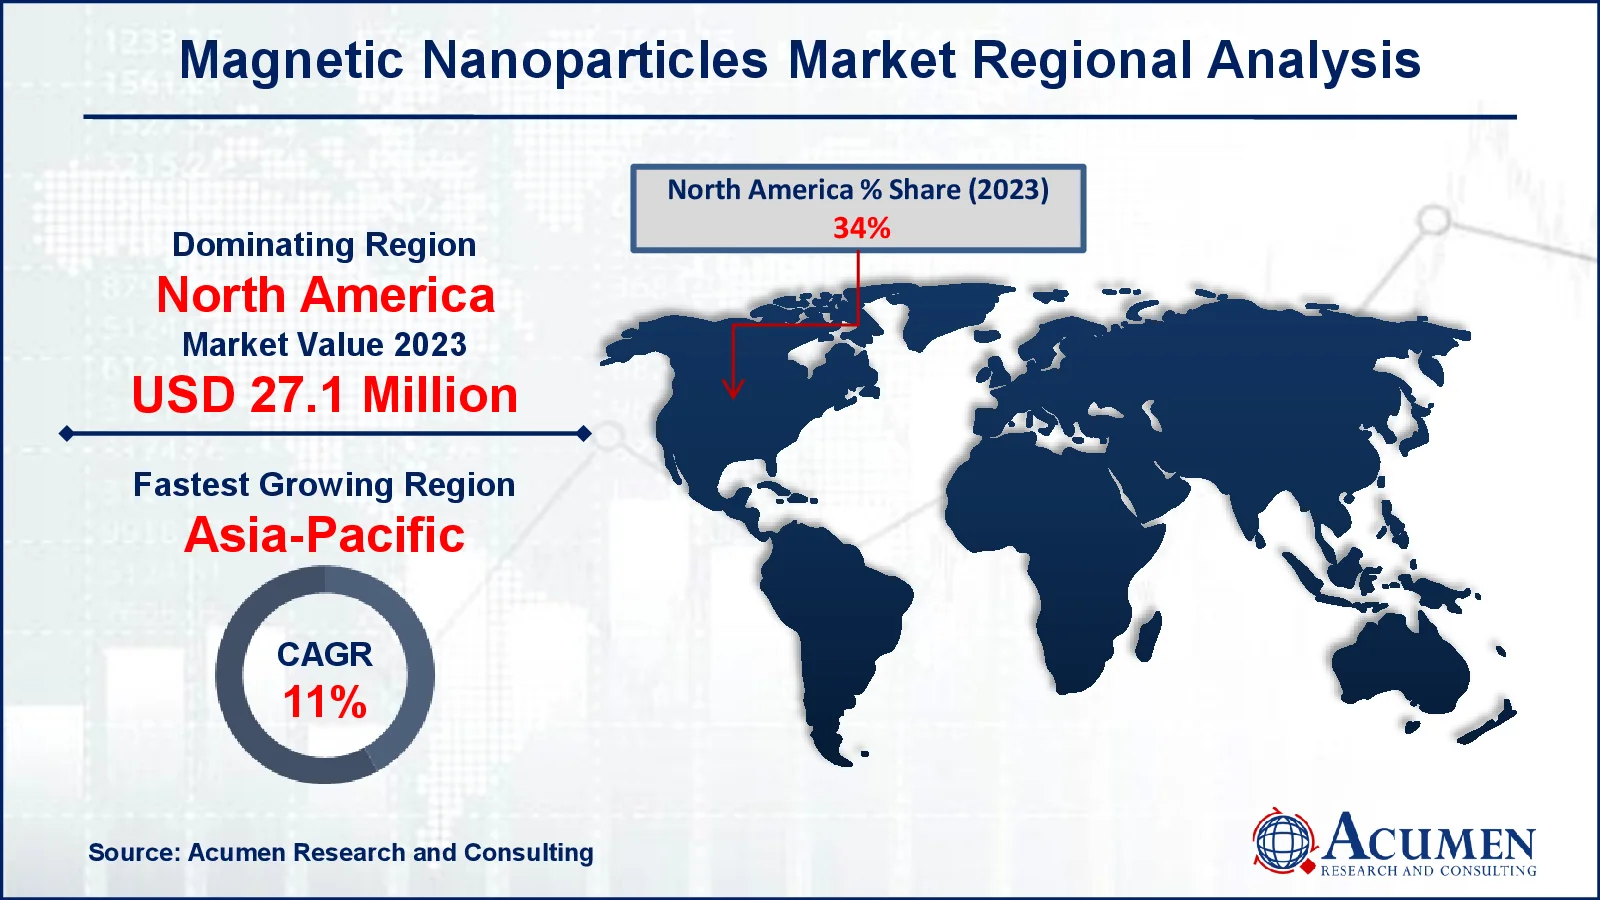
- North America magnetic nanoparticles market value occupied around USD 27.1 million in 2023
- Asia-Pacific magnetic nanoparticles market growth will record a CAGR of more than 11% from 2024 to 2032
- Among product, the iron based sub-segment generated noteworthy revenue in 2023
- Based on application, the bio-medical sub-segment generated 72% magnetic nanoparticles market share in 2023
- Emerging use in environmental remediation, such as wastewater treatment is a popular magnetic nanoparticles market trend that fuels the industry demand

Nanoparticles are particles that consist of at least one dimension in the nanoscale range. They differ from the properties of their own macro scale properties. Magnetic particles are the particles whose properties can be deployed on the exposure to a magnetic field. They mainly consist of various applications such as in material science, magnetic fluid recording, biomedicines, catalysis, and others. Moreover, there are different methods of synthesizing magnetic nanostructures such as template assisted fabrication, chemical synthesis, and thermal decomposition.
Global Magnetic Nanoparticles Market Dynamics
Market Drivers
- Rising demand in biomedical applications such as drug delivery and imaging
- Advancements in nanotechnology enhancing functional efficiency and applications
- Increasing adoption in electronics for data storage and high-performance devices
- Government support and funding for nanotechnology research and development
Market Restraints
- High production costs and expensive raw materials
- Environmental and health concerns regarding nanoparticle toxicity
- Limited large-scale applications restricting widespread adoption
Market Opportunities
- Expanding use in hyperthermia-based cancer therapy
- Integration with AI for diagnostics and smart drug delivery systems
- Growing demand in energy storage solutions like batteries and supercapacitors
Magnetic Nanoparticles Market Report Coverage
|
Market |
Magnetic Nanoparticles Market |
|
Magnetic Nanoparticles Market Size 2023 |
USD 79.6 Million |
|
Magnetic Nanoparticles Market Forecast 2032 |
USD 189.8 Million |
|
Magnetic Nanoparticles Market CAGR During 2024 - 2032 |
10.2% |
|
Magnetic Nanoparticles Market Analysis Period |
2020 - 2032 |
|
Magnetic Nanoparticles Market Base Year |
2023 |
|
Magnetic Nanoparticles Market Forecast Data |
2024 - 2032 |
|
Segments Covered |
By Product, By Application, and By Geography |
|
Regional Scope |
North America, Europe, Asia Pacific, Latin America, and Middle East & Africa |
|
Key Companies Profiled |
Merck KGaA, Nano Research Elements Inc., Strem Chemicals Inc., Nanoshel LLC, Cytodiagnostics Inc., American Elements, nanoComposix (Fortis Life Sciences), Reade International Corp., SkySpring Nanomaterials Inc., Nanografi Nano Technology, and US Research Nanomaterials Inc. |
|
Report Coverage |
Market Trends, Drivers, Restraints, Competitive Analysis, Player Profiling, Covid-19 Analysis, Regulation Analysis |
Magnetic Nanoparticles Market Insights
Magnetic nanoparticles are in high demand in the biomedical industry, notably for applications like targeted drug administration, magnetic resonance imaging (MRI), and hyperthermia therapy. When exposed to external magnetic fields, these nanoparticles exhibit unique magnetic properties that allow them to precisely go to specific places within the body. They allow for regulated and localized release of therapeutic molecules in medicine delivery, reducing systemic side effects and boosting efficacy. Their role in MRI is just as significant, as they improve picture contrast and diagnostic accuracy.
Furthermore, the use of magnetic nanoparticles in cancer treatments like hyperthermia, which generates heat to target malignant regions, is gaining popularity. With increased healthcare spending and advances in medical technology, biomedical applications of magnetic nanoparticles are expected to drive significant market growth.
Magnetic nanoparticles' production, usefulness, and scalability are constantly improving as nanotechnology advances. These developments have resulted in greater control over particle size, shape, and surface modification, broadening their applicability across industries. For example, the development of biocompatible coatings has expanded their use in medical disciplines, whilst improved magnetic characteristics have increased their efficiency in electronics and energy storage.
The complex methods required for the synthesis and functionalization of magnetic nanoparticles lead to high production costs. This financial cost makes them less accessible to small-scale companies and emerging economies, hindering market growth.
The application of magnetic nanoparticles in environmental remediation, such as wastewater treatment and pollutant removal, represents an important growth opportunity. Their capacity to efficiently absorb and segregate impurities qualifies them as an effective solution to environmental issues.
Magnetic Nanoparticles Market Segmentation
The worldwide market for magnetic nanoparticles is split based on product, application, and geography.
Magnetic Nanoparticles Market By Product
- Cobalt Based
- Iron Based
According to magnetic nanoparticles industry analysis, the iron-based sector is predicted to lead the market due to its superior magnetic characteristics, high biocompatibility, and wide range of applications. Iron-based magnetic nanoparticles, particularly iron oxide, are widely employed in biomedical applications such as drug delivery, magnetic resonance imaging (MRI), and cancer hyperthermia treatment due to their low toxicity and efficient magnetic activity. Furthermore, its application in environmental remediation, such as wastewater treatment and pollution removal, drives up demand. The segment's rise is also being driven by advances in nanotechnology and a growing emphasis on personalized medicine, both of which use the capabilities of iron-based nanoparticles to deliver precise and tailored medicines. These characteristics combine to establish iron-based nanoparticles as the market's largest category.
Magnetic Nanoparticles Market By Application
- Electronics
- Bio-medical
- Energy
- Wastewater Treatment
- Others
The bio-medical category is expected to be the largest in the magnetic nanoparticles market forecast period, driven by their importance in advanced healthcare applications. Magnetic nanoparticles are commonly employed in magnetic resonance imaging (MRI) as contrast agents to improve diagnostic accuracy. Furthermore, their use in drug delivery systems allows for more precise targeting, fewer side effects, and better therapeutic outcomes. The segment also benefits from their application in cancer treatments, including hyperthermia treatment, in which nanoparticles generate localized heat to eradicate tumor cells. Increased investments in nanomedicine research, combined with rising demand for tailored and minimally invasive therapies, are driving this industry forward. Magnetic nanoparticles' flexibility and biocompatibility make the biomedical sector a key market driver.
Magnetic Nanoparticles Market Regional Outlook
North America
- U.S.
- Canada
Europe
- U.K.
- Germany
- France
- Spain
- Rest of Europe
Asia-Pacific
- India
- Japan
- China
- Australia
- South Korea
- Rest of Asia-Pacific
Latin America
- Brazil
- Mexico
- Rest of LATAM
The Middle East & Africa
- South Africa
- GCC Countries
- Rest of the Middle East & Africa (ME&A)
Magnetic Nanoparticles Market Regional Analysis
In terms of magnetic nanoparticles market analysis, geographically; the global industry is bifurcated into 5 major regions such as North America, Europe, Asia Pacific (APAC), and Latin America, Middle East & Africa (LAMEA).

North America is expected to largest during the forecasted period owing to the favorable policies by the government. Rising use of nanotechnology-based devices on the basis of production and application especially in U.S. will further flourish the growth of the market in this region.
Asia-Pacific is expected to drive the market during the forecast period 2024-2032. This region includes the growing market in the ferrofluid industry with India leading growth, followed by China. Both countries are expected to witness a strong growth in terms of consumption of magnetic nanoparticles. The other factors propelling the growth of the market in this region include availability of cheap labor and favorable government policies.
Europe is expecting a strong growth during the forecasted period due to the rise in spending in research and development activities to find the cure of different diseases. The increase in demand for the market will further propel the market growth in this region. Additionally, LAMEA is expecting a steady growth rate due to the lack of knowledge and less government support.
Magnetic Nanoparticles Market Players
Some of the top magnetic nanoparticles companies offered in our report includes Merck KGaA, Nano Research Elements Inc., Strem Chemicals Inc., Nanoshel LLC, Cytodiagnostics Inc., American Elements, nanoComposix (Fortis Life Sciences), Reade International Corp., SkySpring Nanomaterials Inc., Nanografi Nano Technology, and US Research Nanomaterials Inc.
Frequently Asked Questions
How big is the magnetic nanoparticles market?
The magnetic nanoparticles market size was valued at USD 79.6 million in 2023.
What is the CAGR of the global magnetic nanoparticles market from 2024 to 2032?
The magnetic nanoparticles market is expected to grow at a CAGR of 10.2% during the analysis period of 2024 to 2032.
Which are the key players in the magnetic nanoparticles market?
The key players operating in the global market are including Merck KGaA, Nano Research Elements Inc., Strem Chemicals Inc., Nanoshel LLC, Cytodiagnostics Inc., American Elements, nanoComposix (Fortis Life Sciences), Reade International Corp., SkySpring Nanomaterials Inc., Nanografi Nano Technology, and US Research Nanomaterials Inc.
Which region dominated the global magnetic nanoparticles market share?
North America held the dominating position in magnetic nanoparticles industry during the analysis period of 2024 to 2032.
Which region registered fastest CAGR from 2024 to 2032?
Asia-Pacific region exhibited fastest growing CAGR for market of magnetic nanoparticles during the analysis period of 2024 to 2032.
What are the current trends and dynamics in the global magnetic nanoparticles industry?
The current trends and dynamics in the magnetic nanoparticles industry include rising demand in biomedical applications such as drug delivery and imaging, and advancements in nanotechnology enhancing functional efficiency and applications.
Which application held the maximum share in 2023?
The bio-medical application held the maximum share of the magnetic nanoparticles industry.


