L Arginine Market | Acumen Research and Consulting
L-Arginine Market Size - Global Industry, Share, Analysis, Trends and Forecast 2023 - 2032
Published :
Report ID:
Pages :
Format :
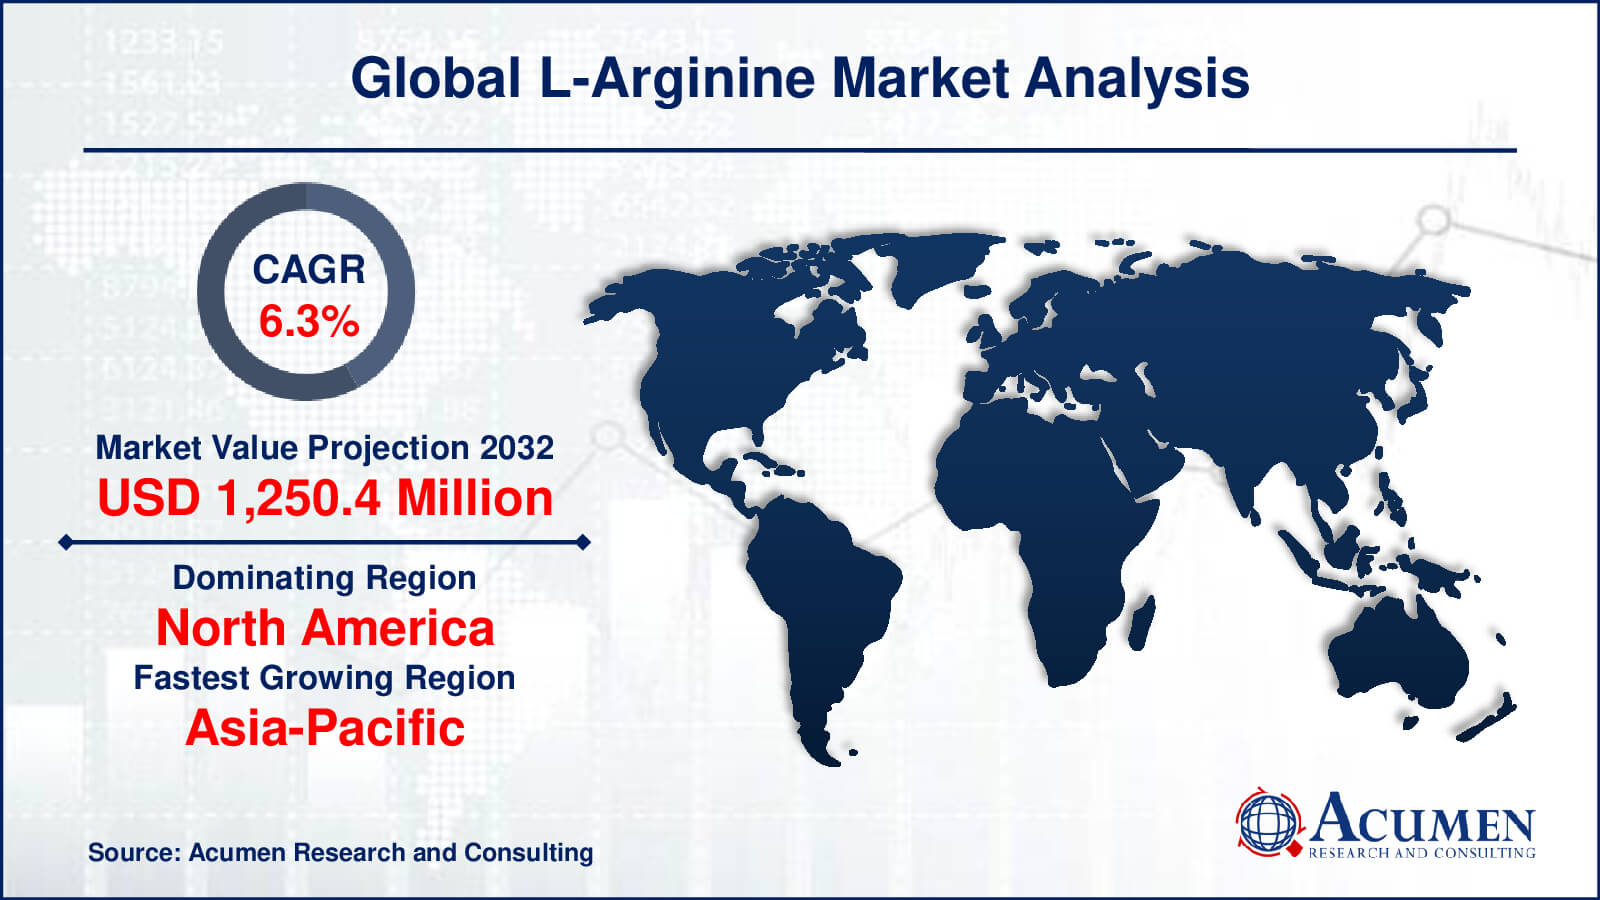
The Global L-Arginine Market Size accounted for USD 683 Million in 2022 and is estimated to achieve a market size of USD 1,250.4 Million by 2032 growing at a CAGR of 6.3% from 2023 to 2032.
L-Arginine Market Highlights
- Global L-Arginine market revenue is poised to garner USD 1,250.4 million by 2032 with a CAGR of 6.3% from 2023 to 2032
- North America L-Arginine market value occupied around USD 200 million in 2022
- Asia-Pacific L-Arginine market growth will record a CAGR of over 7% from 2023 to 2032
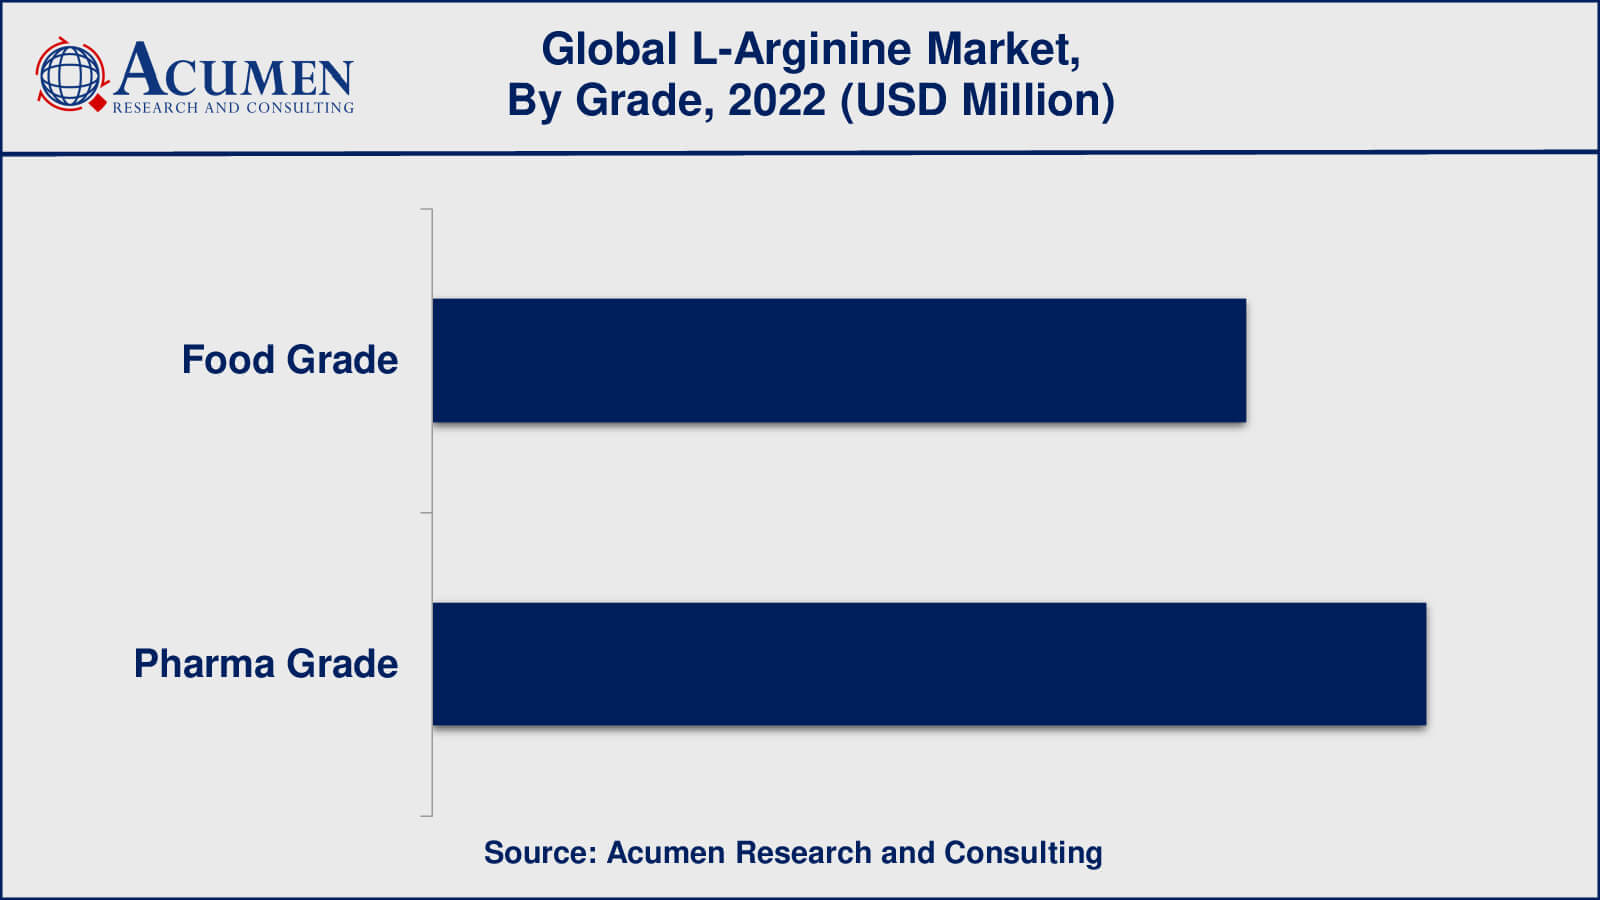
- Among grade, the pharma grade sub-segment generated over US$ 375 million revenue in 2022
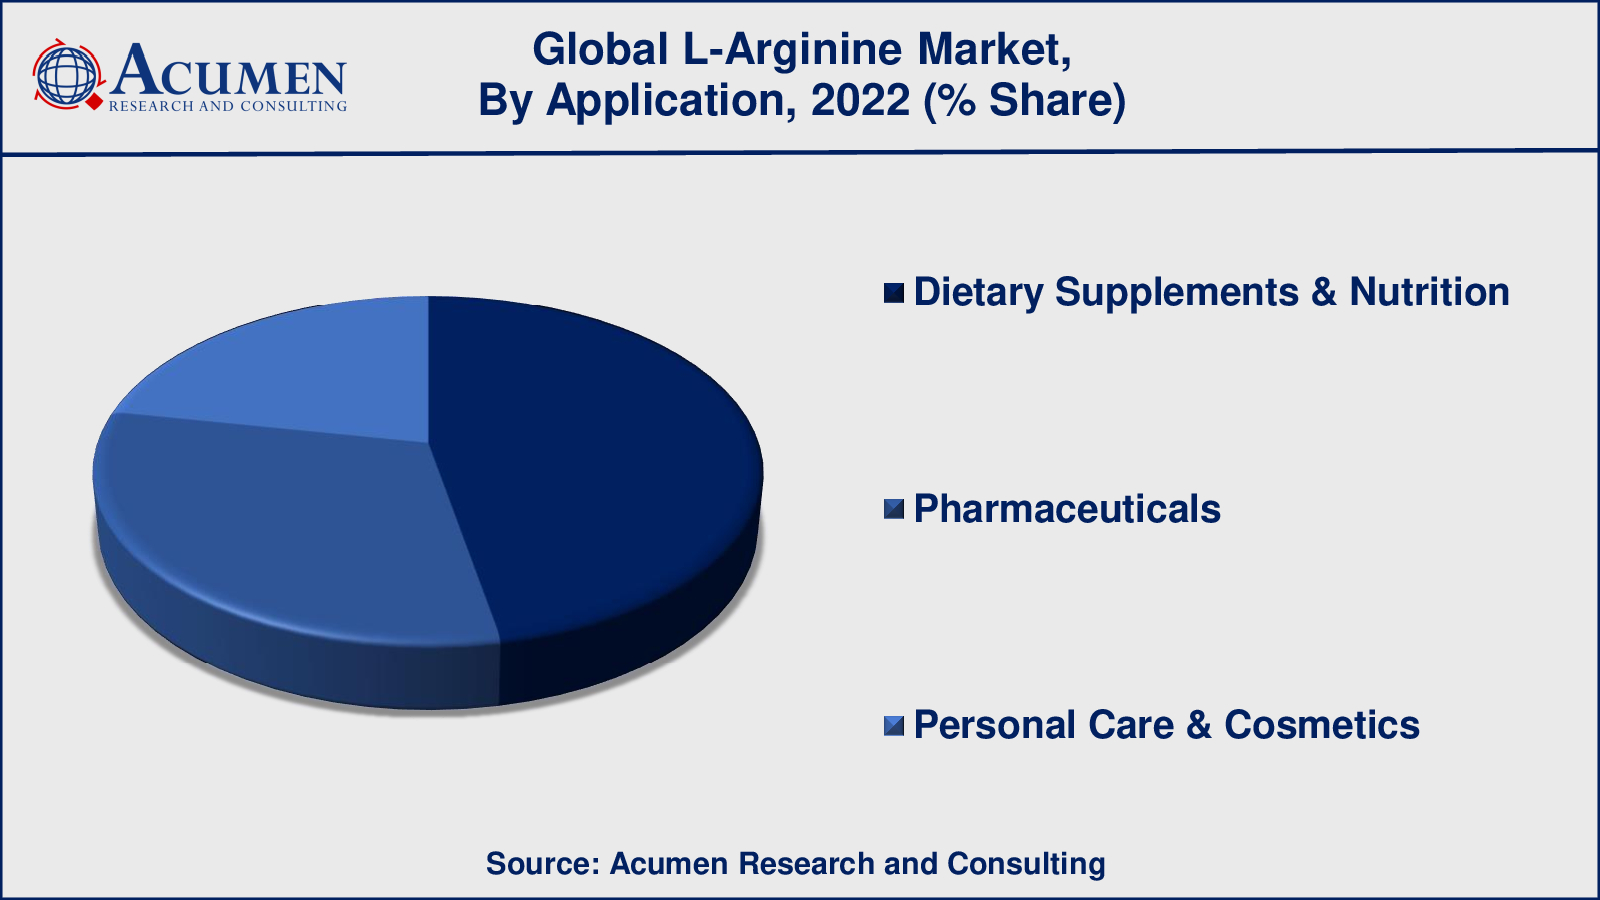
- Based on application, the dietary supplements & nutrition sub-segment generated around 47% share in 2022
- Growing demand for natural and organic products is a popular L-Arginine market trend that fuels the industry demand

L-Arginine is an important amino acid present in protein foods. It is beneficial for blood flow and nitric oxide levels. Arginine synthesizes protein in the body as well as helps in the removal of waste. It aids in creatine formation which aids in recovering muscles after heavy exercise. L-arginine finds extensive utilization among gym persons as it helps in improving sports performance. Also, it helps in regulating blood flow within the body which impacts positively various medical conditions.

Global L-Arginine Market Dynamics
Market Drivers
- Growing demand for sports nutrition and health and wellness products
- Increasing prevalence of cardiovascular diseases and the demand for effective treatments
- Rising awareness about the health benefits of L-Arginine supplements
- Surging demand for functional foods and dietary supplements
Market Restraints
- Side effects associated with high doses of L-Arginine supplements
- Availability of substitutes and alternatives
- High cost of L-Arginine products
Market Opportunities
- Growing demand for L-Arginine in the pharmaceutical industry
- Increasing acceptance for L-Arginine supplements in the aging population
- Surging demand for L-Arginine in animal feed and pet food industries
- Emergence of new applications for L-Arginine in personal care and cosmetics products
- Rising need for plant-based L-Arginine products
L-Arginine Market Report Coverage
| Market | L-Arginine Market |
| L-Arginine Market Size 2022 | USD 683 Million |
| L-Arginine Market Forecast 2032 | USD 1,250.4 Million |
| L-Arginine Market CAGR During 2023 - 2032 | 6.3% |
| L-Arginine Market Analysis Period | 2020 - 2032 |
| L-Arginine Market Base Year | 2022 |
| L-Arginine Market Forecast Data | 2023 - 2032 |
| Segments Covered | By Grade, By Application, And By Geography |
| Regional Scope | North America, Europe, Asia Pacific, Latin America, and Middle East & Africa |
| Key Companies Profiled | Ajinomoto, Kyowa, Evonik, Daesang, Join-Ray Biotechnology, Jingjing, Wuxi Jinghai Amino Acid Co., Ltd., and Shine Star, Shijiazhuang Haitian Amino Acid Co., Ltd., Lubrizol Corporation, Hubei Jingye Chemical Co., Ltd., Tianjin Zhongrui Pharmaceutical Co., Ltd., Novotech Nutraceuticals, Inc., and Glanbia plc. |
| Report Coverage |
Market Trends, Drivers, Restraints, Competitive Analysis, Player Profiling, Covid-19 Analysis, Regulation Analysis |
L-Arginine Market Insights
The market is witnessing significant growth owing to the increasing consumption of L-arginine as a supplement among persons looking out to reduce weight at gym and training centers. L-arginine is usually found in protein-rich foods such as red meat, poultry, soy, whole grains, and dairy products. Rising awareness about the health benefits associated with the consumption of the product is expected to fuel market growth. L-arginine is found to be useful in lowering blood pressure as well as reducing the instances of angina along with treating erectile dysfunction. However, the presence of cheaper and numerous substitutes in the market is expected to hinder market growth in the coming years.
L-Arginine Market, By Segmentation
The worldwide market for L-Arginine is split based on grade, application, and geography.
L-Arginine Grades
- Food Grade
- Pharma Grade

According to the L-Arginine industry analysis, the pharma grade L-Arginine category is projected to dominate the market because of the growing demand for L-Arginine in the pharmaceutical industry. Pharma grade L-Arginine is used as a component in a variety of drugs, including cardiovascular drugs, wound healing medications, and erectile dysfunction medications. The rising prevalence of cardiovascular diseases, as well as the growing demand for effective treatments, are driving demand for L-Arginine in the pharmaceutical grade segment.
Food grade L-Arginine, on the other hand, is primarily used in dietary supplements and functional foods. Growing health and wellness awareness, as well as increased demand for natural and organic products, are driving demand for food grade L-Arginine.
L-Arginine Applications
- Dietary Supplements & Nutrition
- Pharmaceuticals
- Personal Care & Cosmetics

According to the L-Arginine market forecast, the dietary supplements and nutrition application segment is the largest and most dominant segment in the L-Arginine market. This is primarily due to the growing popularity of L-Arginine supplements in sports nutrition and health and wellness products. L-Arginine supplements are well-known for their numerous health benefits, which include increased blood flow, reduced inflammation, and improved immune function. These supplements are popular among athletes and fitness enthusiasts because they help improve exercise performance, muscle mass, and recovery time.
Pharmaceuticals are another important application segment in the L-Arginine market. L-Arginine is found in a variety of pharmaceuticals, including cardiovascular drugs, wound healing agents, and erectile dysfunction medications. The rising prevalence of cardiovascular diseases, as well as the growing demand for effective treatments, are driving L-Arginine demand in the pharmaceutical industry. In the L-Arginine market, the personal care and cosmetics application segment is a smaller segment. L-Arginine is used in personal care and cosmetics products because of its skin conditioning properties, which help to improve skin texture and reduce the signs of ageing.
L-Arginine Market Regional Outlook
North America
- U.S.
- Canada
Europe
- U.K.
- Germany
- France
- Spain
- Rest of Europe
Asia-Pacific
- India
- Japan
- China
- Australia
- South Korea
- Rest of Asia-Pacific
Latin America
- Brazil
- Mexico
- Rest of Latin America
The Middle East & Africa
- South Africa
- GCC Countries
- Rest of the Middle East & Africa (ME&A)
L-Arginine Market Regional Analysis
North America is a significant market for L-Arginine, with the United States being the region's largest consumer. The market in this region is being driven by the high demand for L-Arginine supplements in sports nutrition and health and wellness products.
Europe is another important market for L-Arginine, with Germany, France, and the United Kingdom being the region's largest consumers of L-Arginine products. The pharmaceutical industry's demand for L-Arginine drives the market in this region.
Asia Pacific is the fastest-growing market for L-Arginine, with China, Japan, and India being the region's largest consumers of L-Arginine products. The increase in disposable income, rising health and wellness awareness, and rising demand for functional foods and dietary supplements are driving the market in this region.
L-Arginine Market Players
Some of the top L-Arginine companies offered in the professional report include Ajinomoto, Kyowa, Evonik, Daesang, Join-Ray Biotechnology, Jingjing, Wuxi Jinghai Amino Acid Co., Ltd., and Shine Star, Shijiazhuang Haitian Amino Acid Co., Ltd., Lubrizol Corporation, Hubei Jingye Chemical Co., Ltd., Tianjin Zhongrui Pharmaceutical Co., Ltd., Novotech Nutraceuticals, Inc., and Glanbia plc.
Frequently Asked Questions
What was the market size of the global L-Arginine in 2022?
The market size of L-Arginine was USD 683 million in 2022.
What is the CAGR of the global L-Arginine market from 2023 to 2032?
The CAGR of L-Arginine is 6.3% during the analysis period of 2023 to 2032.
Which are the key players in the L-Arginine market?
The key players operating in the global L-Arginine market is includes Ajinomoto, Kyowa, Evonik, Daesang, Join-Ray Biotechnology, Jingjing, Wuxi Jinghai Amino Acid Co., Ltd., and Shine Star, Shijiazhuang Haitian Amino Acid Co., Ltd., Lubrizol Corporation, Hubei Jingye Chemical Co., Ltd., Tianjin Zhongrui Pharmaceutical Co., Ltd., Novotech Nutraceuticals, Inc., and Glanbia plc.
Which region dominated the global L-Arginine market share?
North America held the dominating position in L-Arginine industry during the analysis period of 2023 to 2032.
Which region registered fastest CAGR from 2023 to 2032?
Asia-Pacific region exhibited fastest growing CAGR for market of L-Arginine during the analysis period of 2023 to 2032.
What are the current trends and dynamics in the global L-Arginine industry?
The current trends and dynamics in the L-Arginine industry include growing demand for sports nutrition and health and wellness products, increasing prevalence of cardiovascular diseases and the demand for effective treatments, and rising awareness about the health benefits of L-Arginine supplements.
Which grade held the maximum share in 2022?
The pharma grade held the maximum share of the L-Arginine industry.?


