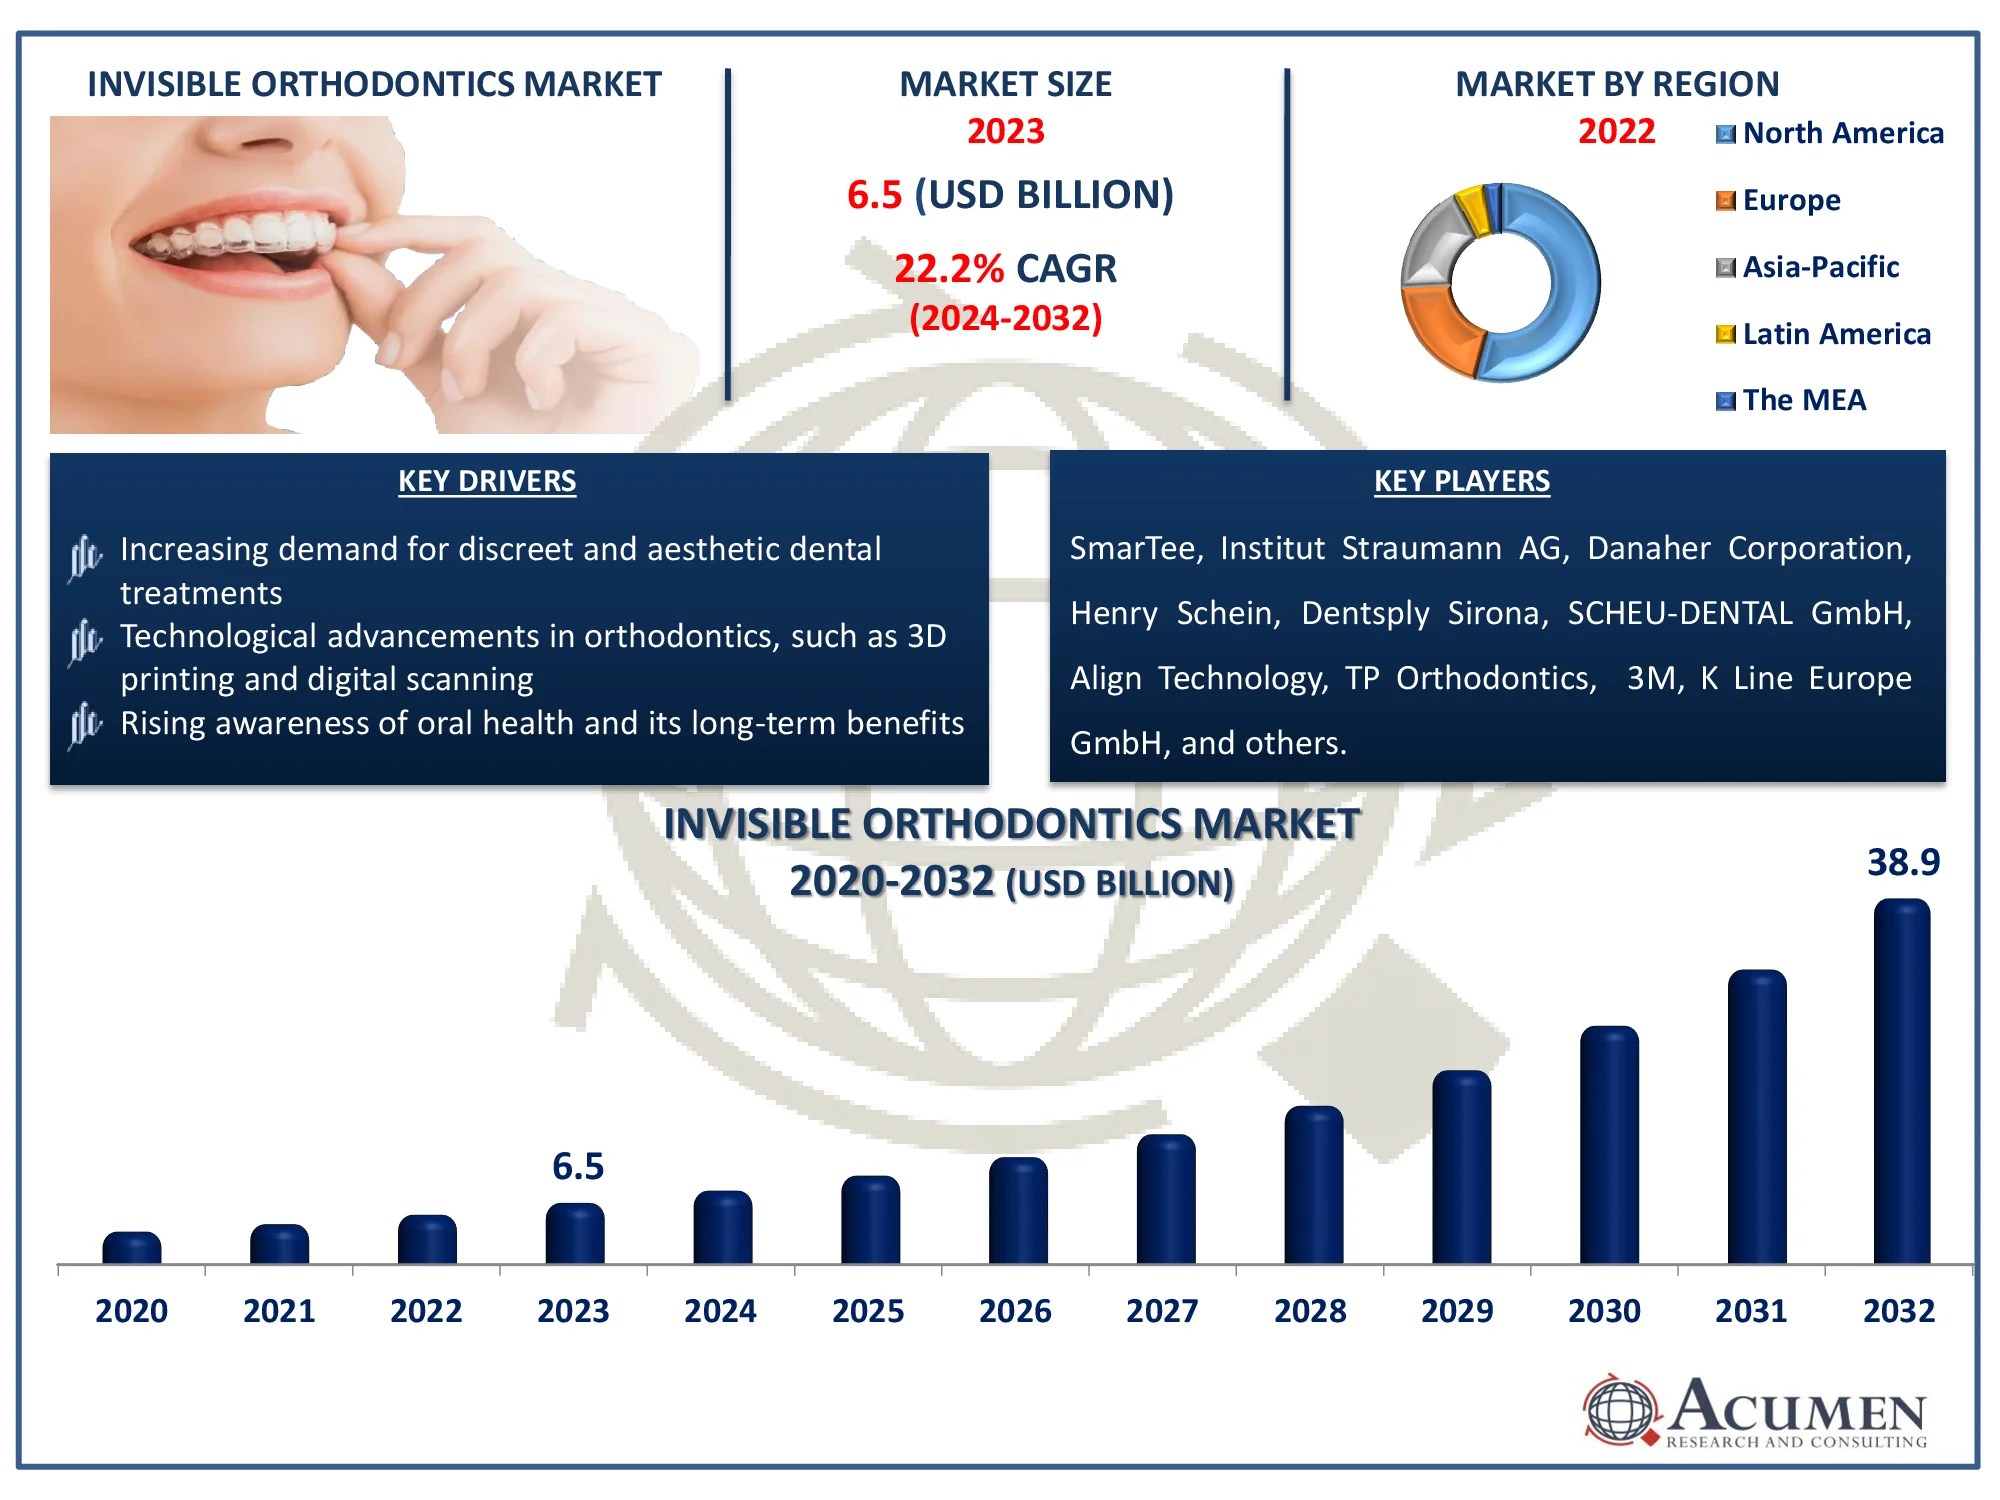
The Global Invisible Orthodontics Market Size accounted for USD 6.5 Billion in 2023 and is estimated to achieve a market size of USD 38.9 Billion by 2032 growing at a CAGR of 22.2% from 2024 to 2032.
Invisible Orthodontics Market (By Product: Ceramic Braces, Clear Aligners, Lingual Braces; By Patient Group: Adults, Teenagers; By Dentist Type: General Dentists, Orthodontists, By End-user: Hospitals, Dental Clinics, Others, and By Region: North America, Europe, Asia-Pacific, Latin America, and MEA)
Invisible Orthodontics Market Highlights
- The global invisible orthodontics market is expected to reach USD 38.9 billion by 2032, with a CAGR of 22.2% from 2024 to 2032
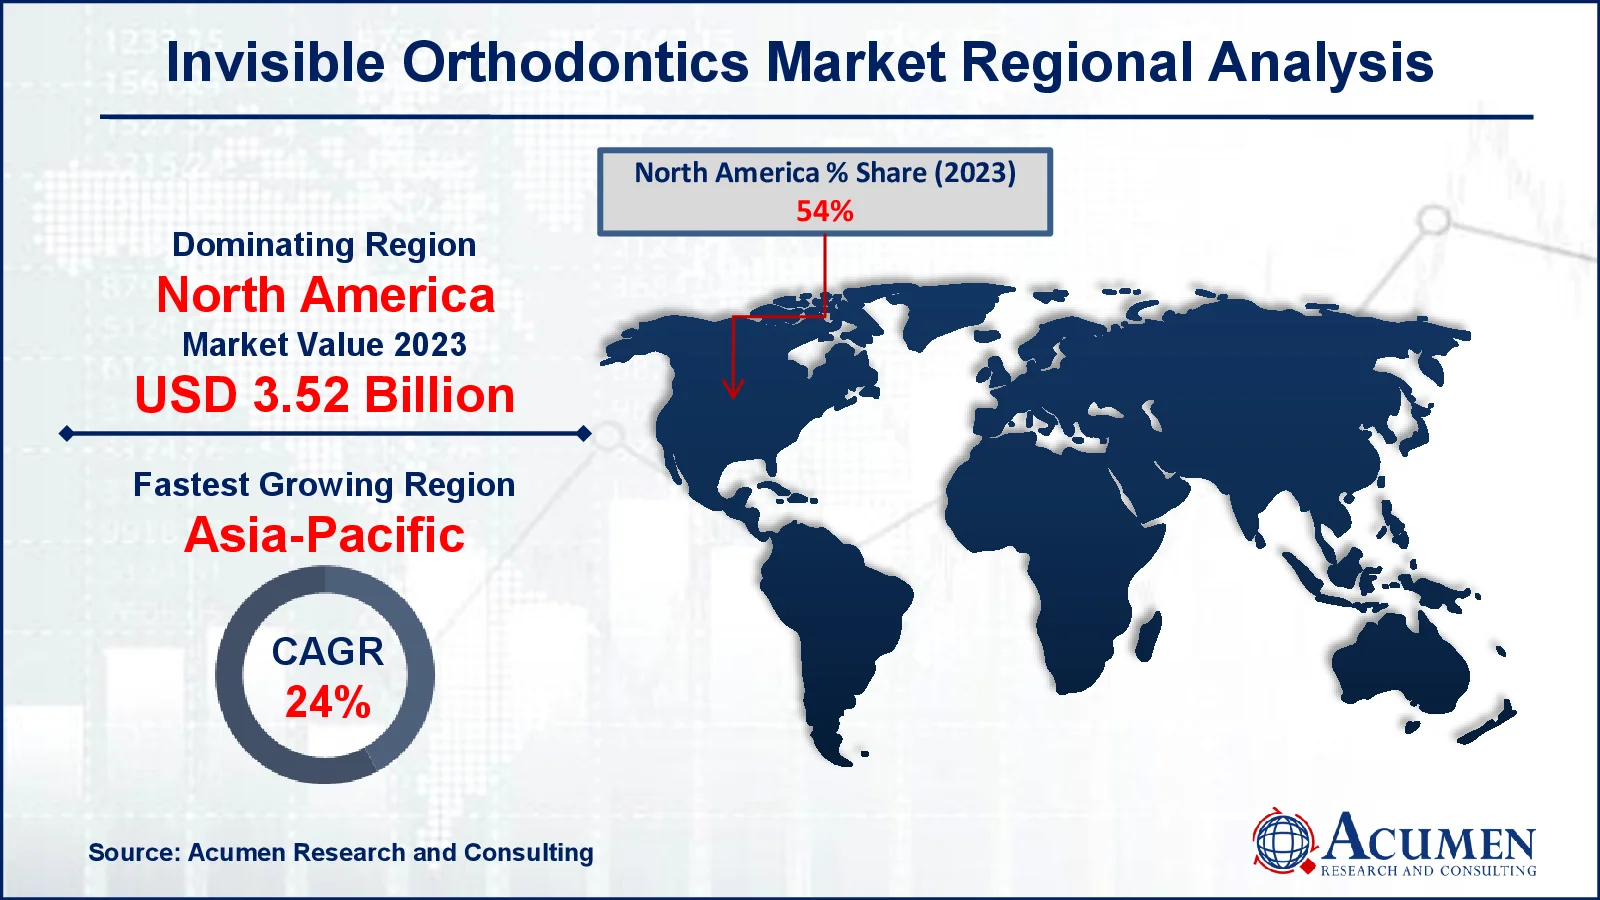
- In 2023, the North American invisible orthodontics market was valued at approximately USD 3.52 billion
- The Asia-Pacific region is projected to grow at a CAGR of over 24% from 2024 to 2032
- The clear aligners product sub-segment accounted for 84% of the market share in 2023
- The adults patient group sub-segment held 65% of the market share in 2023
- Increasing demand for aesthetic dental treatments, supported by advancements in 3D printing and AI, is a invisible orthodontics market trend driving growth
Invisible orthodontics is advanced dental treatments that straighten teeth without utilizing traditional metal braces. These treatments, like as clear aligners and lingual braces, are intended to be less noticeable, giving patients a more modest choice. Clear aligners are custom-made, removable trays that progressively move teeth into position, whereas lingual braces are connected to the back of the teeth and remain hidden. The primary purpose of invisible orthodontics is to repair misaligned teeth, such as overbites, underbites, and crooked teeth. It not only enhances the appearance of a person's smile but also aids in the maintenance of good dental hygiene. Straightened teeth are easier to clean and care for, lowering the risk of oral health issues.
Global Invisible Orthodontics Market Dynamics
Market Drivers
- Increasing demand for discreet and aesthetic dental treatments
- Technological advancements in orthodontics, such as 3D printing and digital scanning
- Rising awareness of oral health and its long-term benefits
Market Restraints
- High treatment costs compared to traditional braces
- Limited insurance reimbursement for cosmetic dental procedures
- Lack of orthodontic professionals in developing regions
Market Opportunities
- Expansion of invisible orthodontics in emerging markets
- Growth of teledentistry and remote orthodontic consultations
- Development of more affordable and efficient aligner technologies
Invisible Orthodontics Market Report Coverage
Market |
Invisible Orthodontics Market
|
Invisible Orthodontics Market Size 2022 |
USD 6.5 Billion
|
Invisible Orthodontics Market Forecast 2032 |
USD 38.9 Billion |
Invisible Orthodontics Market CAGR During 2023 - 2032 |
22.2% |
Invisible Orthodontics Market Analysis Period |
2020 - 2032 |
Invisible Orthodontics Market Base Year
|
2022 |
Invisible Orthodontics Market Forecast Data |
2023 - 2032 |
Segments Covered |
By Product, By Patient Group, By Dentist Type, By End-User, And By Geography
|
Regional Scope |
North America, Europe, Asia Pacific, Latin America, and Middle East & Africa |
Key Companies Profiled |
SmarTee, Institut Straumann AG, Danaher Corporation, Henry Schein, Dentsply Sirona, SCHEU-DENTAL GmbH, Align Technology, Inc, TP Orthodontics, Inc., 3M, K Line Europe GmbH, and Great Lakes Dental Technologies.
|
Report Coverage
|
Market Trends, Drivers, Restraints, Competitive Analysis, Player Profiling, Covid-19 Analysis, Regulation Analysis |
Invisible Orthodontics Market Insights
Invisible orthodontics is dental braces and aligners that are typically used to correct and realign teeth in patients with moderately crowded teeth or mild dispersing difficulties. Metal braces are the most often used orthodontic therapy for malocclusion. In any event, traditional metal supports produce a metal mouth appearance, making them highly visible. They can also cause tooth decalcification and mouth ulcers. This is due to the high demand for innovative orthodontic treatments, such as clear aligners. Awareness of invisible aligners is expected to grow in the coming years, benefiting the invisible orthodontics market.
Limited insurance reimbursement for cosmetic dental operations is a key barrier to the invisible orthodontics business. Many insurance companies define clear aligners and other invisible treatments as cosmetic rather than medical, resulting in limited or no coverage. This raises patients' out-of-pocket expenditures, making treatments less accessible to a wide range of people. As a result, potential patients may postpone or refuse treatment due to financial constraints, limiting market expansion.
The development of more affordable and efficient aligner technology opens up a substantial opportunity for the invisible orthodontics market by making treatments more accessible to a wider range of patients. For instance, Angel Aligner will introduce its custom-made clear aligners and aligner technology in the United States in July 2023. Companies can offer aligners at competitive pricing by lowering production costs and utilizing new manufacturing techniques. This development into cost-effective solutions overcomes a major barrier of high treatment prices, attracting more patients who previously could not afford invisible orthodontics. Furthermore, enhanced efficiency in aligner design results in faster, more exact treatment outcomes, which increases client satisfaction. As a result, the market is projected to expand, particularly in emerging economies.
Invisible Orthodontics Market Segmentation
The worldwide market for invisible orthodontics is split based on product, patient group, dentist type, end-user, and geography.
Invisible Orthodontics Based on Product
- Ceramic Braces
- Clear Aligners
- Lingual Braces
According to the invisible orthodontics industry analysis, the clear aligner’s category is expected to account for the majority of the global market over the forecast period, owing to an increase in focus on style within the target patient pool, which would result in high demand for modern orthodontic machines later on. Clear aligners have several advantages to metallic, earthenware, and lingual props, including increased comfort and adjustability. This is essential to support their adoption rate over the next few years.
Invisible Orthodontics Based on Patient Group
As per the invisible orthodontics market analysis, the teenager’s segment is expected to grow at a high CAGR over the forecast period, owing to an increased emphasis on style among teenagers to improve the appearance and capacity of their grins. Furthermore, an increase in focus efforts by encouraging players to raise awareness about invisible aligners among children and their families is likely to promote industry growth. For example, Align Technology Inc. collaborated with Awesomeness TV to create a series of unique short films about invisible aligners in order to connect with adolescent audiences and grow their brand Invisalign.
Invisible Orthodontics Based on Dentist Type
- General Dentists
- Orthodontists
According to the invisible orthodontics industry forecast, the general dentists are predicted to expand as aligner technology become more accessible and treatment processes become simpler. Clear aligners require less specialized training than traditional braces; therefore more general dentists are introducing them into their operations. This broadens the scope of invisible orthodontics, making it available to a larger patient base without the requirement for a visit to an orthodontic professional.
Invisible Orthodontics Based on End-user
- Hospitals
- Dental Clinics
- Others
According to the invisible orthodontics market forecast, hospitals are expected to dominate market as end users. They provide complete orthodontic care, including difficult cases that may necessitate a mix of procedures not available in smaller practices. Furthermore, hospitals frequently serve a higher volume of patients, fueling demand for invisible orthodontic solutions such as transparent aligners. Their ability to combine dental treatments with other healthcare services appeals to individuals looking for convenience and high-quality care.
Invisible Orthodontics Market Regional Outlook
North America
Europe
- U.K.
- Germany
- France
- Spain
- Rest of Europe
Asia-Pacific
- India
- Japan
- China
- Australia
- South Korea
- Rest of Asia-Pacific
Latin America
- Brazil
- Mexico
- Rest of Latin America
The Middle East & Africa
- South Africa
- GCC Countries
- Rest of the Middle East & Africa (ME&A)
Invisible Orthodontics Market Regional Analysis
For several reasons, North America accounted for a significant portion of the global market in 2023. The increased use of transparent aligners among patients, as well as the rise in cases of orthodontic difficulties, is expected to drive the invisible orthodontics market in these areas. For instance, according to Burke & Redford Orthodontists, half of the 2.0 million persons in the United States who have orthodontic treatment each year are teenagers, or those aged 13 to 19.
The Asia-Pacific market is expected to grow at a rapid pace over the next several years. An increase in malocclusion cases in emerging countries and an increase in awareness regarding invisible and removable orthodontic treatment alternatives are expected to drive the market in the forecast year.
Invisible Orthodontics Market Players
Some of the top invisible orthodontics companies offered in our report include SmarTee, Institut Straumann AG, Danaher Corporation, Henry Schein, Dentsply Sirona, SCHEU-DENTAL GmbH, Align Technology, Inc, TP Orthodontics, Inc., 3M, K Line Europe GmbH, and Great Lakes Dental Technologies.
CHAPTER 1. Industry Overview of Invisible Orthodontics Market
1.1. Definition and Scope
1.1.1. Definition of Invisible Orthodontics
1.1.2. Market Segmentation
1.1.3. Years Considered for the Study
1.1.4. Assumptions and Acronyms Used
1.1.4.1. Market Assumptions and Market Forecast
1.1.4.2. Acronyms Used in Global Invisible Orthodontics Market
1.2. Summary
1.2.1. Executive Summary
1.2.2. Invisible Orthodontics Market By Product
1.2.3. Invisible Orthodontics Market By Patient Group
1.2.4. Invisible Orthodontics Market By End-user
1.2.5. Invisible Orthodontics Market By Region
CHAPTER 2. Research Approach
2.1. Methodology
2.1.1. Research Programs
2.1.2. Market Size Estimation
2.1.3. Market Breakdown and Data Triangulation
2.2. Data Source
2.2.1. Secondary Sources
2.2.2. Primary Sources
CHAPTER 3. Market Dynamics And Competition Analysis
3.1. Market Drivers
3.1.1. Driver 1
3.1.2. Driver 2
3.1.3. Driver 3
3.2. Restraints and Challenges
3.2.1. Restraint 1
3.2.2. Restraint 2
3.2.3. Restraint 3
3.3. Growth Opportunities
3.3.1. Opportunity 1
3.3.2. Opportunity 2
3.3.3. Opportunity 3
3.4. Porter’s Five Forces Analysis
3.4.1. Bargaining Power of Suppliers
3.4.2. Bargaining Power of Buyers
3.4.3. Threat of Substitute
3.4.4. Threat of New Entrants
3.4.5. Degree of Competition
3.5. Market Concentration Ratio and Market Maturity Analysis of Invisible Orthodontics Market
3.5.1. Go To Market Strategy
3.5.1.1. Introduction
3.5.1.2. Growth
3.5.1.3. Maturity
3.5.1.4. Saturation
3.5.1.5. Possible Development
3.6. Technological Roadmap for Invisible Orthodontics Market
3.7. Value Chain Analysis
3.7.1. List of Key Manufacturers
3.7.2. List of Customers
3.7.3. Level of Integration
3.8. Cost Structure Analysis
3.8.1. Price Trend of Key Raw Materials
3.8.2. Raw Material Suppliers
3.8.3. Proportion of Manufacturing Cost Structure
3.8.3.1. Raw Material
3.8.3.2. Labor Cost
3.8.3.3. Manufacturing Expense
3.9. Regulatory Compliance
3.10. Competitive Landscape, 2023
3.10.1. Player Positioning Analysis
3.10.2. Key Strategies Adopted By Leading Players
CHAPTER 4. Manufacturing Plant Analysis
4.1. Manufacturing Plant Location and Establish Date of Major Manufacturers in 2023
4.2. R&D Status of Major Manufacturers in 2023
CHAPTER 5. Invisible Orthodontics Market By Product
5.1. Introduction
5.2. Invisible Orthodontics Revenue By Product
5.2.1. Invisible Orthodontics Revenue (USD Billion) and Forecast, By Product, 2020-2032
5.2.2. Ceramic Braces
5.2.2.1. Ceramic Braces Market Revenue (USD Billion) and Growth Rate (%), 2020-2032
5.2.3. Clear Aligners
5.2.3.1. Clear Aligners Market Revenue (USD Billion) and Growth Rate (%), 2020-2032
5.2.4. Lingual Braces
5.2.4.1. Lingual Braces Market Revenue (USD Billion) and Growth Rate (%), 2020-2032
CHAPTER 6. Invisible Orthodontics Market By Patient Group
6.1. Introduction
6.2. Invisible Orthodontics Revenue By Patient Group
6.2.1. Invisible Orthodontics Revenue (USD Billion) and Forecast, By Patient Group, 2020-2032
6.2.2. Adults
6.2.2.1. Adults Market Revenue (USD Billion) and Growth Rate (%), 2020-2032
6.2.3. Teenagers
6.2.3.1. Teenagers Market Revenue (USD Billion) and Growth Rate (%), 2020-2032
CHAPTER 7. Invisible Orthodontics Market By Dentist Type
7.1. Introduction
7.2. Invisible Orthodontics Revenue By Dentist Type
7.2.1. Invisible Orthodontics Revenue (USD Billion) and Forecast, By Dentist Type, 2020-2032
7.2.2. General Dentists
7.2.2.1. General Dentists Market Revenue (USD Billion) and Growth Rate (%), 2020-2032
7.2.3. Orthodontists
7.2.3.1. Orthodontists Market Revenue (USD Billion) and Growth Rate (%), 2020-2032
CHAPTER 8. Invisible Orthodontics Market By End-user
8.1. Introduction
8.2. Invisible Orthodontics Revenue By End-user
8.2.1. Invisible Orthodontics Revenue (USD Billion) and Forecast, By End-user, 2020-2032
8.2.2. Hospitals
8.2.2.1. Hospitals Market Revenue (USD Billion) and Growth Rate (%), 2020-2032
8.2.3. Dental Clinics
8.2.3.1. Dental Clinics Market Revenue (USD Billion) and Growth Rate (%), 2020-2032
8.2.4. Others
8.2.4.1. Others Market Revenue (USD Billion) and Growth Rate (%), 2020-2032
CHAPTER 9. North America Invisible Orthodontics Market By Country
9.1. North America Invisible Orthodontics Market Overview
9.2. U.S.
9.2.1. U.S. Invisible Orthodontics Revenue (USD Billion) and Forecast By Product, 2020-2032
9.2.2. U.S. Invisible Orthodontics Revenue (USD Billion) and Forecast By Patient Group, 2020-2032
9.2.3. U.S. Invisible Orthodontics Revenue (USD Billion) and Forecast By Dentist Type, 2020-2032
9.2.4. U.S. Invisible Orthodontics Revenue (USD Billion) and Forecast By End-user, 2020-2032
9.3. Canada
9.3.1. Canada Invisible Orthodontics Revenue (USD Billion) and Forecast By Product, 2020-2032
9.3.2. Canada Invisible Orthodontics Revenue (USD Billion) and Forecast By Patient Group, 2020-2032
9.3.3. Canada Invisible Orthodontics Revenue (USD Billion) and Forecast By Dentist Type, 2020-2032
9.3.4. Canada Invisible Orthodontics Revenue (USD Billion) and Forecast By End-user, 2020-2032
9.4. North America PEST Analysis
CHAPTER 10. Europe Invisible Orthodontics Market By Country
10.1. Europe Invisible Orthodontics Market Overview
10.2. U.K.
10.2.1. U.K. Invisible Orthodontics Revenue (USD Billion) and Forecast By Product, 2020-2032
10.2.2. U.K. Invisible Orthodontics Revenue (USD Billion) and Forecast By Patient Group, 2020-2032
10.2.3. U.K. Invisible Orthodontics Revenue (USD Billion) and Forecast By Dentist Type, 2020-2032
10.2.4. U.K. Invisible Orthodontics Revenue (USD Billion) and Forecast By End-user, 2020-2032
10.3. Germany
10.3.1. Germany Invisible Orthodontics Revenue (USD Billion) and Forecast By Product, 2020-2032
10.3.2. Germany Invisible Orthodontics Revenue (USD Billion) and Forecast By Patient Group, 2020-2032
10.3.3. Germany Invisible Orthodontics Revenue (USD Billion) and Forecast By Dentist Type, 2020-2032
10.3.4. Germany Invisible Orthodontics Revenue (USD Billion) and Forecast By End-user, 2020-2032
10.4. France
10.4.1. France Invisible Orthodontics Revenue (USD Billion) and Forecast By Product, 2020-2032
10.4.2. France Invisible Orthodontics Revenue (USD Billion) and Forecast By Patient Group, 2020-2032
10.4.3. France Invisible Orthodontics Revenue (USD Billion) and Forecast By Dentist Type, 2020-2032
10.4.4. France Invisible Orthodontics Revenue (USD Billion) and Forecast By End-user, 2020-2032
10.5. Spain
10.5.1. Spain Invisible Orthodontics Revenue (USD Billion) and Forecast By Product, 2020-2032
10.5.2. Spain Invisible Orthodontics Revenue (USD Billion) and Forecast By Patient Group, 2020-2032
10.5.3. Spain Invisible Orthodontics Revenue (USD Billion) and Forecast By Dentist Type, 2020-2032
10.5.4. Spain Invisible Orthodontics Revenue (USD Billion) and Forecast By End-user, 2020-2032
10.6. Rest of Europe
10.6.1. Rest of Europe Invisible Orthodontics Revenue (USD Billion) and Forecast By Product, 2020-2032
10.6.2. Rest of Europe Invisible Orthodontics Revenue (USD Billion) and Forecast By Patient Group, 2020-2032
10.6.3. Rest of Europe Invisible Orthodontics Revenue (USD Billion) and Forecast By Dentist Type, 2020-2032
10.6.4. Rest of Europe Invisible Orthodontics Revenue (USD Billion) and Forecast By End-user, 2020-2032
10.7. Europe PEST Analysis
CHAPTER 11. Asia Pacific Invisible Orthodontics Market By Country
11.1. Asia Pacific Invisible Orthodontics Market Overview
11.2. China
11.2.1. China Invisible Orthodontics Revenue (USD Billion) and Forecast By Product, 2020-2032
11.2.2. China Invisible Orthodontics Revenue (USD Billion) and Forecast By Patient Group, 2020-2032
11.2.3. China Invisible Orthodontics Revenue (USD Billion) and Forecast By Dentist Type, 2020-2032
11.2.4. China Invisible Orthodontics Revenue (USD Billion) and Forecast By End-user, 2020-2032
11.3. Japan
11.3.1. Japan Invisible Orthodontics Revenue (USD Billion) and Forecast By Product, 2020-2032
11.3.2. Japan Invisible Orthodontics Revenue (USD Billion) and Forecast By Patient Group, 2020-2032
11.3.3. Japan Invisible Orthodontics Revenue (USD Billion) and Forecast By Dentist Type, 2020-2032
11.3.4. Japan Invisible Orthodontics Revenue (USD Billion) and Forecast By End-user, 2020-2032
11.4. India
11.4.1. India Invisible Orthodontics Revenue (USD Billion) and Forecast By Product, 2020-2032
11.4.2. India Invisible Orthodontics Revenue (USD Billion) and Forecast By Patient Group, 2020-2032
11.4.3. India Invisible Orthodontics Revenue (USD Billion) and Forecast By Dentist Type, 2020-2032
11.4.4. India Invisible Orthodontics Revenue (USD Billion) and Forecast By End-user, 2020-2032
11.5. Australia
11.5.1. Australia Invisible Orthodontics Revenue (USD Billion) and Forecast By Product, 2020-2032
11.5.2. Australia Invisible Orthodontics Revenue (USD Billion) and Forecast By Patient Group, 2020-2032
11.5.3. Australia Invisible Orthodontics Revenue (USD Billion) and Forecast By Dentist Type, 2020-2032
11.5.4. Australia Invisible Orthodontics Revenue (USD Billion) and Forecast By End-user, 2020-2032
11.6. South Korea
11.6.1. South Korea Invisible Orthodontics Revenue (USD Billion) and Forecast By Product, 2020-2032
11.6.2. South Korea Invisible Orthodontics Revenue (USD Billion) and Forecast By Patient Group, 2020-2032
11.6.3. South Korea Invisible Orthodontics Revenue (USD Billion) and Forecast By Dentist Type, 2020-2032
11.6.4. South Korea Invisible Orthodontics Revenue (USD Billion) and Forecast By End-user, 2020-2032
11.7. Rest of Asia-Pacific
11.7.1. Rest of Asia-Pacific Invisible Orthodontics Revenue (USD Billion) and Forecast By Product, 2020-2032
11.7.2. Rest of Asia-Pacific Invisible Orthodontics Revenue (USD Billion) and Forecast By Patient Group, 2020-2032
11.7.3. Rest of Asia-Pacific Invisible Orthodontics Revenue (USD Billion) and Forecast By Dentist Type, 2020-2032
11.7.4. Rest of Asia-Pacific Invisible Orthodontics Revenue (USD Billion) and Forecast By End-user, 2020-2032
11.8. Asia Pacific PEST Analysis
CHAPTER 12. Latin America Invisible Orthodontics Market By Country
12.1. Latin America Invisible Orthodontics Market Overview
12.2. Brazil
12.2.1. Brazil Invisible Orthodontics Revenue (USD Billion) and Forecast By Product, 2020-2032
12.2.2. Brazil Invisible Orthodontics Revenue (USD Billion) and Forecast By Patient Group, 2020-2032
12.2.3. Brazil Invisible Orthodontics Revenue (USD Billion) and Forecast By Dentist Type, 2020-2032
12.2.4. Brazil Invisible Orthodontics Revenue (USD Billion) and Forecast By End-user, 2020-2032
12.3. Mexico
12.3.1. Mexico Invisible Orthodontics Revenue (USD Billion) and Forecast By Product, 2020-2032
12.3.2. Mexico Invisible Orthodontics Revenue (USD Billion) and Forecast By Patient Group, 2020-2032
12.3.3. Mexico Invisible Orthodontics Revenue (USD Billion) and Forecast By Dentist Type, 2020-2032
12.3.4. Mexico Invisible Orthodontics Revenue (USD Billion) and Forecast By End-user, 2020-2032
12.4. Rest of Latin America
12.4.1. Rest of Latin America Invisible Orthodontics Revenue (USD Billion) and Forecast By Product, 2020-2032
12.4.2. Rest of Latin America Invisible Orthodontics Revenue (USD Billion) and Forecast By Patient Group, 2020-2032
12.4.3. Rest of Latin America Invisible Orthodontics Revenue (USD Billion) and Forecast By Dentist Type, 2020-2032
12.4.4. Rest of Latin America Invisible Orthodontics Revenue (USD Billion) and Forecast By End-user, 2020-2032
12.5. Latin America PEST Analysis
CHAPTER 13. Middle East & Africa Invisible Orthodontics Market By Country
13.1. Middle East & Africa Invisible Orthodontics Market Overview
13.2. GCC
13.2.1. GCC Invisible Orthodontics Revenue (USD Billion) and Forecast By Product, 2020-2032
13.2.2. GCC Invisible Orthodontics Revenue (USD Billion) and Forecast By Patient Group, 2020-2032
13.2.3. GCC Invisible Orthodontics Revenue (USD Billion) and Forecast By Dentist Type, 2020-2032
13.2.4. GCC Invisible Orthodontics Revenue (USD Billion) and Forecast By End-user, 2020-2032
13.3. South Africa
13.3.1. South Africa Invisible Orthodontics Revenue (USD Billion) and Forecast By Product, 2020-2032
13.3.2. South Africa Invisible Orthodontics Revenue (USD Billion) and Forecast By Patient Group, 2020-2032
13.3.3. South Africa Invisible Orthodontics Revenue (USD Billion) and Forecast By Dentist Type, 2020-2032
13.3.4. South Africa Invisible Orthodontics Revenue (USD Billion) and Forecast By End-user, 2020-2032
13.4. Rest of Middle East & Africa
13.4.1. Rest of Middle East & Africa Invisible Orthodontics Revenue (USD Billion) and Forecast By Product, 2020-2032
13.4.2. Rest of Middle East & Africa Invisible Orthodontics Revenue (USD Billion) and Forecast By Patient Group, 2020-2032
13.4.3. Rest of Middle East & Africa Invisible Orthodontics Revenue (USD Billion) and Forecast By Dentist Type, 2020-2032
13.4.4. Rest of Middle East & Africa Invisible Orthodontics Revenue (USD Billion) and Forecast By End-user, 2020-2032
13.5. Middle East & Africa PEST Analysis
CHAPTER 14. Player Analysis Of Invisible Orthodontics Market
14.1. Invisible Orthodontics Market Company Share Analysis
14.2. Competition Matrix
14.2.1. Competitive Benchmarking of key players by price, presence, market share, and R&D investment
14.2.2. New Product Launches and Product Enhancements
14.2.3. Mergers And Acquisition In Global Invisible Orthodontics Market
14.2.4. Partnership, Joint Ventures and Strategic Alliances/ Sales Agreements
CHAPTER 15. Company Profile
15.1. Smartee
15.1.1. Company Snapshot
15.1.2. Business Overview
15.1.3. Financial Overview
15.1.3.1. Revenue (USD Billion), 2023
15.1.3.2. Smartee 2023 Invisible Orthodontics Business Regional Distribution
15.1.4. Product /Service and Specification
15.1.5. Recent Developments & Business Strategy
15.2. Institut Straumann AG
15.3. Danaher Corporation
15.4. Henry Schein
15.5. Dentsply Sirona
15.6. SCHEU-DENTAL GmbH
15.7. Align Technology, Inc
15.8. TP Orthodontics, Inc.
15.9. 3M
15.10. K Line Europe GmbH
15.11. Great Lakes Dental Technologies