Healthcare and Laboratory Labels Market Size - Global Industry, Share, Analysis, Trends and Forecast 2024 - 2032
Published :
Report ID:
Pages :
Format :
Healthcare and Laboratory Labels Market Size - Global Industry, Share, Analysis, Trends and Forecast 2024 - 2032
Report Coverage
- Industry Dynamics
- Market Size and Forecast Data
- Segment Analysis
- Competitive Landscape
- Regional Analysis with a Niche Focus on Country-Level Data
- High Level Analysis - Porter's, PESTEL, Value Chain, etc.
- Company Profiles of Key Players
- Option to Customize the Report As Per Your Specific Need
Request Sample Report
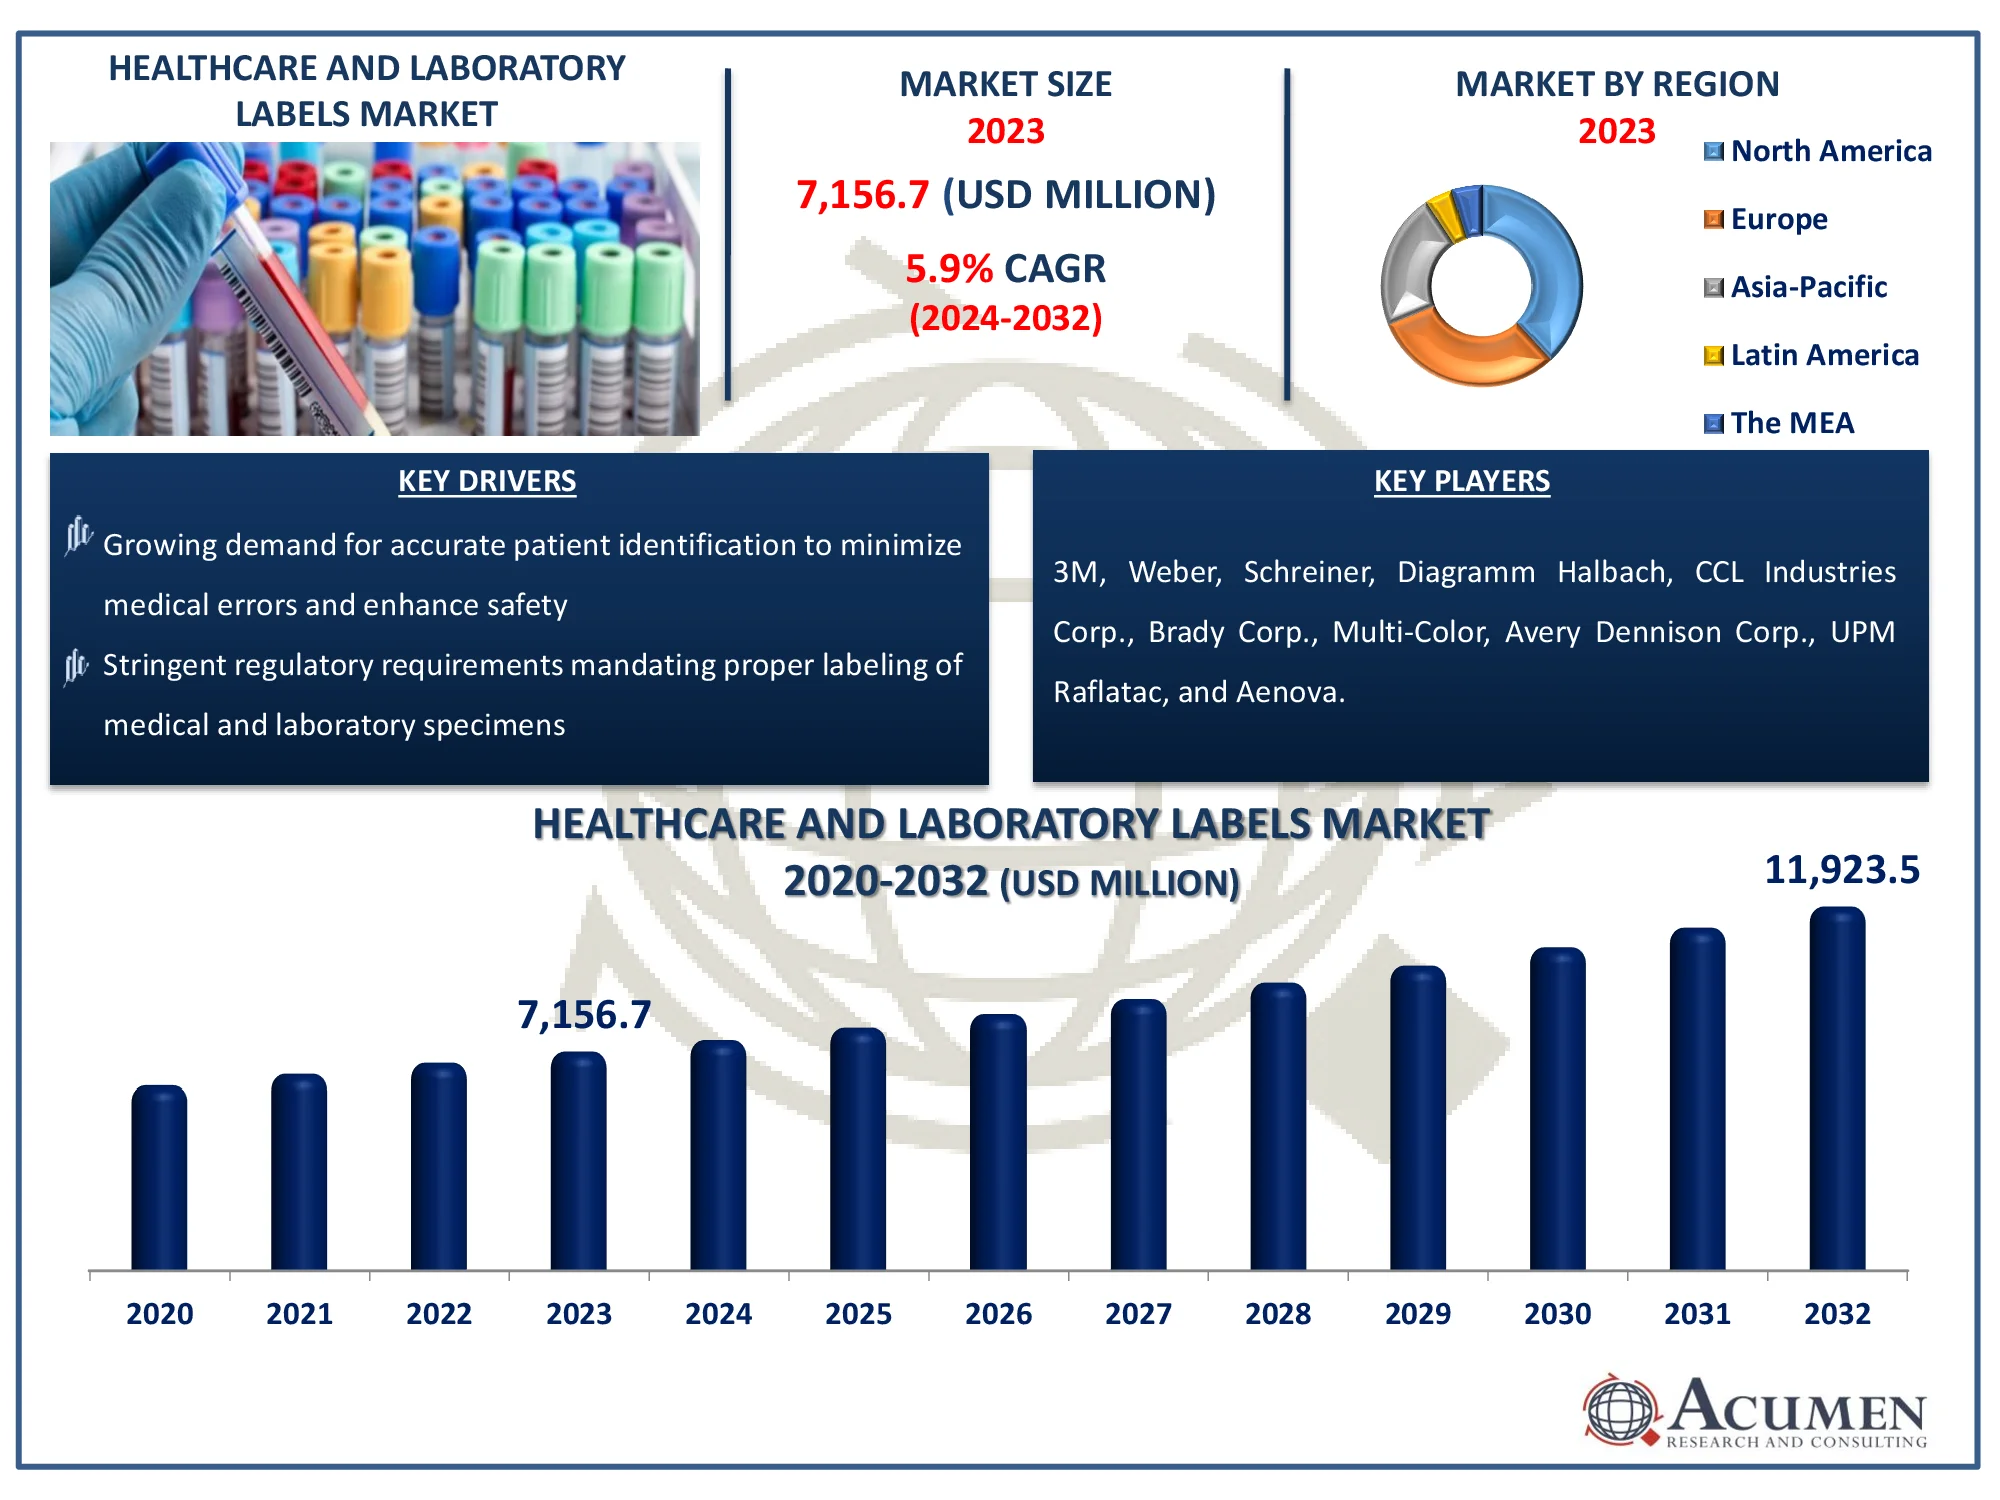
The Global Healthcare and Laboratory Labels Market Size accounted for USD 7,156.7 Million in 2023 and is estimated to achieve a market size of USD 11,923.5 Million by 2032 growing at a CAGR of 5.9% from 2024 to 2032.
Healthcare and Laboratory Labels Market Highlights
- Global healthcare and laboratory labels market revenue is poised to garner USD 11,923.5 million by 2032 with a CAGR of 5.9% from 2024 to 2032
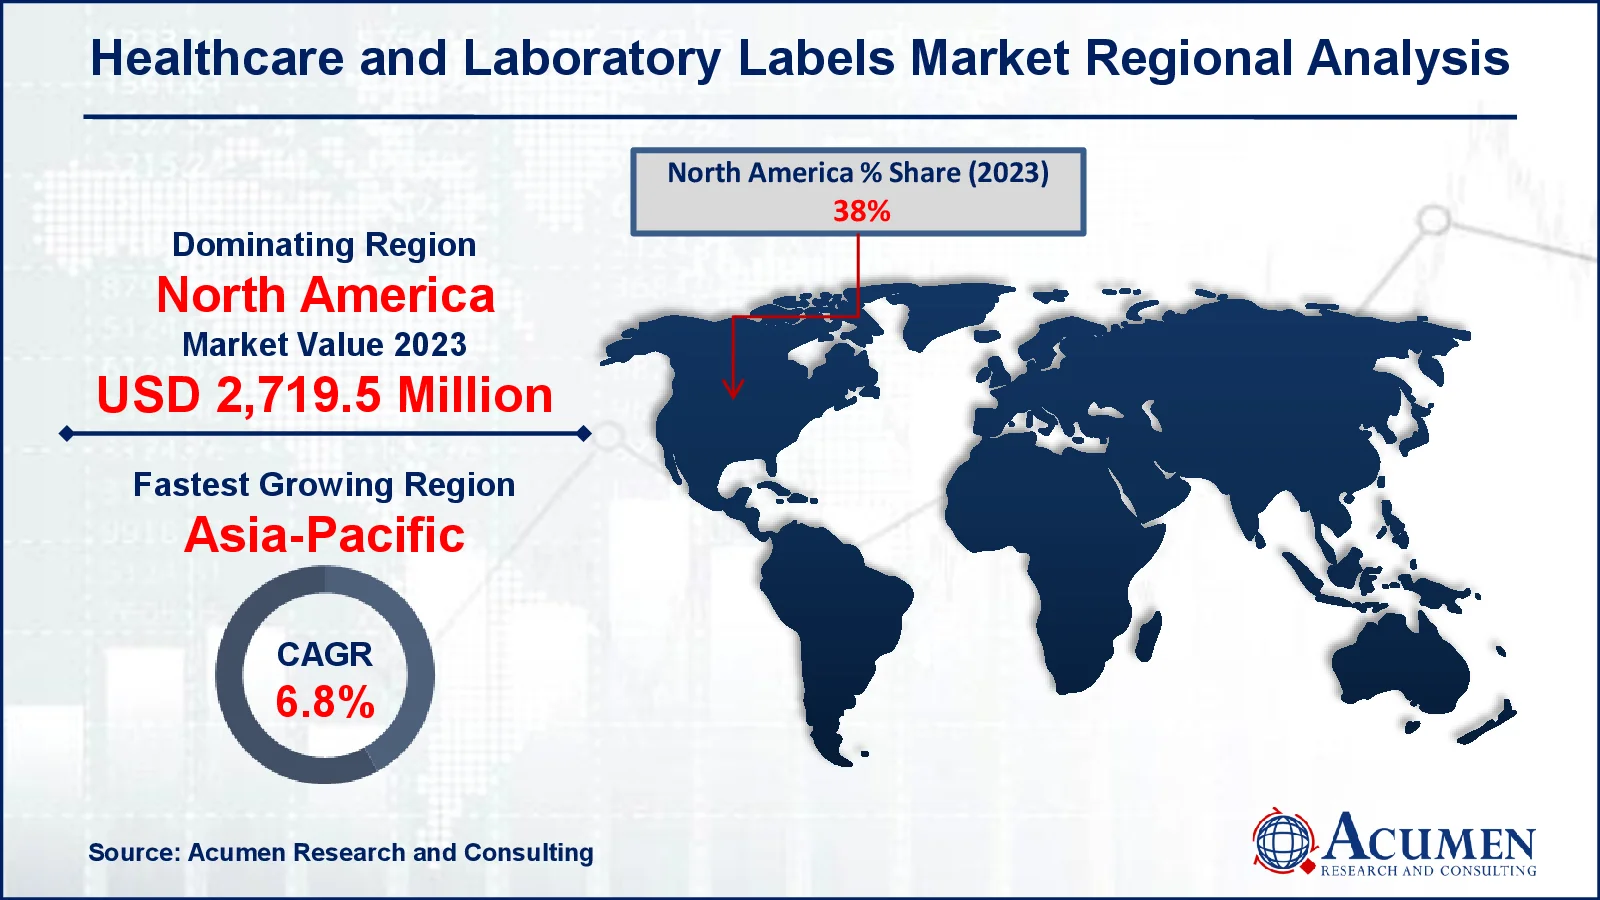
- North America healthcare and laboratory labels market value occupied around USD 2,719.5 million in 2023
- Asia-Pacific healthcare and laboratory labels market growth will record a CAGR of more than 6.8% from 2024 to 2032
- Among product type, the polyolefin sub-segment generated around 1,717.6 million revenue in 2023
- Based on application, the pharmaceutical & nutraceuticals sub-segment generated 49% healthcare and laboratory labels market share in 2023
- Expansion of pharmaceutical and biotechnology sectors driving demand for high-quality, durable labels is a popular healthcare and laboratory labels market
- trend that fuels the industry demand

Healthcare and laboratory labels are used by medical professionals to identify and track laboratory samples as well as for effective communication throughout a medical lab and facility. These can accurately identify patients, specimens, and blood units to improve patient safety, workflow efficiency, communication, and regulatory compliance. Additionally, these are used in cryogenic applications that require long-term storage conditions.
Healthcare and laboratory labels are essential for eliminating errors, ensuring compliance with industry standards, and speeding medical processes. These labels are designed to withstand a wide range of environmental conditions, including chemical, moisture, and extreme temperatures, making them appropriate for a variety of applications. They're widely utilized in hospitals, diagnostic clinics, blood banks, and research laboratories. Advanced labeling systems use both barcode and RFID technologies to improve automation, tracking, and data management. These labels also help to reduce the danger of misidentification, improve inventory management, and promote overall operational accuracy in healthcare and laboratory environments.
Global Healthcare and Laboratory Labels Market Dynamics
Market Drivers
- Growing demand for accurate patient identification to minimize medical errors and enhance safety
- Stringent regulatory requirements mandating proper labeling of medical and laboratory specimens
- Rising adoption of RFID and barcode labeling for improved tracking and inventory management
- Expansion of diagnostic and research laboratories increasing the need for efficient sample labeling solutions
Market Restraints
- High costs associated with advanced labeling technologies such as RFID and smart labels
- Stringent compliance regulations leading to complexities in label standardization and approval
- Risk of label damage due to extreme laboratory conditions like moisture, chemicals, and temperature fluctuations
Market Opportunities
- Integration of IoT-enabled smart labels to enhance real-time tracking and data management
- Growing adoption of eco-friendly and sustainable labeling materials in healthcare packaging
- Increasing demand for automation in hospitals and laboratories boosting the need for efficient labeling solutions
Healthcare and Laboratory Labels Market Report Coverage
|
Market |
Healthcare and Laboratory Labels Market |
|
Healthcare and Laboratory Labels Market Size 2023 |
USD 7,156.7 Million |
|
Healthcare and Laboratory Labels Market Forecast 2032 |
USD 11,923.5 Million |
|
Healthcare and Laboratory Labels Market CAGR During 2024 - 2032 |
5.9% |
|
Healthcare and Laboratory Labels Market Analysis Period |
2020 - 2032 |
|
Healthcare and Laboratory Labels Market Base Year |
2023 |
|
Healthcare and Laboratory Labels Market Forecast Data |
2024 - 2032 |
|
Segments Covered |
By Product Type, By Application, and By Geography |
|
Regional Scope |
North America, Europe, Asia Pacific, Latin America, and Middle East & Africa |
|
Key Companies Profiled |
3M, Weber, Schreiner, Diagramm Halbach, CCL Industries Corp., Brady Corp., Multi-Color, Avery Dennison Corp., UPM Raflatac, and Aenova. |
|
Report Coverage |
Market Trends, Drivers, Restraints, Competitive Analysis, Player Profiling, Covid-19 Analysis, Regulation Analysis |
Healthcare and Laboratory Labels Market Insights
The increasing research activities across the healthcare sector are primarily driving the market growth. The increasing demand for labeling along with the increasing demand for pharmaceutical products is supporting market growth. Ongoing developments in labeling technologies are further propelling market growth. Whereas, the development of new drugs and formulations owing to the rising need for advanced pharmaceutical products and improved healthcare services is anticipated to create potential demand over the estimated period from 2024 to 2032. On the other hand, changing end-user requirements associated with the medical device or pharmaceutical labels, material, dimension, and printing is projected to restrict the growth.
Pharmaceutical Label Projected To Register Maximum Share Over The Estimated Period
The pharmaceutical label segment is projected to account for the major share in the global market over the estimated period from 2024 to 2032. The pharmaceutical label refers to all the printed information over the medicine or prescription drug. These are strictly regulated by the FDA and provide lots of useful information associated with the company's products. Legislative requirements, multilingual demands, and brand security are the important factors taken into consideration while designing or printing a pharmaceutical label. In the case of pharmaceutical labels, end users are more concerned with straight facts and information, as well as adherence to regulations instead of graphics that pop. The increasing number of launched products, specialty medicines sector, and competition among manufacturers is accelerating the pharmaceutical label growth.
Healthcare and Laboratory Labels Market Segmentation
The worldwide market for healthcare and laboratory labels is split based on product type, application, and geography.
Healthcare & Laboratory Labels Market By Product Type
- Polyester
- Nylon
- Polyolefin
- Paper
- Vinyl
- Others
According to healthcare and laboratory labels industry analysis, paper labels made gathered utmost market share of 24% in 2023. Their dominance stems from their wide availability together with cost-effective properties and application versatility. The paper segment led the market revenue segment in this sector during 2023. During the forecast period paper labels will continue to dominate the market as they will capture about two-thirds of the market value share worldwide.
Polyolefin is one of the significant segment, accounting for USD 1,646.1 million in revenue. This supremacy stems mostly from its remarkable durability, chemical resistance, and flexibility, which make it suitable for labeling in medical and laboratory settings. Unlike paper labels, polyolefin labels can endure moisture, severe temperatures, and chemical exposure, preserving the accuracy of crucial information on medical samples, pharmaceutical packaging, and laboratory specimens.
Polyolefin labels are also lightweight and environmentally beneficial because they can be recycled more easily than vinyl or polyester labels. Their superior adhesive capabilities enable them to remain attached to curved or flexible surfaces, making them ideal for use in vials, test tubes, and medical containers. Polyolefin labels are a dependable solution for inventory tracking and patient safety, especially as RFID and barcode technologies become more prevalent. As healthcare facilities and research laboratories prioritize high-performance labeling solutions, the need for polyolefin-based labels is predicted to increase gradually.
Healthcare & Laboratory Labels Market By Application
- Pharmaceutical & Nutraceuticals
- Medical Devices
- Hospital Services
- Blood Bank
- Laboratory Labels
The pharmaceutical and nutraceuticals segment dominates the healthcare and laboratory labels market, accounting for nearly USD 3,506.8 million in revenue in 2023. The increased emphasis on precise medicine labeling, regulatory compliance, and patient safety has driven up demand for high-quality labels in this industry.
Pharmaceutical companies must adhere to stringent labeling rules established by organizations such as the FDA and EMA in order to provide accurate dosing instructions, component data, and tracking information. Furthermore, the growing manufacturing of prescription drugs, over-the-counter treatments, and dietary supplements has increased the demand for efficient labeling systems that support barcoding, serialization, and RFID tracking.
Furthermore, as more people become aware of nutraceutical items such as vitamins and dietary supplements, there is a greater demand for labels that are simple, informative, and visually appealing. As the pharmaceutical and nutraceutical industries expand globally, the demand for reliable, regulatory-compliant labeling solutions is projected to maintain the segment's market dominance.
Healthcare and Laboratory Labels Market Regional Outlook
North America
- U.S.
- Canada
Europe
- U.K.
- Germany
- France
- Spain
- Rest of Europe
Asia-Pacific
- India
- Japan
- China
- Australia
- South Korea
- Rest of Asia-Pacific
Latin America
- Brazil
- Mexico
- Rest of LATAM
The Middle East & Africa
- South Africa
- GCC Countries
- Rest of the Middle East & Africa (ME&A)

Healthcare and Laboratory Labels Market Regional Analysis
In terms of healthcare and laboratory labels market analysis, in 2023, North America accounted for the major share in the market owing to the well-established healthcare industry in the regional market. The region is also projected to maintain its dominance over the estimated period. The well-established healthcare infrastructure and high investment in research and development activities in the regional market is supporting the regional market value. Apart from this, Asia Pacific is projected to exhibit the fastest growth over the healthcare and laboratory labels market forecast period from 2024 to 2032. The growing healthcare sector coupled with the increasing focus of global manufacturers in the regional market is further supporting the market value.
Healthcare and Laboratory Labels Market Players
Some of the top healthcare and laboratory labels companies offered in our report include 3M, Weber, Schreiner, Diagramm Halbach, CCL Industries Corp., Brady Corp., Multi-Color, Avery Dennison Corp., UPM Raflatac, and Aenova.
Frequently Asked Questions
How big is the healthcare and laboratory labels market?
The healthcare and laboratory labels market size was valued at USD 7,156.7 Million in 2023.
What is the CAGR of the global healthcare and laboratory labels market from 2024 to 2032?
The CAGR of healthcare and laboratory labels is 5.9% during the analysis period of 2024 to 2032.
Which are the key players in the healthcare and laboratory labels market?
The key players operating in the global market are including 3M, Weber, Schreiner, Diagramm Halbach, CCL Industries Corp., Brady Corp., Multi-Color, Avery Dennison Corp., UPM Raflatac, and Aenova.
Which region dominated the global healthcare and laboratory labels market share?
North America held the dominating position in healthcare and laboratory labels industry during the analysis period of 2024 to 2032.
Which region registered fastest CAGR from 2024 to 2032?
Asia-Pacific region exhibited fastest growing CAGR for market of healthcare and laboratory labels during the analysis period of 2024 to 2032.
What are the current trends and dynamics in the global healthcare and laboratory labels industry?
The current trends and dynamics in the healthcare and laboratory labels industry include growing demand for accurate patient identification to minimize medical errors and enhance safety, stringent regulatory requirements mandating proper labeling of medical and laboratory specimens, and Rising adoption of RFID and barcode labeling for improved tracking and inventory management.
Which application held the maximum share in 2023?
The pharmaceutical & nutraceuticals application held the maximum share of the healthcare and laboratory labels industry.


