Green Tea Market Size - Global Industry, Share, Analysis, Trends and Forecast 2023 - 2032
Published :
Report ID:
Pages :
Format :
Green Tea Market Size - Global Industry, Share, Analysis, Trends and Forecast 2023 - 2032
Report Coverage
- Industry Dynamics
- Market Size and Forecast Data
- Segment Analysis
- Competitive Landscape
- Regional Analysis with a Niche Focus on Country-Level Data
- High Level Analysis - Porter's, PESTEL, Value Chain, etc.
- Company Profiles of Key Players
- Option to Customize the Report As Per Your Specific Need
Request Sample Report
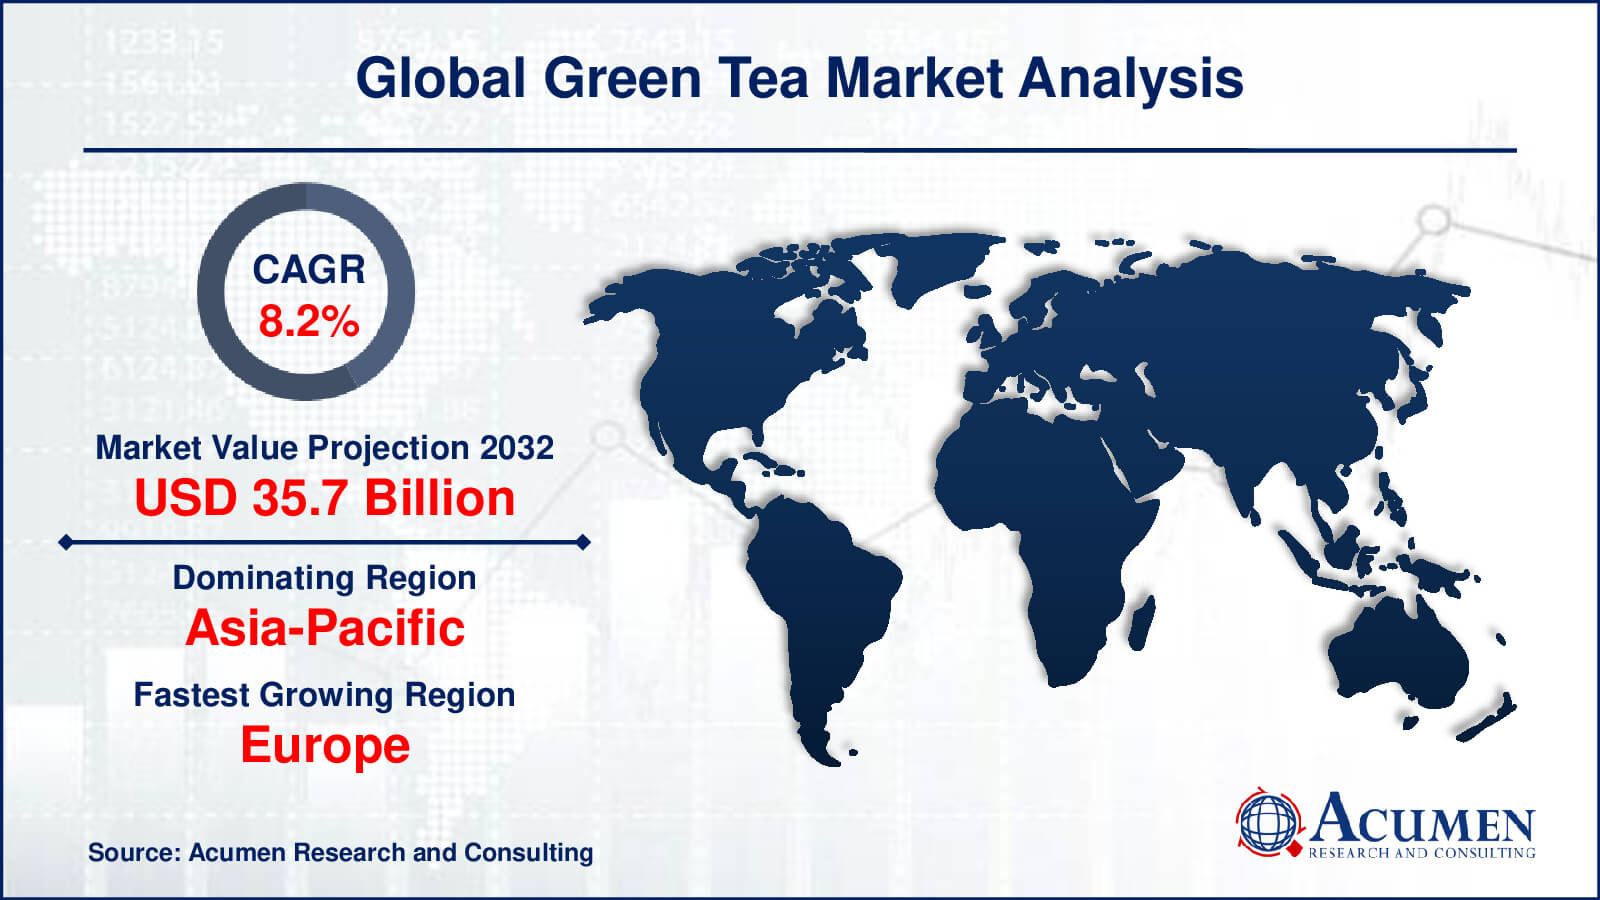
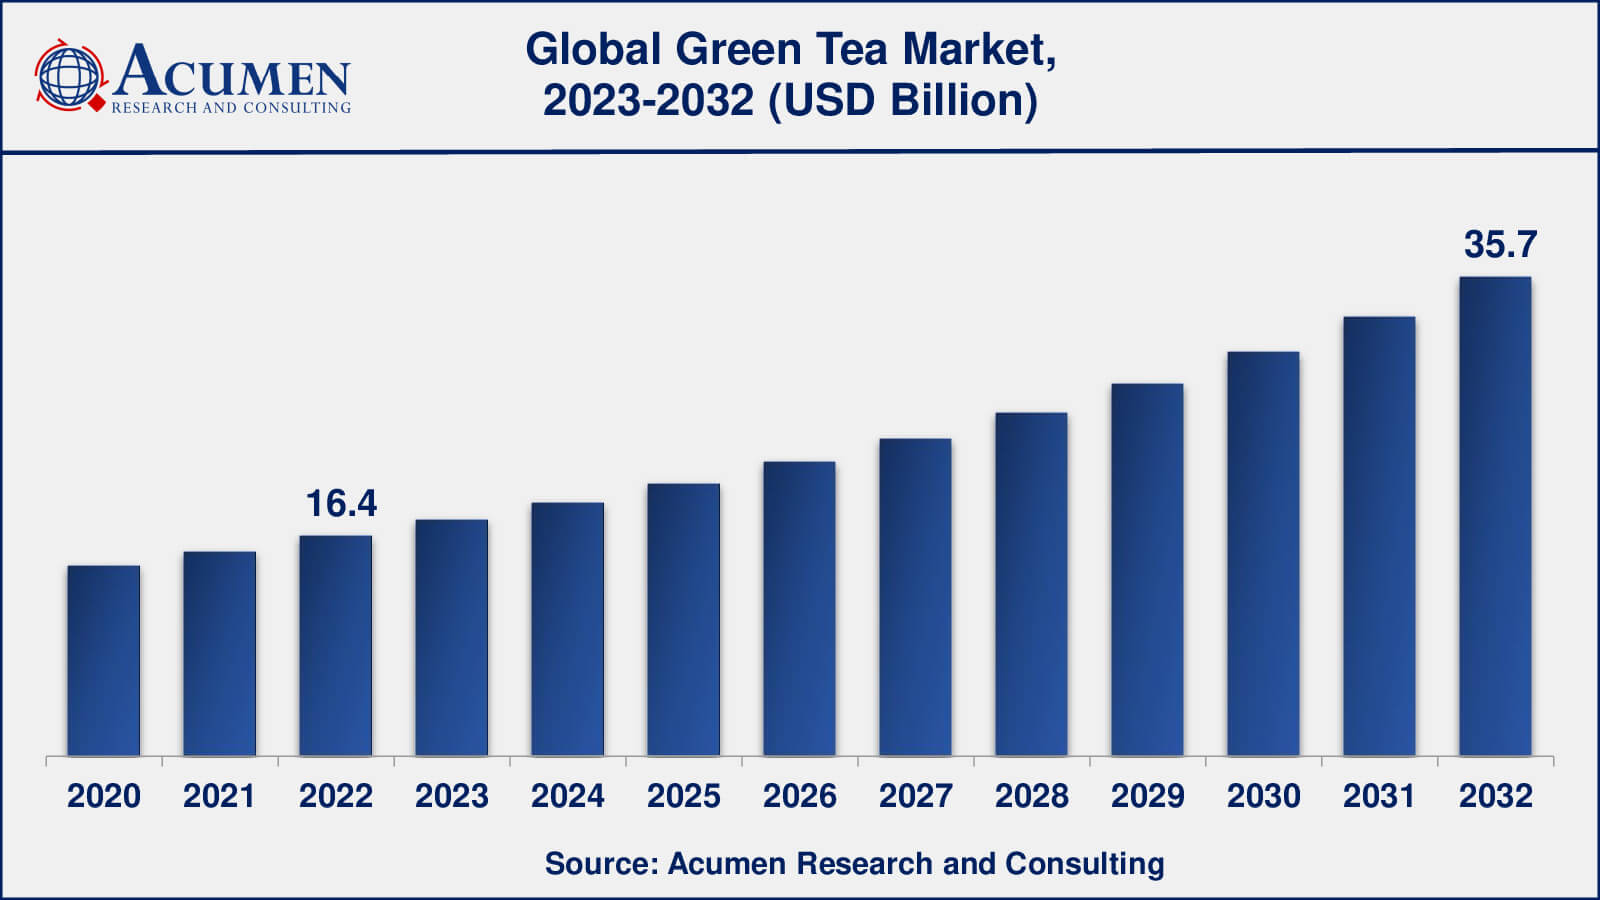
The Global Green Tea Market Size collected USD 16.4 Billion in 2022 and is set to achieve a market size of USD 35.7 Billion in 2032 growing at a CAGR of 8.2% from 2023 to 2032.
Green Tea Market Statistics
- Global green tea market revenue is estimated to reach USD 35.7 billion by 2032 with a CAGR of 8.2% from 2023 to 2032
- Asia-Pacific green tea market value occupied more than USD 100.4 billion in 2022
- Europe green tea market growth will register a CAGR of around 7% from 2023 to 2032
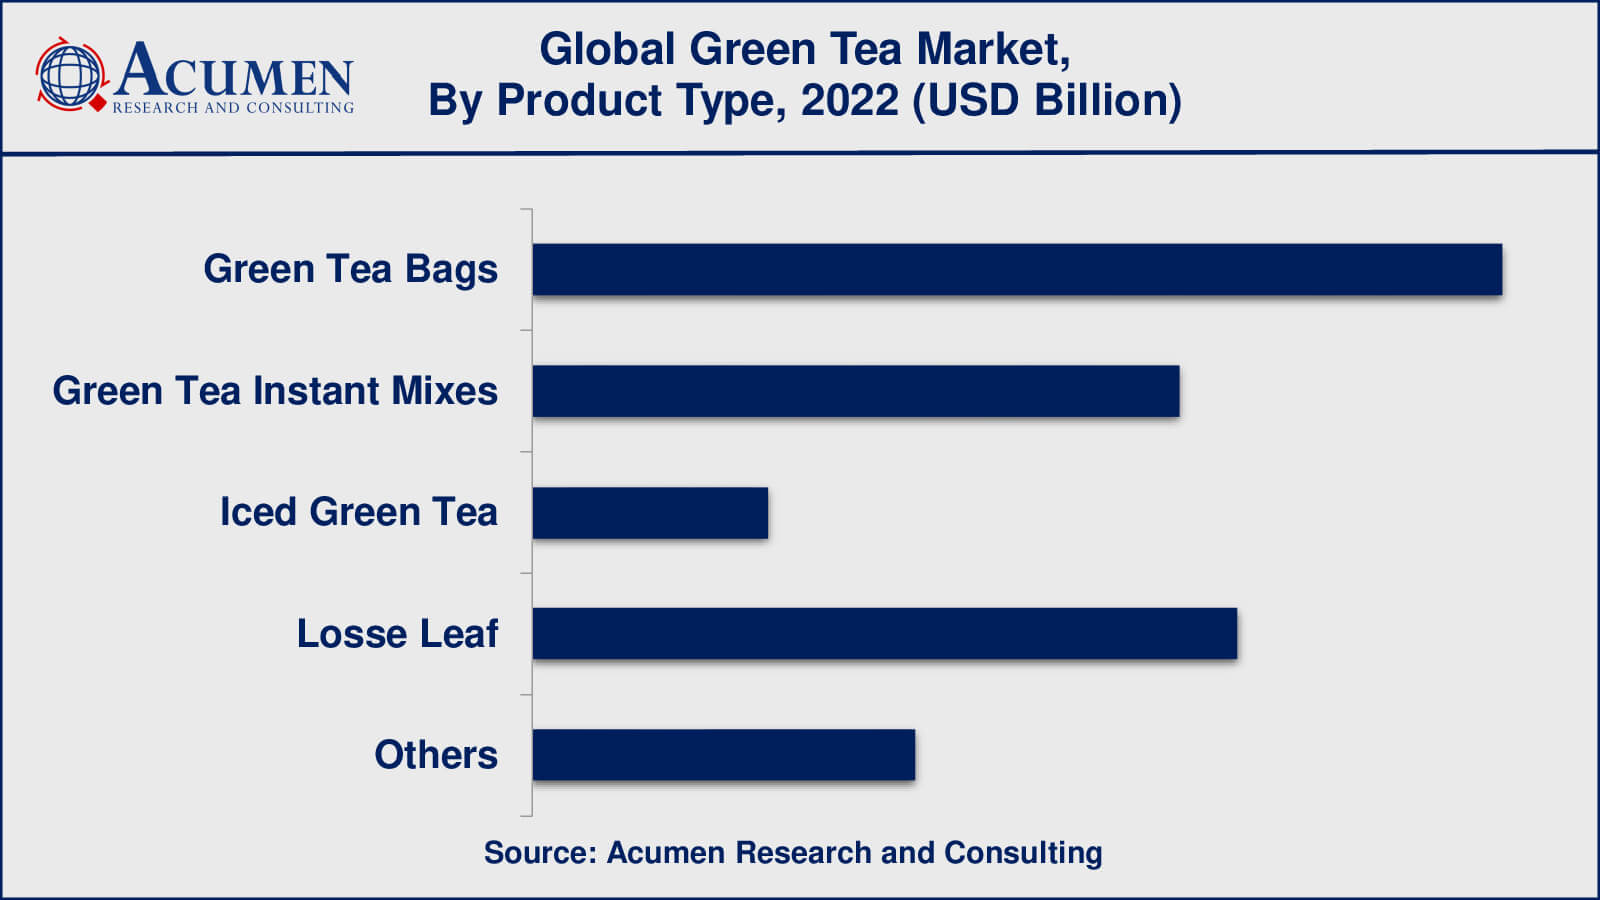
- Among product type, the green tea bags sub-segment generated over US$ 5.4 billion revenue in 2022
- Based on flavor, the lemon sub-segment generated around 30% share in 2022
- Innovation in flavors and packaging is a popular green tea market trend that fuels the industry demand

Green tea is a specific kind of unfermented leaf that does not undergo the process of oxidation and is then dried. The green tea market segment is growing at the fastest rate owing to the health benefits associated with it. Rising consumer awareness regarding the usage of safety products has been the major driver contributing to the growth of the green tea market globally. The growing number of obese patients suffering from severe weight loss problems has been another major reason pushing the demand for green tea and in turn, helping the green tea market to grow globally.

Global Green Tea Market Dynamics
Market Drivers
- Increasing consumer awareness
- Rising health benefits
- Growing popularity of ready-to-drink beverages
Market Restraints
- Availability of alternatives
- Regulatory hurdles
Market Opportunities
- Flavor innovation
- Growth organic and natural flavors
Green Tea Market Report Coverage
| Market | Green Tea Market |
| Green Tea Market Size 2022 | USD 16.4 Billion |
| Green Tea Market Forecast 2032 | USD 35.7 Billion |
| Green Tea Market CAGR During 2023 - 2032 | 8.2% |
| Green Tea Market Analysis Period | 2020 - 2032 |
| Green Tea Market Base Year | 2022 |
| Green Tea Market Forecast Data | 2023 - 2032 |
| Segments Covered | By Product Type, By Flavor, And By Geography |
| Regional Scope | North America, Europe, Asia Pacific, Latin America, and Middle East & Africa |
| Key Companies Profiled | AMORE Pacific Corp, Arizona Beverage Company, Associated British Foods LLC, Cape Natural Tea Products, Celestial Seasonings, Finlays Beverages Ltd., Frontier Natural Products Co-Op., Hambleden Herbs, Hankook Tea, Honest Tea, Inc., ITO EN, Metropolitan Tea Company, Nestle S.A., Oishi Group Plc., Tata Global Beverages, The Coca-Cola Company, and Unilever. |
| Report Coverage |
Market Trends, Drivers, Restraints, Competitive Analysis, Player Profiling, Covid-19 Analysis, Regulation Analysis |
Green Tea Market Growth Factors
Green tea is well known for its healing and cleansing properties which have resulted in its application for curing severe diseases like cancer. It is believed that green tea helps in reducing the ill effects of cancerous cells. Other than this, green tea also helps in the reduction of cholesterol and fat in the body. It has bioactive compounds, antioxidants, and nutrients present which also helps in reducing skin-related problems. This has further increased the demand for green tea and is expected to grow in the future as well owing to the rising demand from image-conscious societies further helping in the growth of the global green tea market. Even though there are huge health benefits to the consumption of green tea, there are also certain side effects associated with it. The side effects may range from nervousness, sleep problems, vomiting, dizziness, and convulsions among others. This is analyzed to have a negative impact on the growth in demand for green tea. An increasing number of health-conscious people is expected to provide huge growth opportunities in the green tea market globally.

Green Tea Market Segmentation
The worldwide market for green tea is categorized based on product type, flavor, and geography.
Green Tea Industry Product Type Outlook
- Green Tea Bags
- Green Tea Instant Mixes
- Iced Green Tea
- Losse Leaf
- Others

Green tea bags are a popular product type for green tea, according to an industry analysis, because they are convenient, easy to use, and widely available in supermarkets and convenience stores. Individual sachets or tea bags made of paper or other biodegradable materials are commonly used in the packaging of green tea bags.
Green tea instant mixes are a popular product type among consumers who want a quick and easy way to make tea. Green tea instant mixes are typically packaged in sachets or canisters made of plastic or other materials.
Iced green tea is a popular product type among customers looking for a refreshing and healthy beverage. Plastic bottles or cans that are recyclable or made of biodegradable materials are commonly used in the packaging of iced green tea.
Green Tea Industry Flavor Outlook
- Basil
- Lemon
- Jasmine
- Aloe Vera
- Vanilla
- Wild Berry
- Cinnamon
- Others
As per the green tea market forecast, the lemon flavor sub-segment is expected to account for utmost market share from 2023 to 2032. Lemon is popular green tea flavoring, especially in iced green tea and instant green tea mixes. Lemon is frequently used as a natural flavoring agent in green tea, and it is also thought to enhance the health benefits of green tea. Individual tea bags or sachets, plastic bottles or cans for iced tea, and sachets or canisters for instant tea mixes are the most common product types for lemon-flavored green tea.
Jasmine is another popular flavoring for green tea and herbal teas in general, and it can be found in both loose leaf and tea bag form. Although basil, aloe vera, and cinnamon are not commonly used as flavoring agents in green tea, they may be used in other beverages or foods. Vanilla and wild berry are also used in some green tea blends, particularly those that are flavored or scented.
Green Tea Market Regional Outlook
North America
- U.S.
- Canada
Europe
- U.K.
- Germany
- France
- Spain
- Rest of Europe
Asia-Pacific
- India
- Japan
- China
- Australia
- South Korea
- Rest of Asia-Pacific
Latin America
- Brazil
- Mexico
- Rest of Latin America
The Middle East & Africa
- South Africa
- GCC Countries
- Rest of the Middle East & Africa (ME&A)

Green Tea Market Regional Analysis
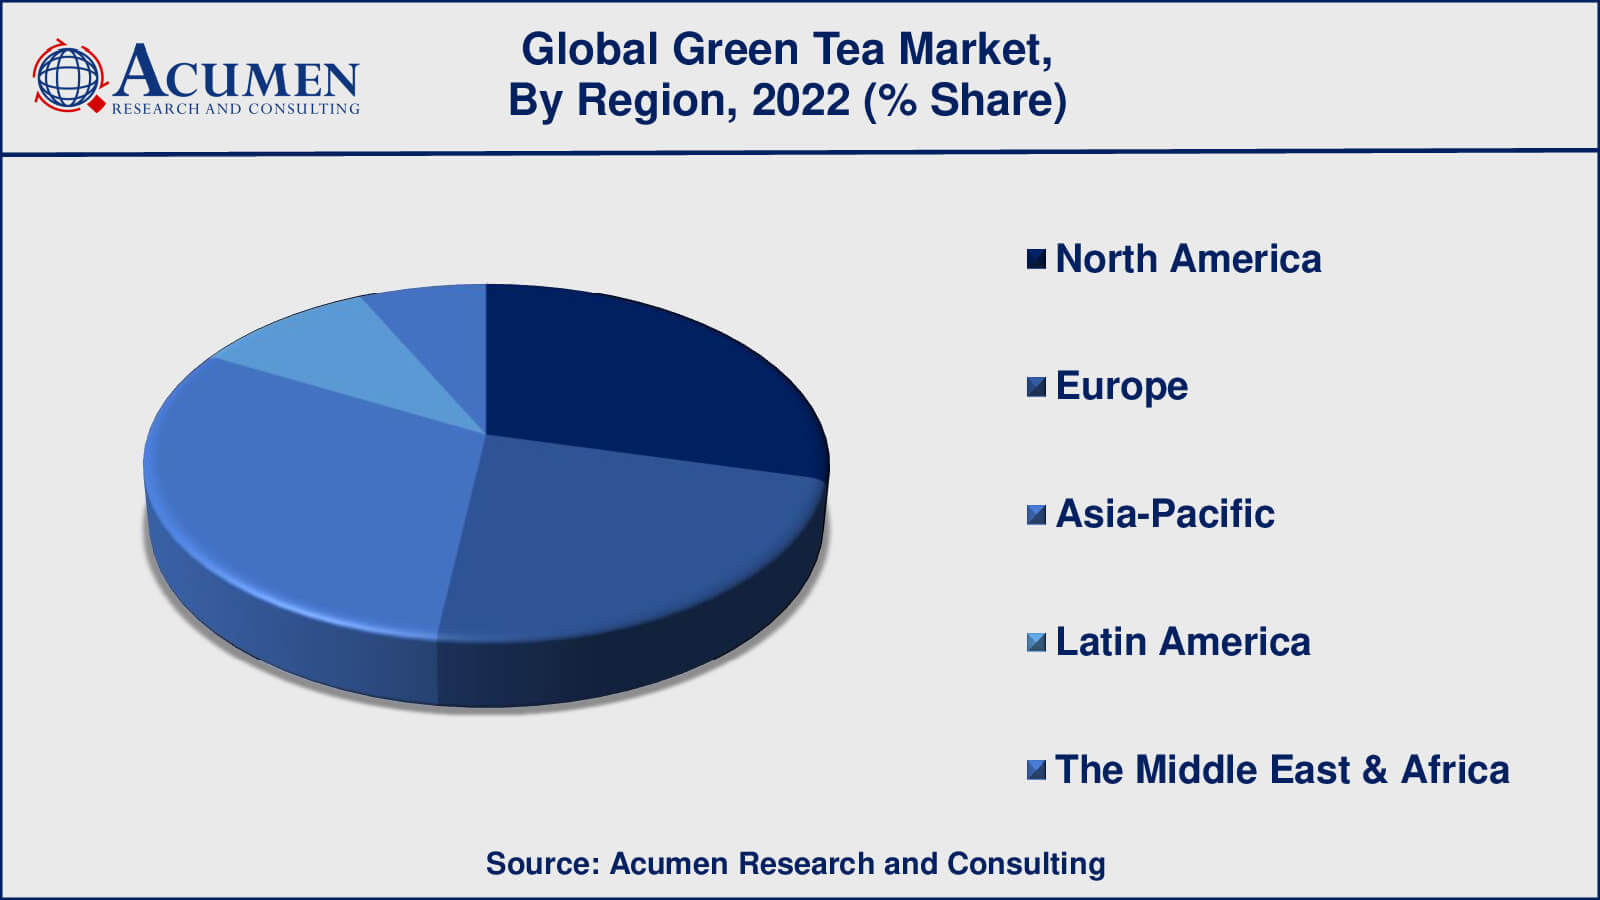
The Asia-Pacific region is the largest green tea market, accounting for the majority of global market share. This is primarily due to green tea's cultural and historical significance in countries such as China, Japan, and India. These nations are also significant producers and exporters of green tea.
North America and Europe are also important green tea markets, owing to rising consumer awareness of green tea's health benefits and rising demand for natural and organic beverages. Green tea demand is expected to increase in these regions due to the growing popularity of ready-to-drink green tea beverages.
Latin America, the Middle East, and Africa are relatively smaller green tea markets, but they are anticipated to grow in the coming years due to increasing urbanization, rising disposable incomes, and growing awareness of green tea's health benefits.
Green Tea Market Players
Some of the green tea companies include AMORE Pacific Corp, Arizona Beverage Company, Associated British Foods LLC, Cape Natural Tea Products, Celestial Seasonings, Finlays Beverages Ltd., Frontier Natural Products Co-Op., Hambleden Herbs, Hankook Tea, Honest Tea, Inc., ITO EN, Metropolitan Tea Company, Nestle S.A., Oishi Group Plc., Tata Global Beverages, The Coca-Cola Company, and Unilever.
Frequently Asked Questions
What was the market size of the global green tea in 2022?
The market size of green tea was USD 16.4 Billion in 2022.
What is the CAGR of the global green tea market from 2023 to 2032?
The CAGR of green tea is 8.2% during the analysis period of 2023 to 2032.
Which are the key players in the green tea market?
The key players operating in the global market are including AMORE Pacific Corp, Arizona Beverage Company, Associated British Foods LLC, Cape Natural Tea Products, Celestial Seasonings, Finlays Beverages Ltd., Frontier Natural Products Co-Op., Hambleden Herbs, Hankook Tea, Honest Tea, Inc., ITO EN, Metropolitan Tea Company, Nestle S.A., Oishi Group Plc., Tata Global Beverages, The Coca-Cola Company, and Unilever.
Which region dominated the global green tea market share?
Asia-Pacific held the dominating position in green tea industry during the analysis period of 2023 to 2032.
Which region registered fastest CAGR from 2023 to 2032?
Europe region exhibited fastest growing CAGR for market of green tea during the analysis period of 2023 to 2032.
What are the current trends and dynamics in the global green tea industry?
The current trends and dynamics in the green tea industry include increasing consumer awareness, rising health benefits, and growing popularity of ready-to-drink beverages
Which product type held the maximum share in 2022?
The green tea bags type held the maximum share of the green tea industry.


