Green Construction Market Size (By Product: Interior Products, Exterior Products, Solar Products, Buildings Systems, and Others; By Application: Residential Buildings, Non-Residential Buildings, and Others) � Global Industry Analysis, Market Size, Opportunities and Forecast 2022 � 2030
Published :
Report ID:
Pages :
Format :
Green Construction Market Size (By Product: Interior Products, Exterior Products, Solar Products, Buildings Systems, and Others; By Application: Residential Buildings, Non-Residential Buildings, and Others) � Global Industry Analysis, Market Size, Opportunities and Forecast 2022 � 2030
Report Coverage
- Industry Dynamics
- Market Size and Forecast Data
- Segment Analysis
- Competitive Landscape
- Regional Analysis with a Niche Focus on Country-Level Data
- High Level Analysis - Porter's, PESTEL, Value Chain, etc.
- Company Profiles of Key Players
- Option to Customize the Report As Per Your Specific Need
Request Sample Report
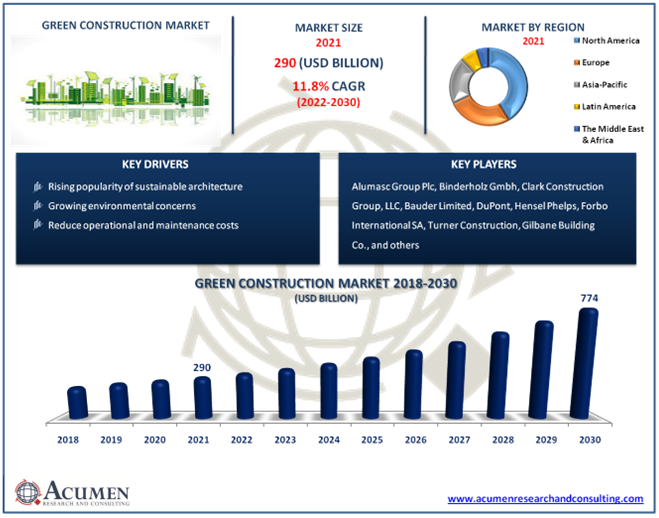
The global green construction market size accounted for US$ 290 Bn in 2021 and is estimated to reach US$ 774 Bn by 2030, with a significant CAGR of 11.8% from 2022 to 2030.
The term "green construction," also known as "sustainable design," refers to a construction method that focuses on boosting the structure's overall efficiency. It is the process of improving the efficiency with which buildings and their sites use water, energy, and materials, as well as lowering the impact on human health and the environment over the course of a building's full lifecycle. Green construction concepts expand beyond the walls of buildings to incorporate topics such as site planning, community development, and land-use planning. Green construction approaches strive to lessen a building's environmental impact. The majority of green construction materials, such as wood, recycled metal, fiberglass, and mineral wool, are renewable and non-toxic. Moreover, this concept contributes to environmental protection and improves our quality of life.
Market Growth Drivers
- The rising popularity of sustainable architecture
- Growing environmental concerns
- Reduced operational and maintenance cost
- Growing smart and efficient infrastructure projects
Market Restraint
- High production cost of green construction
- Limited availability of eco-friendly material required for green construction
Market Opportunities
- Increased commercial and industrial expenditure
- Stringent governmental regulations
Report Coverage:
| Market | Green Construction Market |
| Market Size 2021 | US$ 290 Bn |
| Market Forecast 2028 | US$ 774 Bn |
| CAGR | 11.8% During 2022 - 2030 |
| Analysis Period | 2018 - 2030 |
| Base Year | 2021 |
| Forecast Data | 2022 - 2030 |
| Segments Covered | By Product, By Application, And By Geography |
| Regional Scope | North America, Europe, Asia Pacific, Latin America, and Middle East & Africa |
| Key Companies Profiled | Binderholz Gmbh, Clark Construction Group, LLC, Alumasc Group Plc, Bauder Limited, Gilbane Building Co., Certain Teed Corporation, DuPont, Hensel Phelps, Forbo International SA, Turner Construction, and The Whiting-Turner Contracting Company. |
| Report Coverage |
Market Trends, Drivers, Restraints, Competitive Analysis, Player Profiling, Regulation Analysis |
| Customization Scope |
10 hrs of free customization and expert consultation |
COVID-19 Impact on the Green Construction Industry
The COVID-19 pandemic and subsequent interruptions have harmed the green construction market projection. Major development and infrastructure projects were halted as most countries were compelled to go into lockdown. Supply chain concerns, production stoppages, and staff shortages caused by government anti-coronavirus actions have generated significant challenges for the business. These interruptions, however, are projected to be temporary, and the market is predicted to rebound at a steady rate in the coming years.
Market Dynamics
The rising popularity of sustainable architecture is one of the significant trends in the global green construction market. The construction of green buildings has led to many environmental benefits around the world. Some of the benefits are reduction of natural resources consumption, energy optimization and reduction of energy consumption, and increased productivity of the occupants. Owing to these benefits governments of different countries are emphasizing green building infrastructure. For example, they are enacting legislation requiring developers and contractors to employ environmentally friendly materials and solutions in their construction projects. This has been expanding the green construction market revenue.
Water efficiency is another tangible benefit of green construction. According to research, green architecture can minimize not only water waste through water-efficient plumbing fixtures but also the strain on shared water resources. Residents of green buildings enjoy a plethora of health benefits because of the eco-friendly material used in construction. This factor is also expected to boost the demand for the industry. Some other factors that are also driving the market demand are extreme weather conditions, recurring climate fluctuations, and consumer preference for green roof equipment to maintain the temperature within the infrastructure.
Furthermore, the rising strict government regulations toward green building technology are expected to generate numerous growth opportunities for the market in the coming years. As a result, architects are developing innovative sustainable design approaches that could protect the ecosystem while lowering carbon footprint, from home constructions to corporate facilities.
Green Construction Market Segmentation
The global green construction market is segmented based on product, application, and region.
Market By Product
- Interior Products
- Insulation
- Floorings
- Exterior Products
- Windows
- Roofing
- Siding
- Doors
- Building Systems
- Solar Products
- Others
Based on our analysis, the interior products segment is expected to attian a substantial growth rate during the projected years 2022 – 2030. The green building's interior spaces have natural lighting and views of the outdoors, while high-efficiency HVAC (heating, ventilation, and airconditioning) devices and low-VOC (volatile organic compound) materials such as paint, flooring, and furniture provide better indoor air quality. On the other, hand the exterior products segment achieved the maximum green construction market share in 2021.
Market By Application
- Residential Buildings
- Non-Residential Buildings
- Commercial & Office
- Industrial
- Institutional
- Hospitality & Leisure
- Others
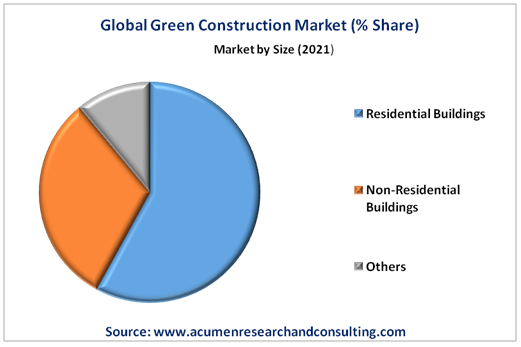
 Among them, the residential buildings segment gathered a significant amount of green construction market share in 2021. The key reason driving segmental expansion is increased demand for residential buildings as the world's population grows. Furthermore, the use of green building materials in residential structures improves architectural features as well as air quality for residents. This factor shows the signs of massive growth in this sector. However, the non-residential sector is likely to attain the fastest growth rate during the forecast period due to the low operating and maintenance cost incurred by green construction.
Green Construction Market Regional Overview
North America
- U.S.
- Canada
Europe
- U.K.
- Germany
- France
- Spain
- Rest of Europe
Latin America
- Mexico
- Brazil
- Rest of Latin America
Asia-Pacific
- India
- Japan
- China
- Australia
- South Korea
- Rest of Asia-Pacific
Middle East & Africa (MEA)
- Gulf Cooperation Council (GCC)
- South Africa
- Rest of the Middle East & Africa
The presence of key environmental protection organizations in North America fuels the regional market growth
According to regional segmentation, the North America region generated supreme revenue in 2021. The region's prominent market share is attributable to increased demand for residential homes and renovation projects. Furthermore, regulatory guidelines and building codes that encourage the usage of these products in building restoration and construction are expected to propel the North America green construction market forward throughout the projected period. Meanwhile, the Asia-Pacific region is anticipated to attain the fastest growth rate throughout the forecast period 2022 – 2030. The growing industrial sector, stringent environmental regulations, rapid urbanization in emerging markets like China and India, rising industrial pollution, increasing government worries and measures toward clean energy promotion, and expanding population are some of the key aspects supporting regional growth.
Competitive Landscape
Some of the green construction companies offered in the professional report include Binderholz Gmbh, Clark Construction Group, LLC, Alumasc Group Plc, Bauder Limited, Gilbane Building Co., Certain Teed Corporation, DuPont, Hensel Phelps, Forbo International SA, Turner Construction, and The Whiting-Turner Contracting Company.
Frequently Asked Questions
How much was the estimated value of the global green construction market in 2021?
The estimated value of global green construction market in 2021 was accounted to be US$ 290 Bn.
What will be the projected CAGR for global green construction market during forecast period of 2022 to 2030?
The projected CAGR of green construction market during the analysis period of 2022 to 2030 is 11.8%.
Which are the prominent competitors operating in the market?
The prominent players of the global green construction market involve Binderholz Gmbh, Clark Construction Group, LLC, Alumasc Group Plc, Bauder Limited, Gilbane Building Co., Certain Teed Corporation, DuPont, Hensel Phelps, Forbo International SA, Turner Construction, and The Whiting-Turner Contracting Company.
Which region held the dominating position in the global green construction market?
North America held the dominating share for green construction during the analysis period of 2022 to 2030.
Which region exhibited the fastest growing CAGR for the forecast period of 2022 to 2030?
Asia-Pacific region exhibited fastest growing CAGR for green construction during the analysis period of 2022 to 2030.
What are the current trends and dynamics in the global green construction market?
The rising popularity of sustainable architecture, growing environmental concerns, and reduced operational and maintenance cost drives the growth of global green construction market.
By segment product, which sub-segment held the maximum share?
Based on product, exterior products segment held the maximum share for green construction market in 2021.


