Green Chemicals and Materials Market Size - Global Industry, Share, Analysis, Trends and Forecast 2023 - 2032
Published :
Report ID:
Pages :
Format :
Green Chemicals and Materials Market Size - Global Industry, Share, Analysis, Trends and Forecast 2023 - 2032
Report Coverage
- Industry Dynamics
- Market Size and Forecast Data
- Segment Analysis
- Competitive Landscape
- Regional Analysis with a Niche Focus on Country-Level Data
- High Level Analysis - Porter's, PESTEL, Value Chain, etc.
- Company Profiles of Key Players
- Option to Customize the Report As Per Your Specific Need
Request Sample Report
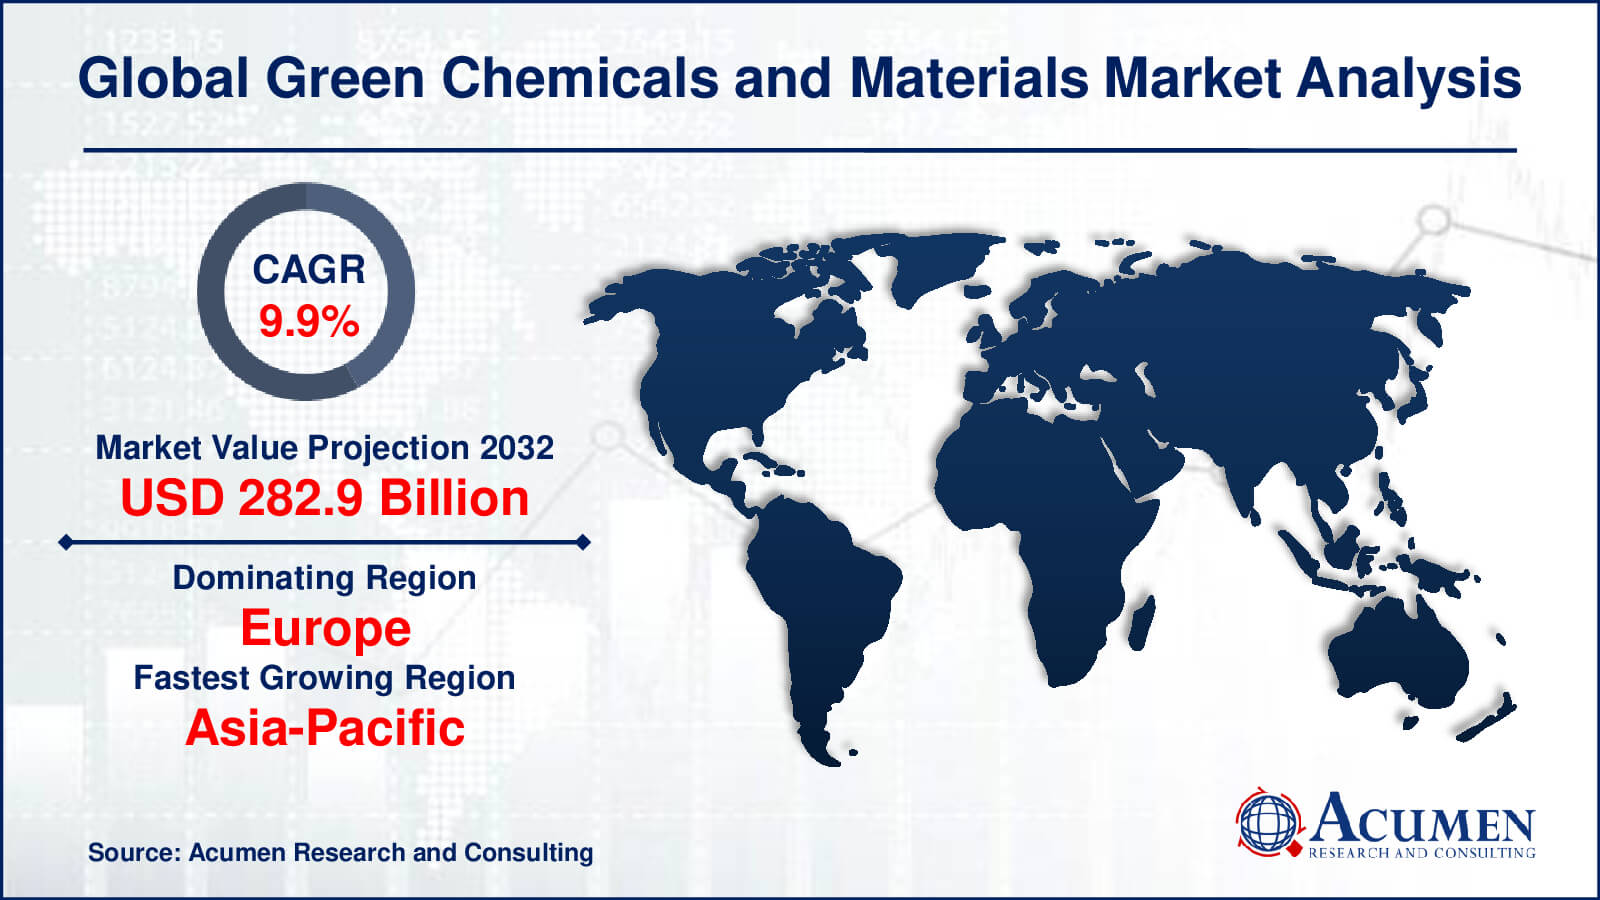
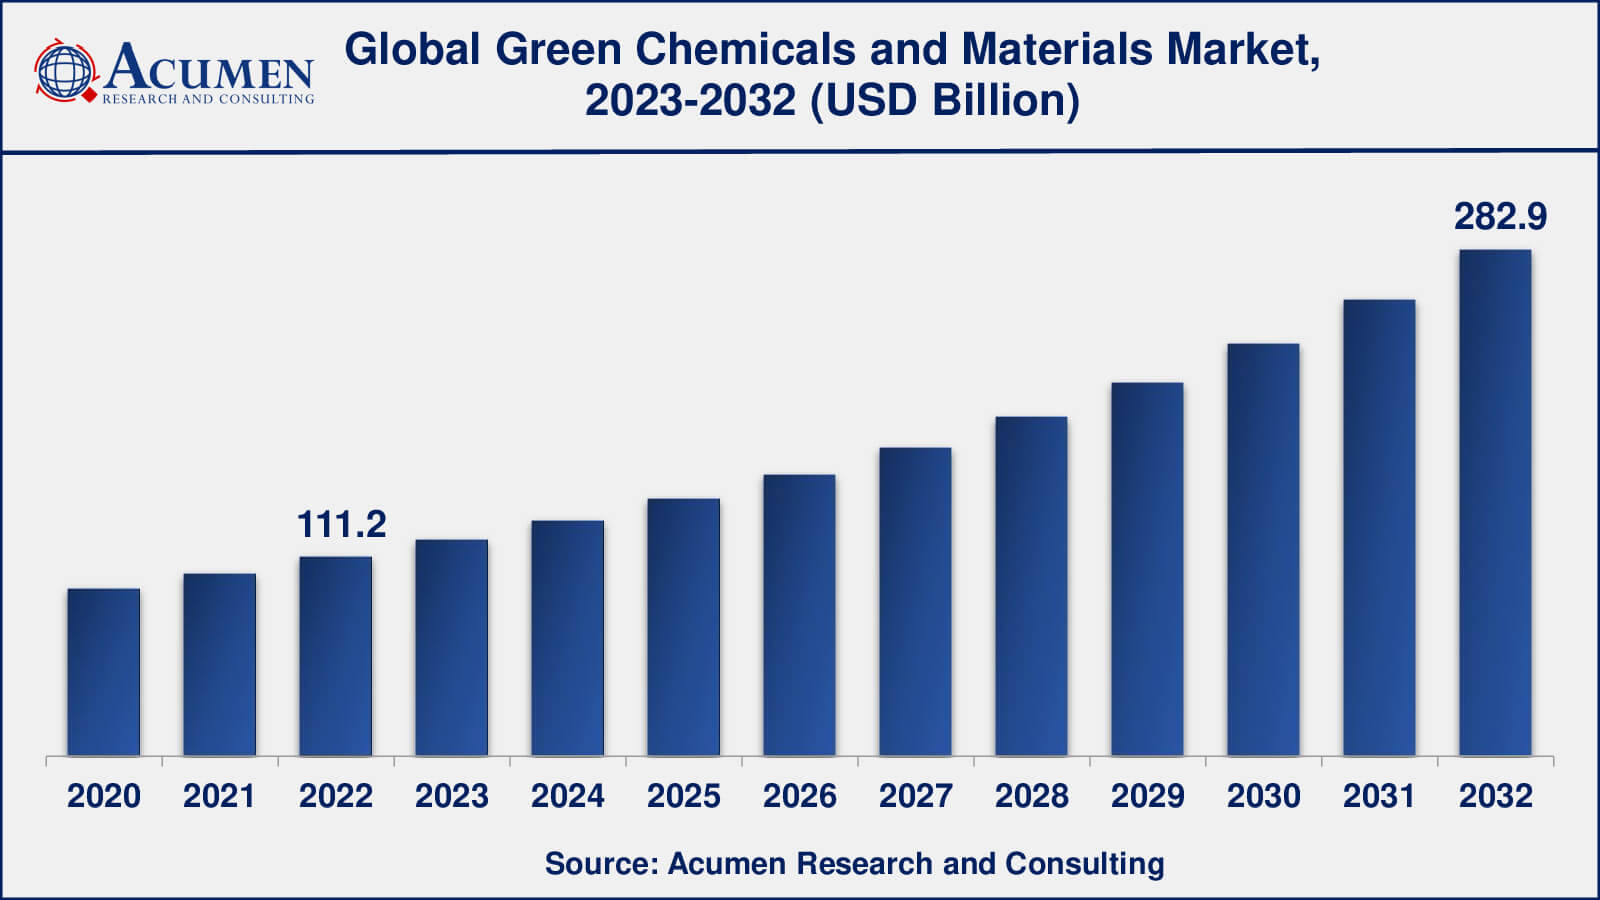
The Global Green Chemicals and Materials Market Size collected USD 111.2 Billion in 2022 and is set to achieve a market size of USD 282.9 Billion in 2032 growing at a CAGR of 9.9% from 2023 to 2032.
Green Chemicals and Materials Market Statistics
- Global green chemicals and materials market revenue is estimated to reach USD 282.9 billion by 2032 with a CAGR of 9.9% from 2023 to 2032
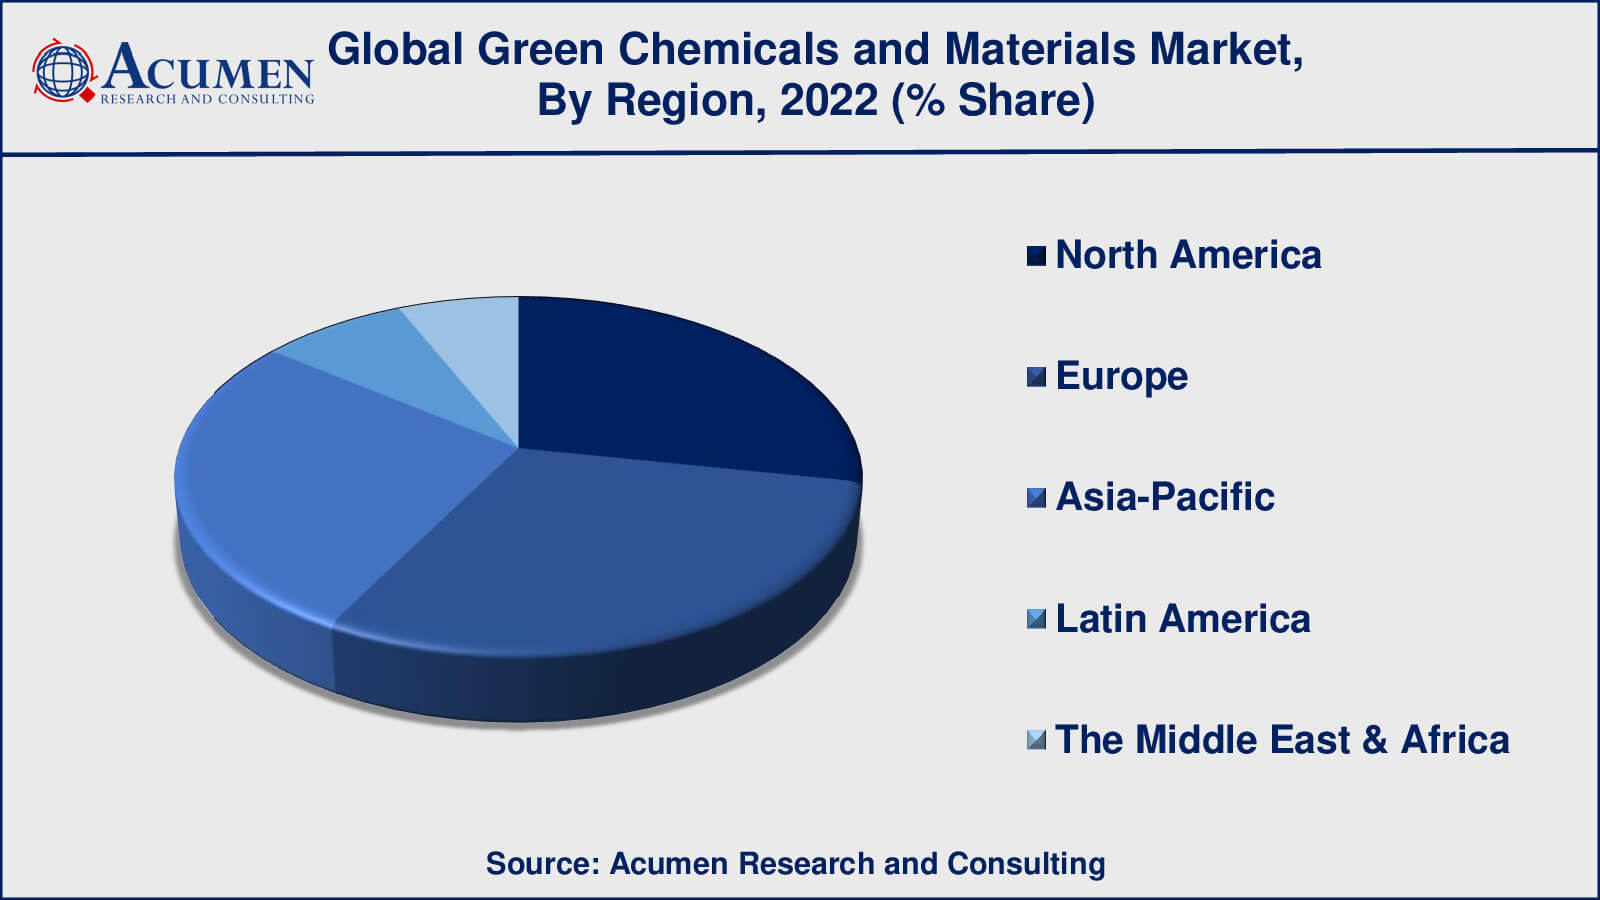
- Europe green chemicals and materials market value occupied more than USD 33 billion in 2022
- Asia-Pacific green chemicals and materials market growth will register a CAGR of around 10% from 2023 to 2032
- Among material, the bio-organic acids sub-segment generated over US$ 53 billion revenue in 2022
- Based on application, the packaging sub-segment generated around 30% share in 2022
- Emergence of new markets is a popular green chemicals and materials market trend that fuels the industry demand
Green chemicals or bio-based chemicals are chemicals that are renewable in nature and are produced from bio-based feedstock. They are less destructive to the environment than the petroleum-based creation of chemicals. Green chemicals are formed primarily using raw materials, which use rarer natural resources, preserving the ecological balance. The main raw materials used in producing green chemicals include starch, sugar, animal fat, vegetable oils, and bio-ethanol.
Construction chemicals are the chemicals that are extra in exact formulations with the cement or concrete during construction to meet the aesthetic, functional, or design requirements of any infrastructure. Green chemicals are chemicals that do not hold the components that are destructive to human health or the environment. Green chemicals are gradually preferred in the construction industry at present due to their several benefits such as strength, color, increased durability, minimum use of water and cement, ability to withstand climatic changes, chemical resistance, and protection from natural factors such as fire and heat among others. These are extensively used in the construction of residential, commercial, industrial, and other infrastructure projects.
Global Green Chemicals and Materials Market Dynamics
Market Drivers
- Government regulations and policies
- Increased focus on sustainability
- Consumer awareness
Market Restraints
- High initial investment costs
- Limited availability of raw materials
- Competition from conventional products
Market Opportunities
- Development of bio-based chemicals
- Increased emphasis on product transparency and sustainability
- Adoption of circular economy models
Green Chemicals and Materials Market Report Coverage
| Market | Green Chemicals and Materials Market |
| Green Chemicals and Materials Market Size 2022 | USD 111.2 Billion |
| Green Chemicals and Materials Market Forecast 2032 | USD 282.9 Billion |
| Green Chemicals and Materials Market CAGR During 2023 - 2032 | 9.9% |
| Green Chemicals and Materials Market Analysis Period | 2020 - 2032 |
| Green Chemicals and Materials Market Base Year | 2022 |
| Green Chemicals and Materials Market Forecast Data | 2023 - 2032 |
| Segments Covered | By Type, By Application, And By Geography |
| Regional Scope | North America, Europe, Asia Pacific, Latin America, and Middle East & Africa |
| Key Companies Profiled | Holcim Ltd, Lafarge, USG Corporation, Kingspan Group Plc, BASF, Cosan, Bayer Material Science AG, Direvo Industrial Biotechnology, CENTRIA, Anderson Corporation, SAGE Skanska, Electrochromics Inc., Balfour Beatty Plc, Stockland, Hochtief Aktiengesellschaft, Coca Cola, Codexis, Comet Biorefining, Coskata, and DSM. |
| Report Coverage |
Market Trends, Drivers, Restraints, Competitive Analysis, Player Profiling, Covid-19 Analysis, Regulation Analysis |
Green Chemicals and Materials Market Growth Factors
An increase in infrastructure developments all over the globe due to urbanization is in full process. Large-scale funds in public and private sectors are driving the demand for green chemicals and materials required for construction purposes. Governments are undertaking huge-scale projects such as the building of highways, road lines, and public infrastructure projects. Builders and contractors are significantly cutting down on construction time by making use of new chemical technologies and construction assistance. This is leading to a decrease in construction expenditure and an upgrading in the quality of work. Although green chemical technologies are presently used in large-scale infrastructure expansions such as highways and bridges, they are progressively accepted for use in residential applications. It is anticipated that concrete admixtures will be used in the building of smaller infrastructures too in nearby upcoming years.

Green Chemicals and Materials Market Segmentation
The worldwide market for green chemicals and materials is categorized based on type, application, and geography.
Green Chemicals and Materials Type Outlook
- Bio-Polymers
- Bio-Organic Acids
- Bio-Alcohols
- Bio-Ketones
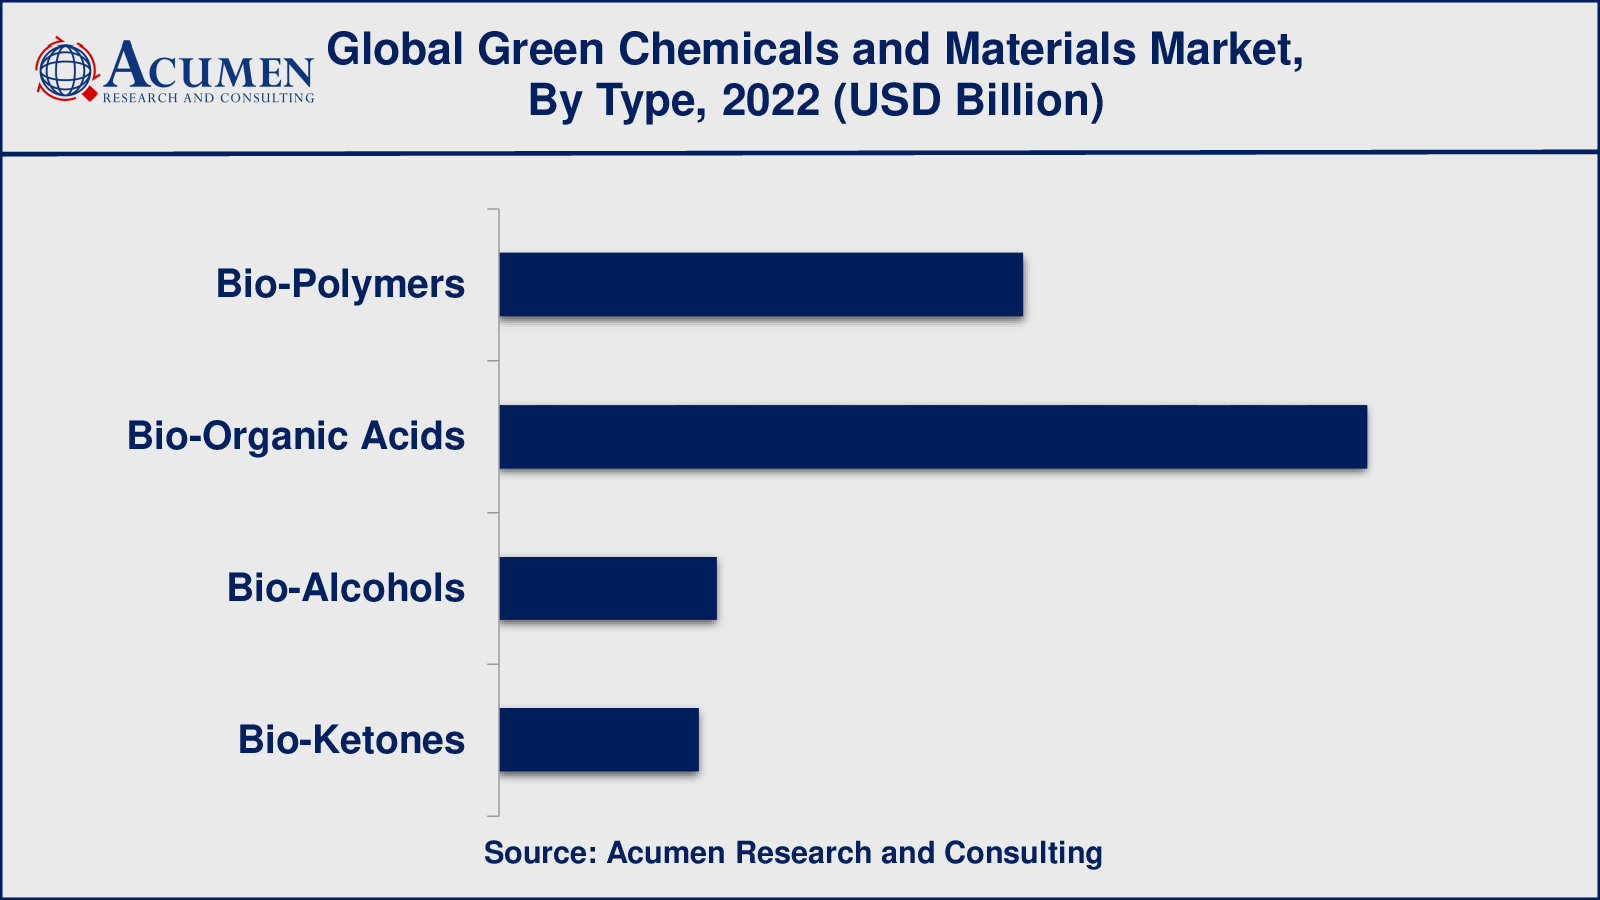
According to the green chemicals and materials industry analysis, bio-organic acids are also a significant player in the market and have gained significant market share in recent years. Bio-organic acids are organic acids created by fermenting biomass feedstocks such as corn, sugar, and vegetable oils.
Lactic acid, succinic acid, and citric acid are three of the most commonly used bio-organic acids. These acids are used in a variety of industries, including food and beverages, pharmaceuticals, and industrial chemicals. They have several advantages over petroleum-based counterparts, including being renewable, biodegradable, and having a lower carbon footprint.
The increasing demand for eco-friendly and sustainable products, as well as the increased focus on reducing carbon emissions, are driving growth in the bio-organic acids market. Furthermore, advances in biotechnology have enabled more efficient production of bio-organic acids, lowering production costs and making them more competitive with petroleum-based products.
Green Chemicals and Materials Application Outlook
- Construction
- Food and Beverages
- Personal Care
- Packaging
- Automotive
- Agriculture
- Textiles
According to the green chemicals and materials market forecast, from 2023 to 2030, packaging will be the most important application area for green chemicals and materials. The growing consciousness about ecological problems and the need to reduce carbon footprint is driving up demand for eco-friendly packaging solutions. Bioplastics, biodegradable polymers, and recycled materials are becoming increasingly popular as green packaging materials.
The second-largest industry for green chemicals and materials is the construction industry. Green concrete, sustainable wood, and insulation materials made from recycled materials are in high demand as sustainable building materials.
Another important application area for green chemicals and materials is the automotive industry. Green chemicals and materials are used in the production of hybrid and electric vehicles, as well as components such as tyres, plastics, and coatings, as demand for eco-friendly vehicles has increased.
Green Chemicals and Materials Market Regional Outlook
North America
- U.S.
- Canada
Europe
- U.K.
- Germany
- France
- Spain
- Rest of Europe
Asia-Pacific
- India
- Japan
- China
- Australia
- South Korea
- Rest of Asia-Pacific
Latin America
- Brazil
- Mexico
- Rest of Latin America
The Middle East & Africa
- South Africa
- GCC Countries
- Rest of the Middle East & Africa (ME&A)
Green Chemicals and Materials Market Regional Analysis
Europe is a major market for green chemicals and materials, driven by the desire to reduce carbon emissions and the growing demand for environmentally friendly products. The European Union has implemented a number of policies to encourage the use of renewable resources and reduce reliance on fossil fuels, which has fueled the growth of the region's green chemicals and materials market. Asia-Pacific is the world's fastest growing market for green chemicals and materials, and it is expected to remain so in the future. Green chemical and material production in India and China will continue to drive market growth, but exports to Western countries will boost regional market revenues.
North America is a major player in the green chemicals and materials market, with the United States being the region's largest market. The market is being driven by rising demand for sustainable products and a focus on lowering carbon emissions. The region is home to many major green chemical and material manufacturers, and demand for environmentally friendly products is expected to increase in the coming years.
Green Chemicals and Materials Market Players
Some of the green chemicals and materials companies include Holcim Ltd, Lafarge, USG Corporation, Kingspan Group Plc, BASF, Cosan, Bayer Material Science AG, Direvo Industrial Biotechnology, CENTRIA, Anderson Corporation, SAGE Skanska, Electrochromics Inc., Balfour Beatty Plc, Stockland, Hochtief Aktiengesellschaft, Coca Cola, Codexis, Comet Biorefining, Coskata, and DSM.
Frequently Asked Questions
What was the market size of the global green chemicals and materials in 2022?
The market size of green chemicals and materials was USD 111.2 billion in 2022.
What is the CAGR of the global green chemicals and materials market from 2023 to 2032?
The CAGR of green chemicals and materials is 9.9% during the analysis period of 2023 to 2032.
Which are the key players in the green chemicals and materials market?
The key players operating in the global market are including Holcim Ltd, Lafarge, USG Corporation, Kingspan Group Plc, BASF, Cosan, Bayer Material Science AG, Direvo Industrial Biotechnology, CENTRIA, Anderson Corporation, SAGE Skanska, Electrochromics Inc., Balfour Beatty Plc, Stockland, Hochtief Aktiengesellschaft, Coca Cola, Codexis, Comet Biorefining, Coskata, and DSM.
Which region dominated the global green chemicals and materials market share?
Europe held the dominating position in green chemicals and materials industry during the analysis period of 2023 to 2032.
Which region registered fastest CAGR from 2023 to 2032?
Asia-Pacific region exhibited fastest growing CAGR for market of green chemicals and materials during the analysis period of 2023 to 2032.
What are the current trends and dynamics in the global green chemicals and materials industry?
The current trends and dynamics in the green chemicals and materials industry include increasing pet ownership, growing awareness about pet health, and innovation in green chemicals and materials products.
Which Material held the maximum share in 2022?
The bio-organic acids material held the maximum share of the green chemicals and materials industry.


