Glycobiology Market Size - Global Industry, Share, Analysis, Trends and Forecast 2024 - 2032
Published :
Report ID:
Pages :
Format :
Glycobiology Market Size - Global Industry, Share, Analysis, Trends and Forecast 2024 - 2032
Report Coverage
- Industry Dynamics
- Market Size and Forecast Data
- Segment Analysis
- Competitive Landscape
- Regional Analysis with a Niche Focus on Country-Level Data
- High Level Analysis - Porter's, PESTEL, Value Chain, etc.
- Company Profiles of Key Players
- Option to Customize the Report As Per Your Specific Need
Request Sample Report
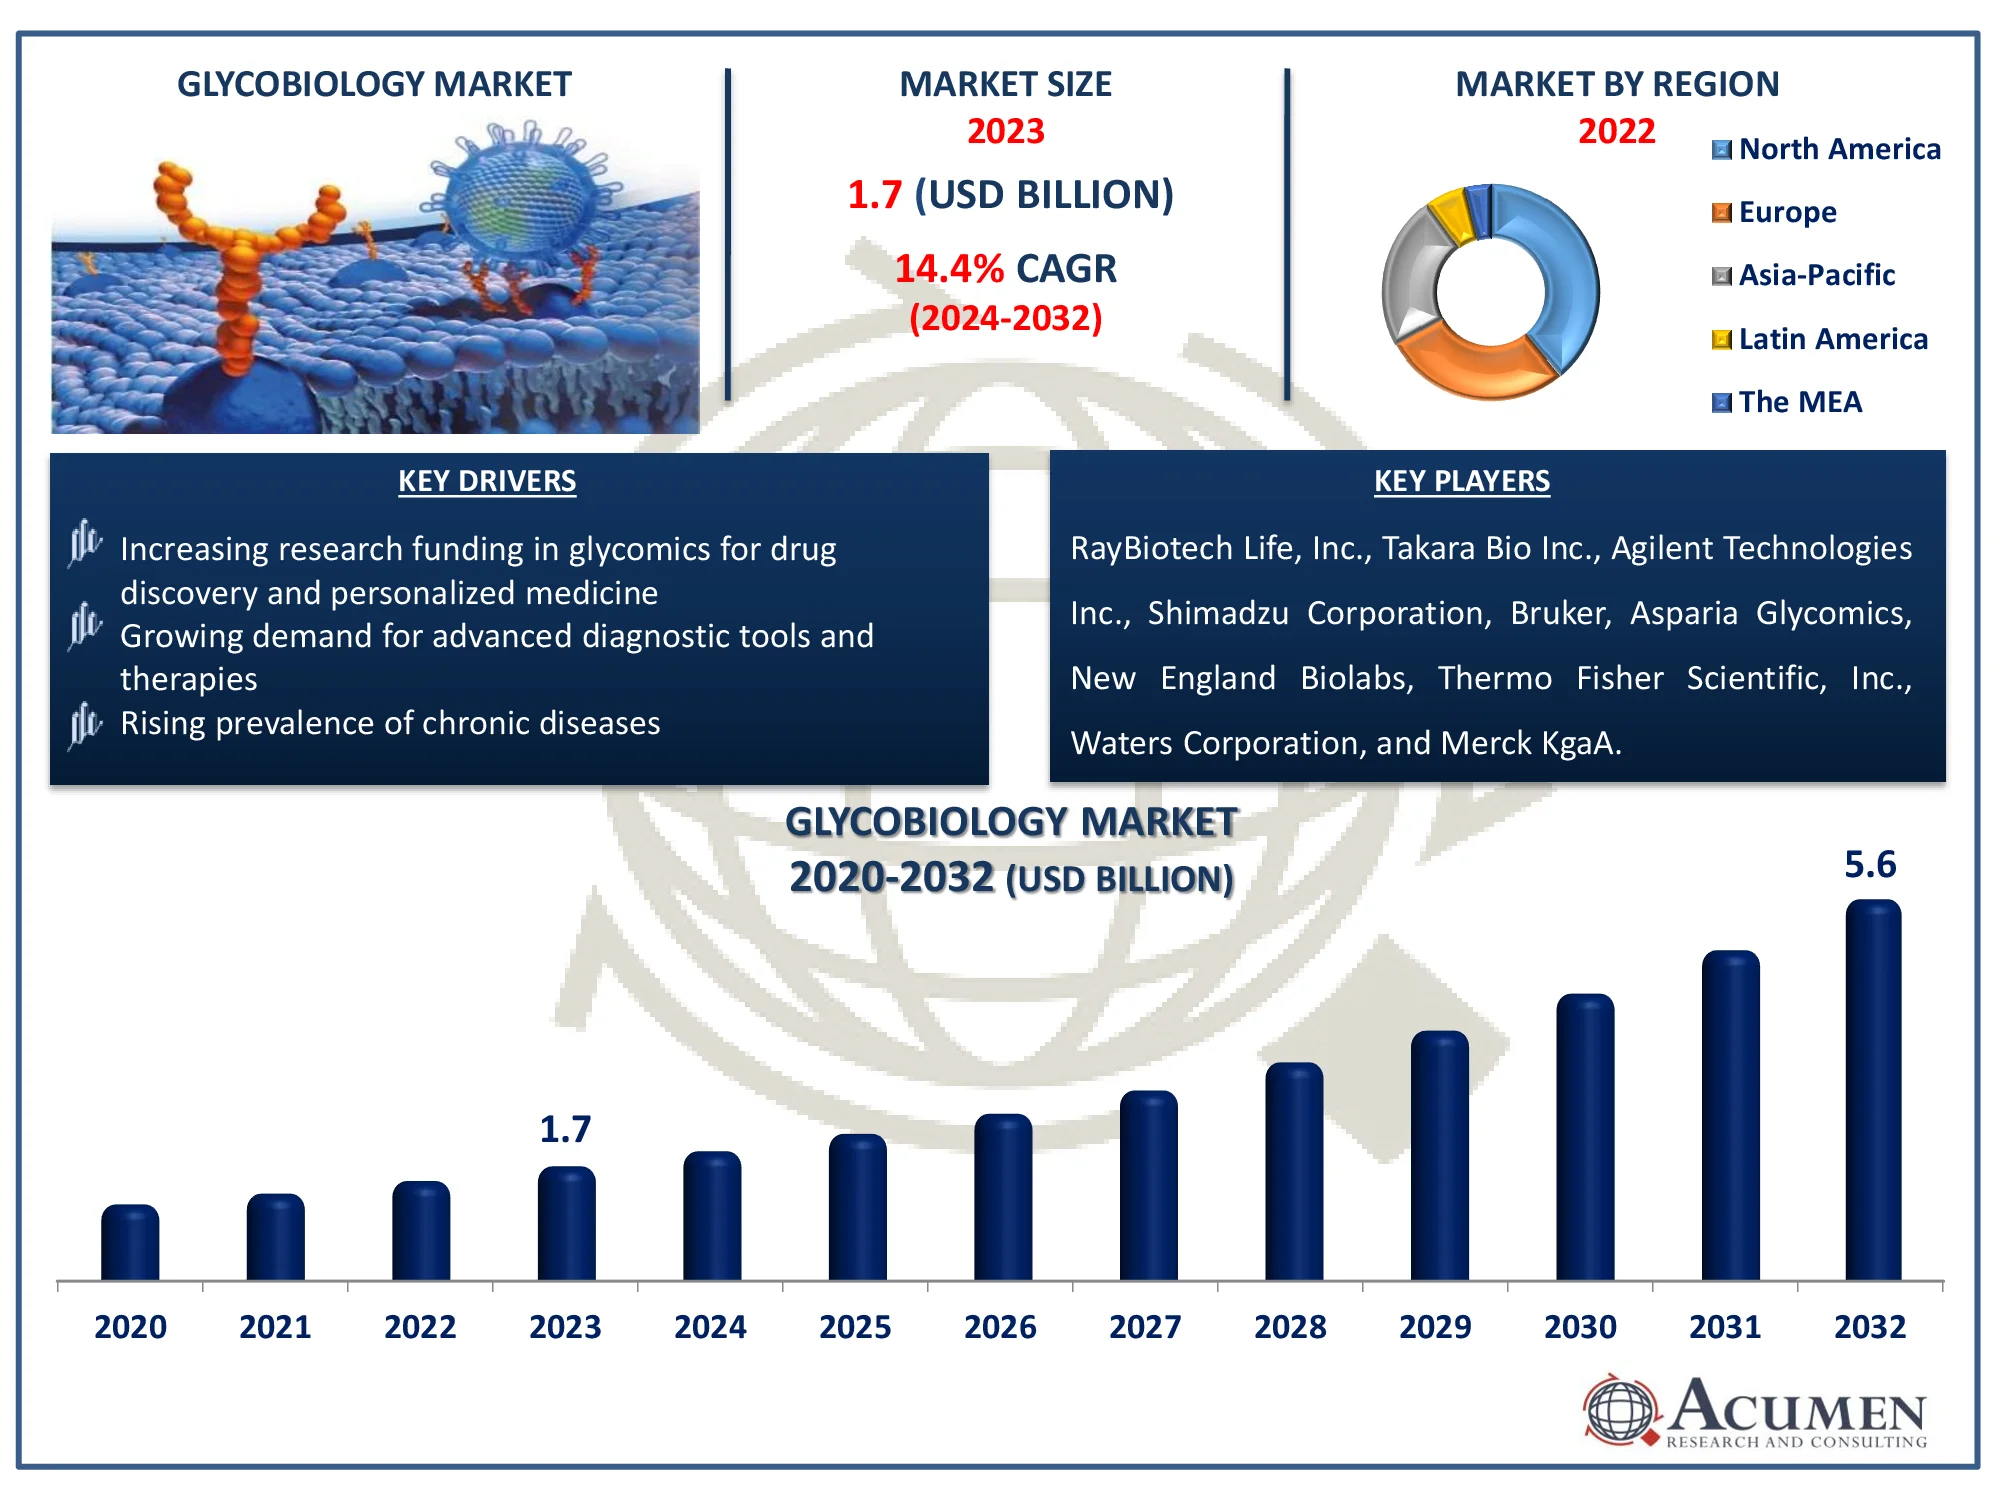
The Global Glycobiology Market Size accounted for USD 1.7 Billion in 2023 and is estimated to achieve a market size of USD 5.6 Billion by 2032 growing at a CAGR of 14.4% from 2024 to 2032.
Glycobiology Market Highlights
- The global glycobiology market is expected to reach USD 5.6 billion by 2032, with a CAGR of 14.4% from 2024 to 2032
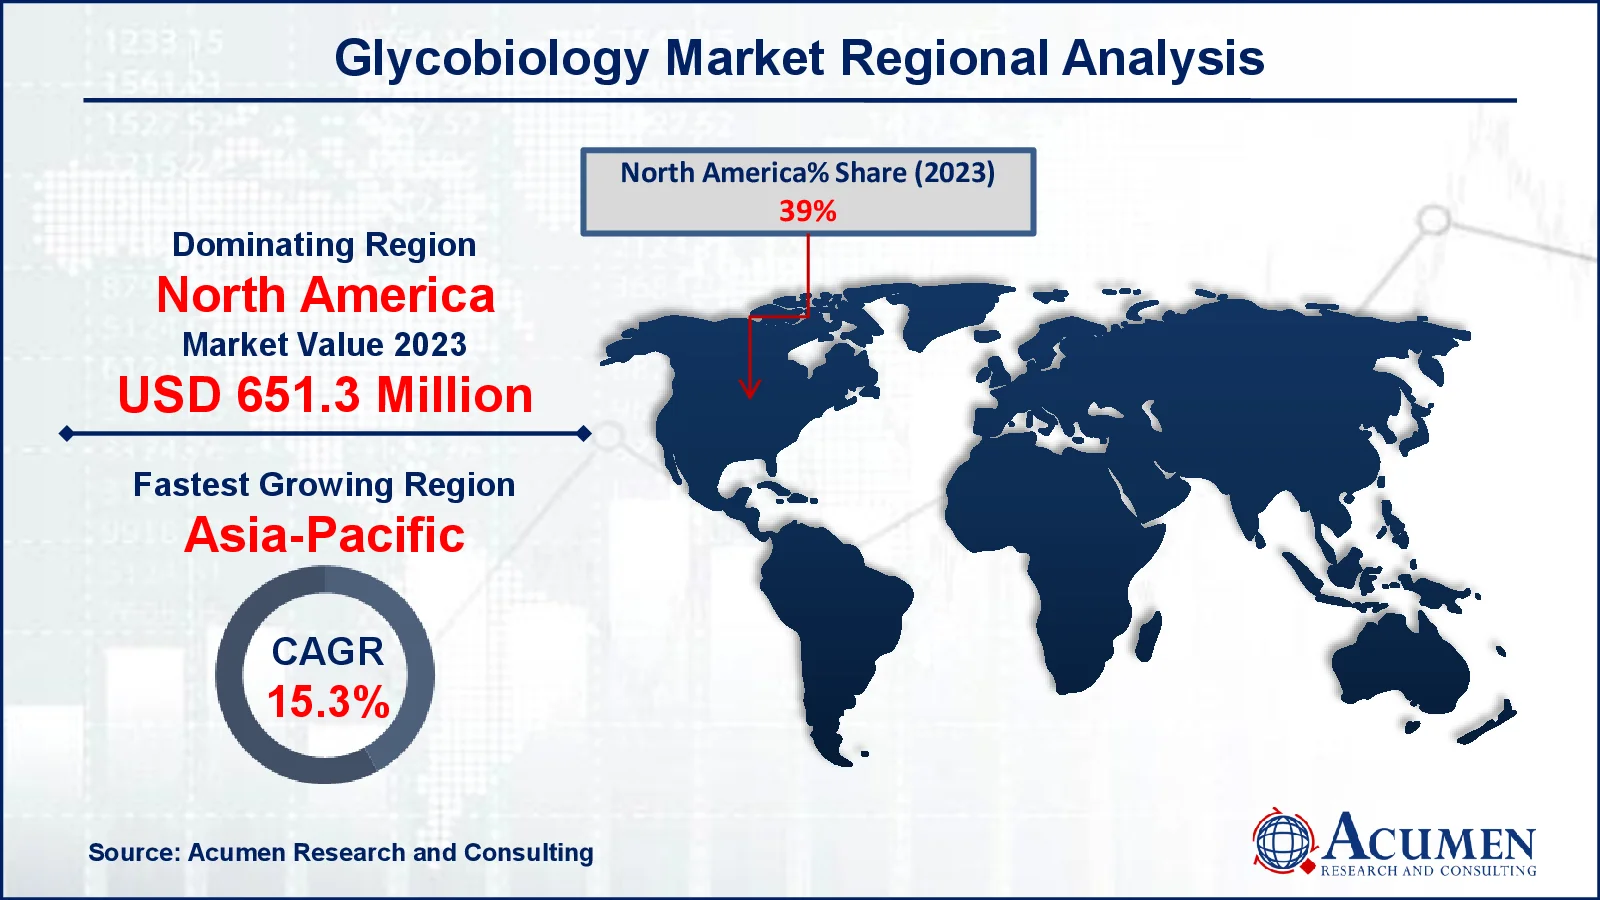
- In 2023, the North American glycobiology market was valued at approximately USD 651.3 million
- The Asia-Pacific region is projected to grow at a CAGR of over 15.3% from 2024 to 2032
- Enzyme products accounted for 30% of the market share in 2023
- The drug discovery and development application sub-segment held 42% of the market share in 2023
- Academic and research institutes represented 38% of the end-user market share in 2023
- Increasing focus on cancer research due to the role of glycans in tumor progression and metastasis is the glycobiology market trend that fuels the industry demand

Glycomics, also known as glycobiology, is the complete study of sugar chains (glycans) and their significance in biological processes. It entails investigating the structure, function, and interactions of carbohydrates bound to proteins and lipids, which are critical for cell signaling, immunological response, and disease progression. Glycomics is important in drug discovery and development because many therapeutic proteins are glycosylated, which affects efficacy and toxicity. Glycan profiling can uncover disease biomarkers, especially in malignancies and autoimmune illnesses. Furthermore, glycobiology aids in vaccine formulation, increasing the efficacy of immune responses.
Global Glycobiology Market Dynamics
Market Drivers
- Increasing research funding in glycomics for drug discovery and personalized medicine
- Growing demand for advanced diagnostic tools and therapies targeting glycan structures
- Rising prevalence of chronic diseases, boosting the need for glycobiology applications
Market Restraints
- High costs associated with glycomics research and development
- Limited availability of specialized glycomics tools and technologies
- Complexity of glycans and the lack of standardized methodologies hindering research
Market Opportunities
- Expansion of glycomics in biopharmaceuticals and vaccine development
- Integration of glycomics with genomics and proteomics for comprehensive analysis
- Increasing interest in glycan-based biomarkers for early disease detection
Glycobiology Market Report Coverage
| Market | Glycobiology Market |
| Glycobiology Market Size 2022 |
USD 1.7 Billion |
| Glycobiology Market Forecast 2032 | USD 5.6 Billion |
| Glycobiology Market CAGR During 2023 - 2032 | 14.4% |
| Glycobiology Market Analysis Period | 2020 - 2032 |
| Glycobiology Market Base Year |
2023 |
| Glycobiology Market Forecast Data | 2024 - 2032 |
| Segments Covered | By Function, By Application, By End Use, And By Geography |
| Regional Scope | North America, Europe, Asia Pacific, Latin America, and Middle East & Africa |
| Key Companies Profiled | RayBiotech Life, Inc., Takara Bio Inc., Agilent Technologies Inc., Shimadzu Corporation, Bruker, Asparia Glycomics, New England Biolabs, Thermo Fisher Scientific, Inc., Waters Corporation, and Merck KgaA. |
| Report Coverage |
Market Trends, Drivers, Restraints, Competitive Analysis, Player Profiling, Covid-19 Analysis, Regulation Analysis |
Glycobiology Market Insights
The glycomics/glycobiology market should be driven by technical advancements. Another important contributing element is increased investment by various public organizations in research and the development of new treatments by pharmaceutical and biotechnology companies. Furthermore, increased focus on glycomics and proteomics research is projected to drive market growth in the near future. Increased government and organizational investment has enabled university scientists to develop new glycomics and glycobiology tools. This aspect is projected to propel the glycoscience discipline, and consequently the market as a whole. Advanced analytical approaches for pathogen and human glycobiology in disease and health are required in glycoproteomics.
Biomedical research and proteomics have therefore increased, and the industry is expanding. Increased demand for glycomic tools prompted technological advancements. Protein characterization approaches, such as HPC, Mass Spectrometry (MS), and Capillary Electrophoresis (CE), are becoming cutting-edge technologies in chemical and biochemistry research. These cutting-edge methods produce fast and responsive results. Pharmaceutical and biotechnology companies are strengthening their R&D efforts, including glycomics research. Small pharmaceutical businesses also invest more in research and development. In the coming years, this aspect is projected to accelerate market expansion.
The growth of glycomics in biopharmaceuticals and vaccine development represents a substantial opportunity for the glycomics/glycobiology market as knowing glycan structures can improve the efficacy and safety of therapeutics. Glycosylation patterns influence drug stability, bioavailability, and immune response, making targeted glycan modification an important method in drug design. Furthermore, glycomics can improve vaccine formulation by optimizing glycan interactions, resulting in greater immune responses. As biopharmaceutical companies focus more on personalized and precision medicine, the need for advanced glycomics research and applications is likely to rise, propelling the market forward.
Glycobiology Market Segmentation
The worldwide market for glycobiology is split based on product, application, end use, and geography.
Glycobiology Product
- Reagents
- Oligosaccharides
- Glycoproteins
- Monosaccharides
- Others
- Kits
- Glycan Labeling Kits
- Glycan Release Kits
- Glycan Purification Kits
- Others
- Enzymes
- Sialyltransferases
- Glycosidases
- Glycosyltransferases
- Neuraminidases
- Others
- Instruments
- Mass Spectrometers
- MALDI-TOF
- HPLC
- Array Systems
- Others
According to the glycobiology industry analysis, enzymes dominate industry because they are critical tools for investigating glycan architecture and functions. Glycosidases, particularly glycosyltransferases, are utilized to break and generate glycans, allowing for thorough investigation and manipulation of complex carbohydrates in biological systems. These enzymes are essential for drug research, diagnostics, and therapeutic protein production because they provide precise control over glycosylation patterns. With the increased demand for glycan-based research in biopharma, enzyme technologies are driving glycomics market growth.
Glycobiology Application
- Diagnostics
- Drug Discovery & Development
- Others
According to the glycobiology industry analysis, drug discovery and development accounted for the largest market share in 2023, based on implementation. This is mostly owing to extensive R&D and increased governmental funding for glycomics and proteome research. During the projected period, the other application sector is expected to have the highest CAGR due to rising research and research costs invested by major research businesses. The widespread use of glycanstructured studies in bioinformatics promotes glycene research, which helps to identify and evaluate therapeutic targets and biomarkers. Glycomics is the study of the characteristics of biological systems and glycan structures. It is thus ideal for the early detection of disorders in tailored pharmaceuticals to select the right therapy.
Glycobiology End Use
- Pharmaceutical & Biotechnology Companies
- Academic & Research Institutes
- CROs
- Biopharmaceutical Companies
- Others
According to the glycobiology market forecast, academic and scientific institutes growing at 38% due to increased expenditure in R&D. Cooperation between major organizations and research institutes also helps to drive segment growth. The Pharma and biotechnology industry is predicted to have the greatest CAGR throughout the preliminary period due to increasing expenditure in R&D for drug research, research and growth, and further glycobiology research.
The growing adoption by research institutions of evaluating glycan structure information contributes to the segment's growth. Another aspect driving segment growth is glycomic inclination for education and training. A wide range of applications in drug discovery and development, biomedical research, cell biology, immunology, and biochemistry are expected to boost the glycomics market in the near future.
Glycobiology Market Regional Outlook
North America
- U.S.
- Canada
Europe
- U.K.
- Germany
- France
- Spain
- Rest of Europe
Asia-Pacific
- India
- Japan
- China
- Australia
- South Korea
- Rest of Asia-Pacific
Latin America
- Brazil
- Mexico
- Rest of Latin America
The Middle East & Africa
- South Africa
- GCC Countries
- Rest of the Middle East & Africa (ME&A)

Glycobiology Market Regional Analysis
For several reasons, in 2023, North America's largest glycomics/glycobiology market share due to the presence of major pharmaceutical and biopharmaceutical companies. The availability of well-established healthcare facilities and access to developed commodities has fueled growth in the area market. Furthermore, public funding for R&D is an important role in accelerating the market development of glycobiology in this field.
Due to unexplored market potential, Asia-Pacific is expected to be the second fastest growing national glycomics/glycobiology market in the future. The growing pharmaceutical and biopharmaceutical businesses have resulted in significant glycomic development in the area. Furthermore, Contract research organizations (CROs) should invest in medication and biologic discovery and manufacture to encourage the expansion of the Asia-Pacific glycobiology industry.
Bio-based companies in Europe are expected to provide global competitive advantages for glycomics market due to their prominence in contemporary biotechnology and ability to access new and innovative technologies. The presence of big pharmaceutical corporations and evolving healthcare infrastructure suggest that Latin America will experience consistent growth while its economies develop rapidly. Brazil is expected to grow at a lucrative CAGR during the projection period as more studies on life science and health infrastructure development are conducted.
Glycobiology Market Players
Some of the top glycobiology companies offered in our report include RayBiotech Life, Inc., Takara Bio Inc., Agilent Technologies Inc., Shimadzu Corporation, Bruker, Asparia Glycomics, New England Biolabs, Thermo Fisher Scientific, Inc., Waters Corporation, and Merck KgaA.
Frequently Asked Questions
How big is the glycobiology market?
The glycobiology market size was valued at USD 1.7 billion in 2023.
What is the CAGR of the global glycobiology market from 2024 to 2032?
The CAGR of glycobiology is 14.4% during the analysis period of 2024 to 2032.
Which are the key players in the glycobiology market?
The key players operating in the global market are including RayBiotech Life, Inc., Takara Bio Inc., Agilent Technologies Inc., Shimadzu Corporation, Bruker, Asparia Glycomics, New England Biolabs, Thermo Fisher Scientific, Inc., Waters Corporation, and Merck KgaA.
Which region dominated the global glycobiology market share?
North America held the dominating position in glycobiology industry during the analysis period of 2024 to 2032.
Which region registered fastest CAGR from 2024 to 2032?
Asia-Pacific region exhibited fastest growing CAGR for market of glycobiology during the analysis period of 2024 to 2032.
What are the current trends and dynamics in the global glycobiology Industry?
The current trends and dynamics in the glycobiology industry include increasing research funding in glycomics for drug discovery and personalized medicine, growing demand for advanced diagnostic tools and therapies targeting glycan structures, and rising prevalence of chronic diseases, boosting the need for glycobiology applications.
Which product held the maximum share in 2023?
The enzyme held the maximum share of the glycobiology industry.


