Gas Turbine Market Size - Global Industry, Share, Analysis, Trends and Forecast 2022 - 2030
Published :
Report ID:
Pages :
Format :
Gas Turbine Market Size - Global Industry, Share, Analysis, Trends and Forecast 2022 - 2030
Report Coverage
- Industry Dynamics
- Market Size and Forecast Data
- Segment Analysis
- Competitive Landscape
- Regional Analysis with a Niche Focus on Country-Level Data
- High Level Analysis - Porter's, PESTEL, Value Chain, etc.
- Company Profiles of Key Players
- Option to Customize the Report As Per Your Specific Need
Request Sample Report
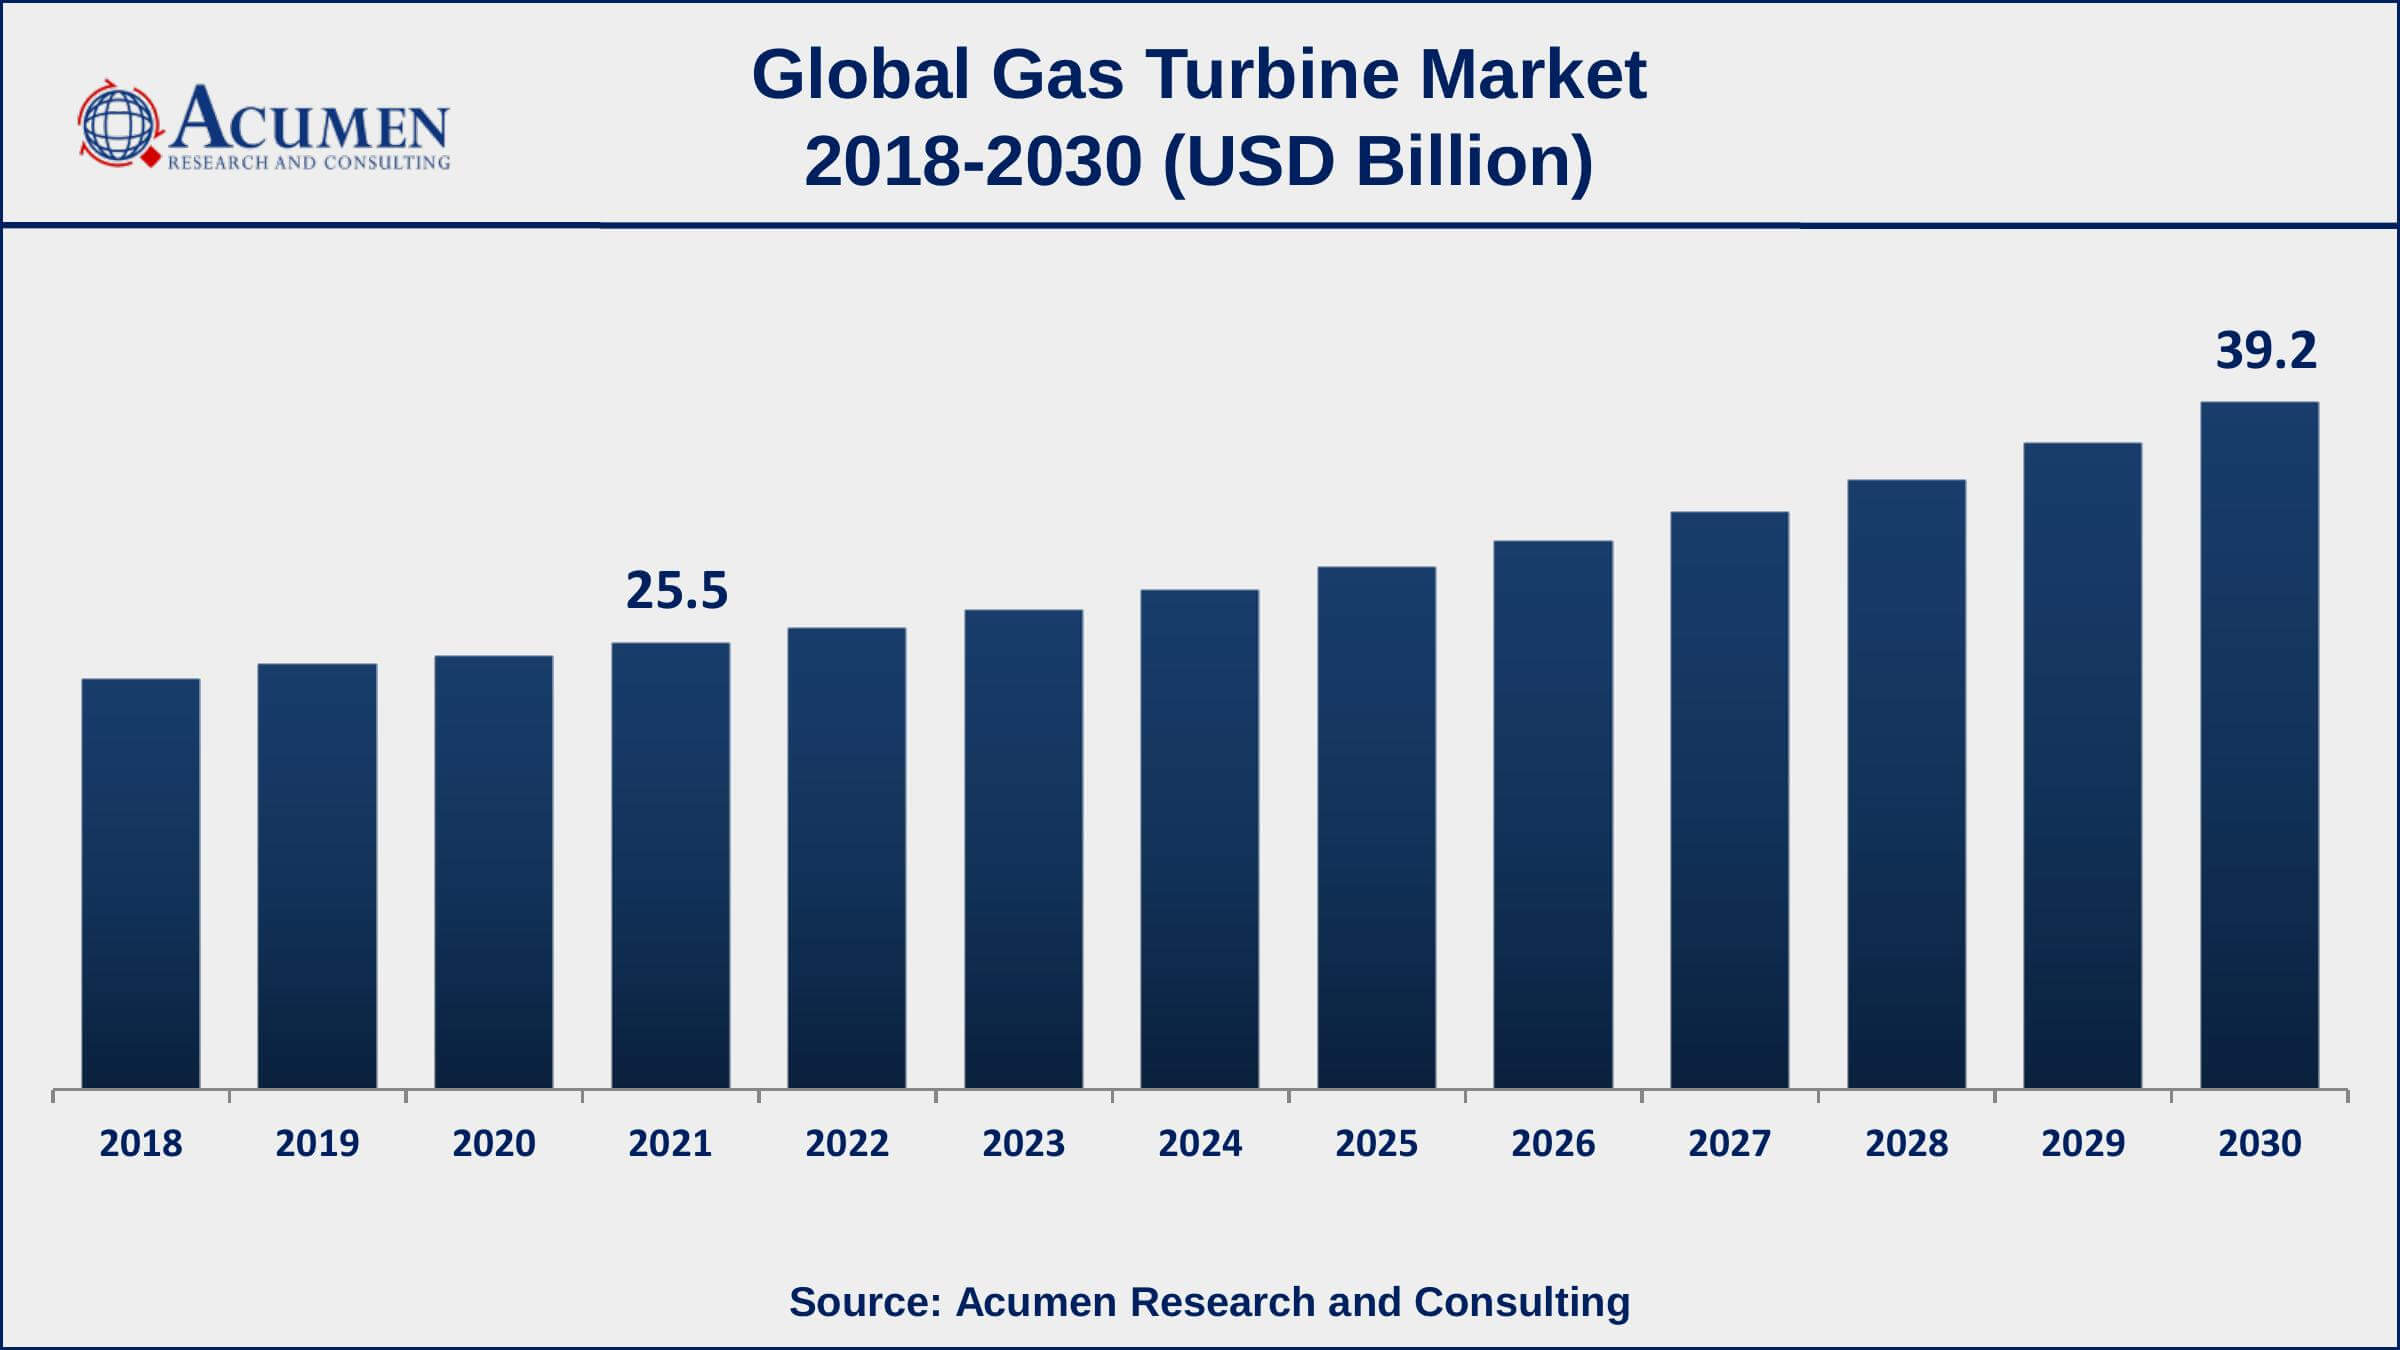
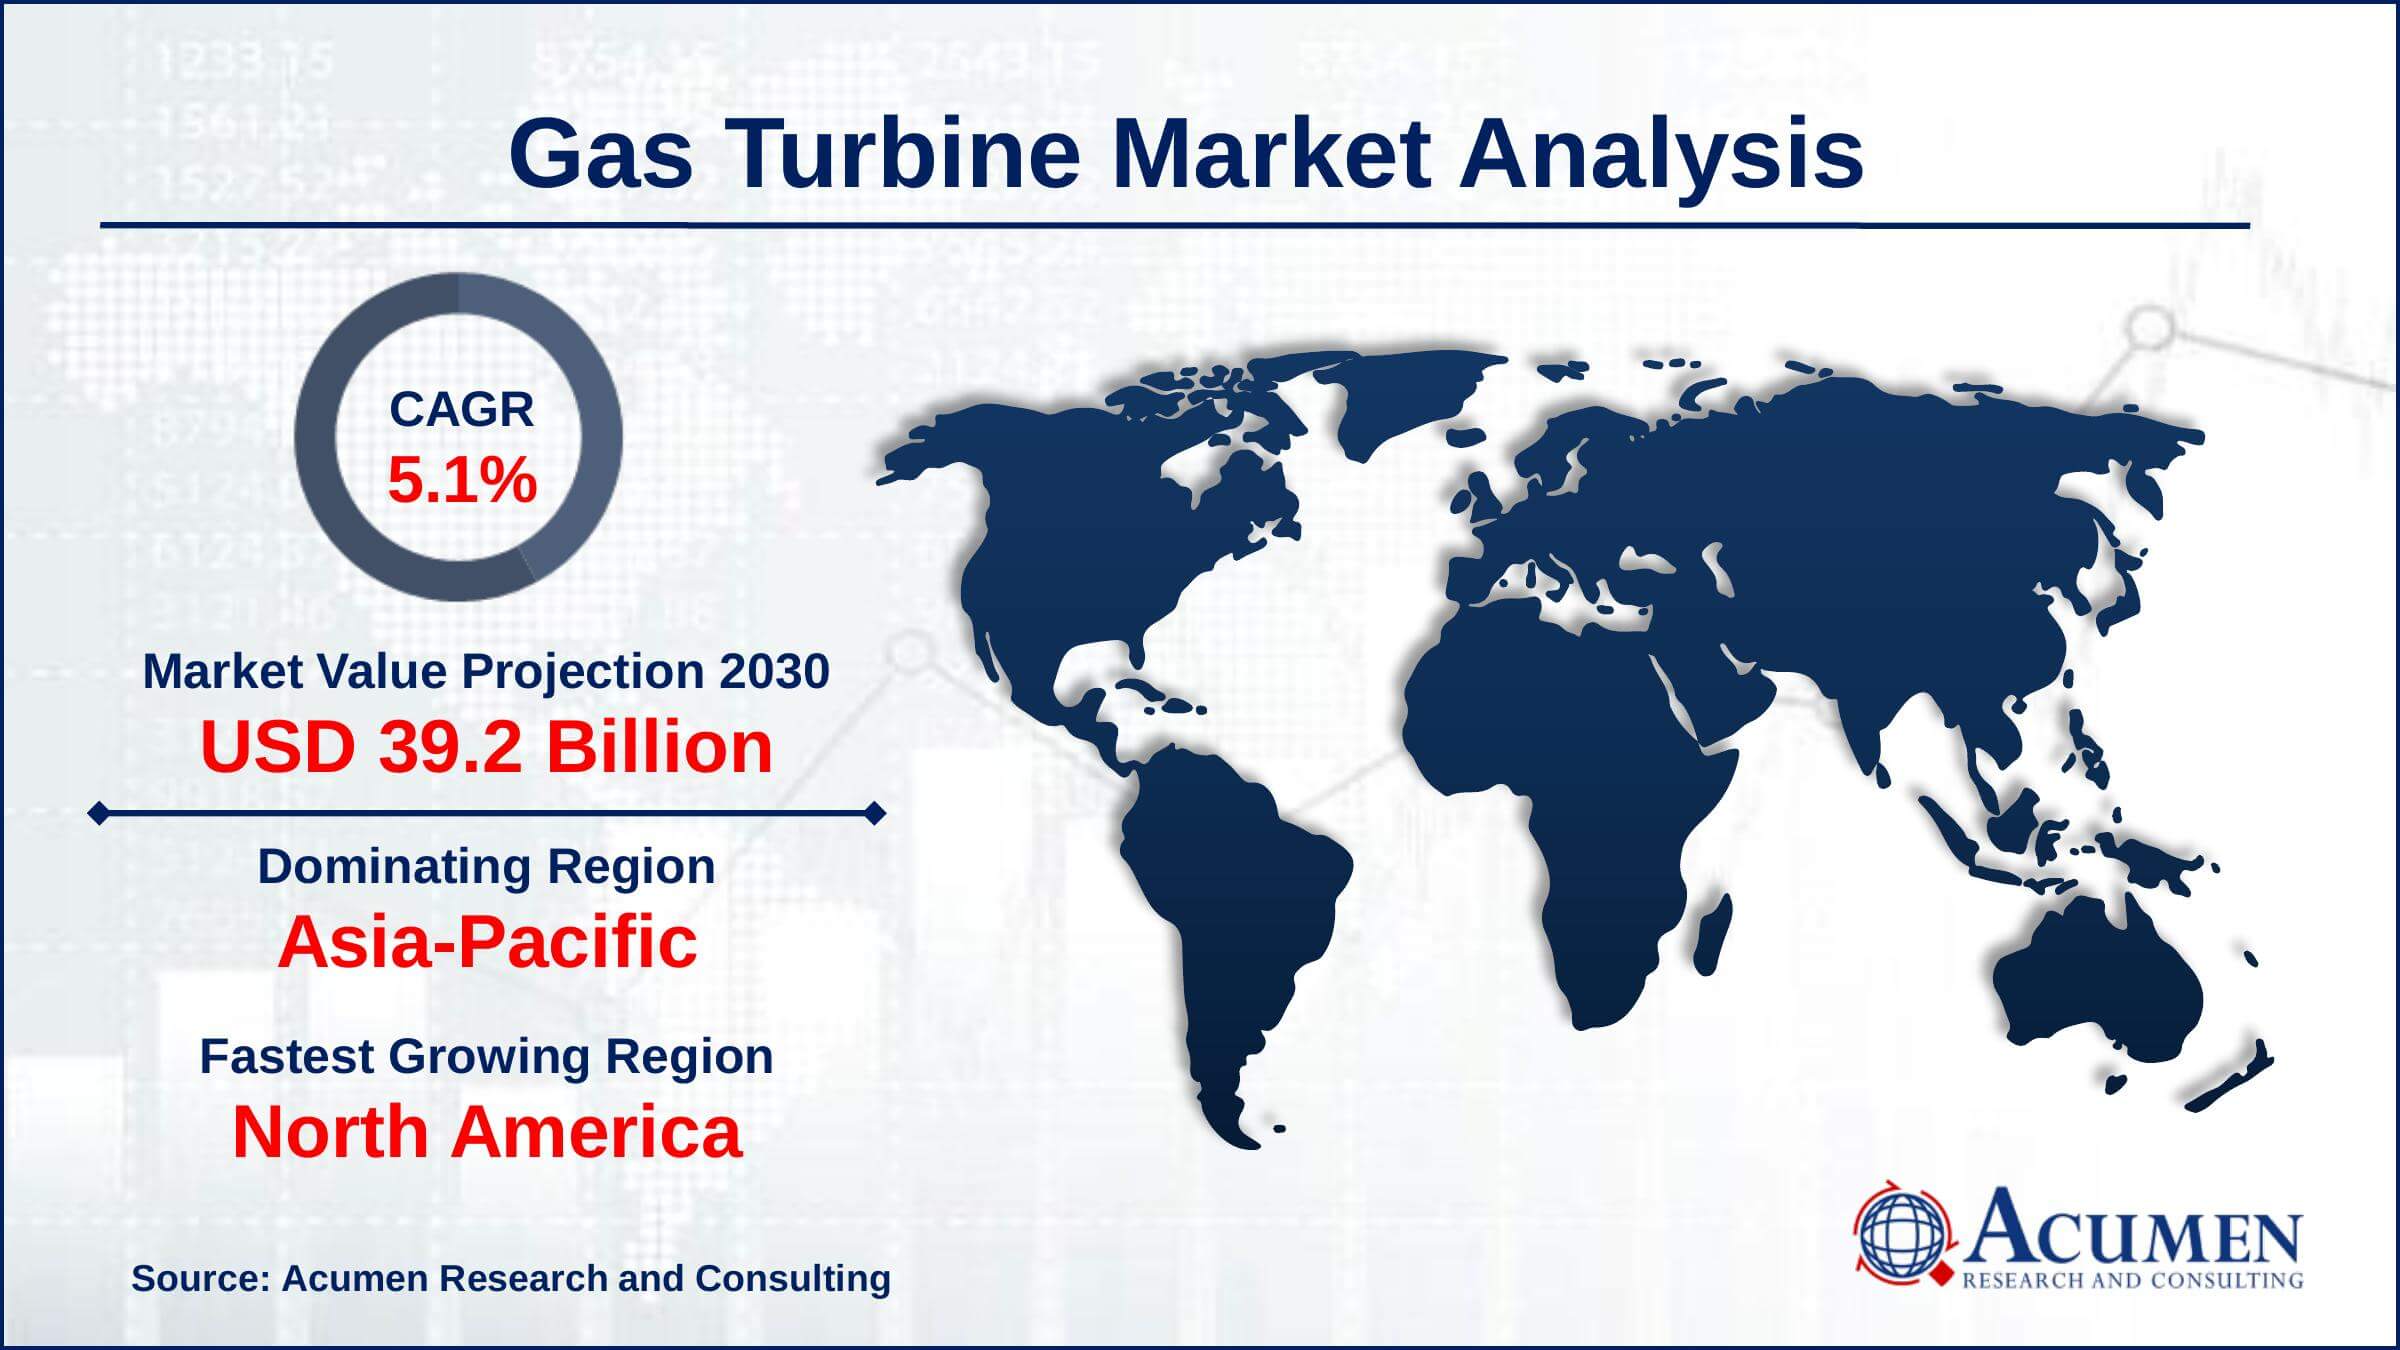
The Global Gas Turbine Market Size accounted for USD 25.5 Billion in 2021 and is estimated to achieve a market size of USD 39.2 Billion by 2030 growing at a CAGR of 5.1% from 2022 to 2030. Growing worries about GHG emissions as a consequence of stringent government rules requiring the use of gas-fired turbines over traditional power generation units are likely to drive the expansion of the gas turbine market growth. Furthermore, rapid technological advances in the power industry, together with a shifting focus toward a distributed generation of electricity technologies, are boosting the global gas turbine market value.
Gas Turbine Market Report Key Highlights
- Global gas turbine market revenue is expected to increase by USD 39.2 billion by 2030, with a 5.1% CAGR from 2022 to 2030.
- Asia-Pacific region led with more than 31% gas turbine market share in 2021
- North America gas turbine market growth will observe highest CAGR from 2022 to 2030
- By capacity, the >200 MW segment has accounted market share of over 64% in 2021
- Among application, aviation segment is growing at a strongest CAGR over the forecast period
- Rising demand for electricity, drives the gas turbine market size
Gas turbines are mostly used to generate electricity. It is considerably more expensive to operate a simple cycle turbine power station than it is to buy outside electricity to feed the sector. As a result, combined cycle energy facilities, which are more efficient, are used most of the time. A CHP system is a kind of combined cycle plant, which can generate energy as well as provide mechanical drive.
Global Gas Turbine Market Trends
Market Drivers
- Increasing demand for natural gas-fired power stations
- Rising demand for electricity
- Growing focus on the reduction of carbon dioxide emissions
- Rapidly increasing aviation industry across the globe
Market Restraints
- Natural gas price volatility
- Increasing emphasis on renewable energy
Market Opportunities
- Increased tendency of distributed power generation
- Replacement of decommissioned nuclear and coal plants
Gas Turbine Market Report Coverage
| Market | Gas Turbine Market |
| Gas Turbine Market Size 2021 | USD 25.5 Billion |
| Gas Turbine Market Forecast 2030 | USD 39.2 Billion |
| Gas Turbine Market CAGR During 2022 - 2030 | 5.1% |
| Gas Turbine Market Analysis Period | 2018 - 2030 |
| Gas Turbine Market Base Year | 2021 |
| Gas Turbine Market Forecast Data | 2022 - 2030 |
| Segments Covered | By Capacity, By Technology, By Application, And By Geography |
| Regional Scope | North America, Europe, Asia Pacific, Latin America, and Middle East & Africa |
| Key Companies Profiled | Gas turbineare Zorya-Mashproekt, Harbin Electric International Company, General Electric, NPO Saturn, Siemens AG, Cryostar, Wartsila, Capstone Turbine, Mitsubishi Hitachi Power Systems, Man Diesel & Turbo, BHEL, Vericor Power Systems, Kawasaki Heavy Industries, Solar Turbines, and Opra Turbines. |
| Report Coverage |
Market Trends, Drivers, Restraints, Competitive Analysis, Player Profiling, Regulation Analysis |
The market is required to be driven by increasing pressure from worldwide organizations to diminish carbon impression, alongside low shale gas costs. Motivating forces given by local governments to gas-based power generation organizations to battle expanding carbon impressions are probably going to drive showcase development. Gas turbines saw a particular increment in 2015, indicating an adjustment in arrangements by power generators to gain from low gas costs. The absolute biggest gas turbine shipments are assessed to make a beeline for Latin America, U.S., and Europe. In any case, Asia Pacific will probably show the quickest development rate within the coming years.
Post-2016, steam turbine orders are grabbing also, impersonating the pattern in gas turbines, attributable to rising CHP establishments over the globe. Combined cycle power generation is the most proficient type of innovation to produce power. This innovation portion additionally represents the biggest offer in the gas turbine market.
Gas Turbine Market Insights
Increasing pressure from global offices to decrease carbon impression, alongside low shale costs, is driving business sector development. Local governments offering motivators for natural gas-based electricity generation is a key pattern profiting the market.
Worldwide electricity demand in the coming years is relied upon to increment by almost 33% of the present demand. Significant gas-delivering areas, for example, the Middle East, U.S., and Russia are seeing a noteworthy redo in their power generation framework to forcefully seek after gas-based power generation. Critical establishments are likewise found in Southeast Asia, Latin America, and Africa.
Turbines play a vital job in lessening carbon discharges. In examination with other burning-based power generation applications, they show to bring down outflows. With the execution of different environmental change activities just as directions to chop down GHG emissions, their potential is required to increment in the up and coming years.
Gas Turbine Market Segmentation
The global gas turbine market segmentation is based on capacity, technology, application, and geography.
Gas Turbine Market By Capacity
- ≤200 MW
- >200 MW
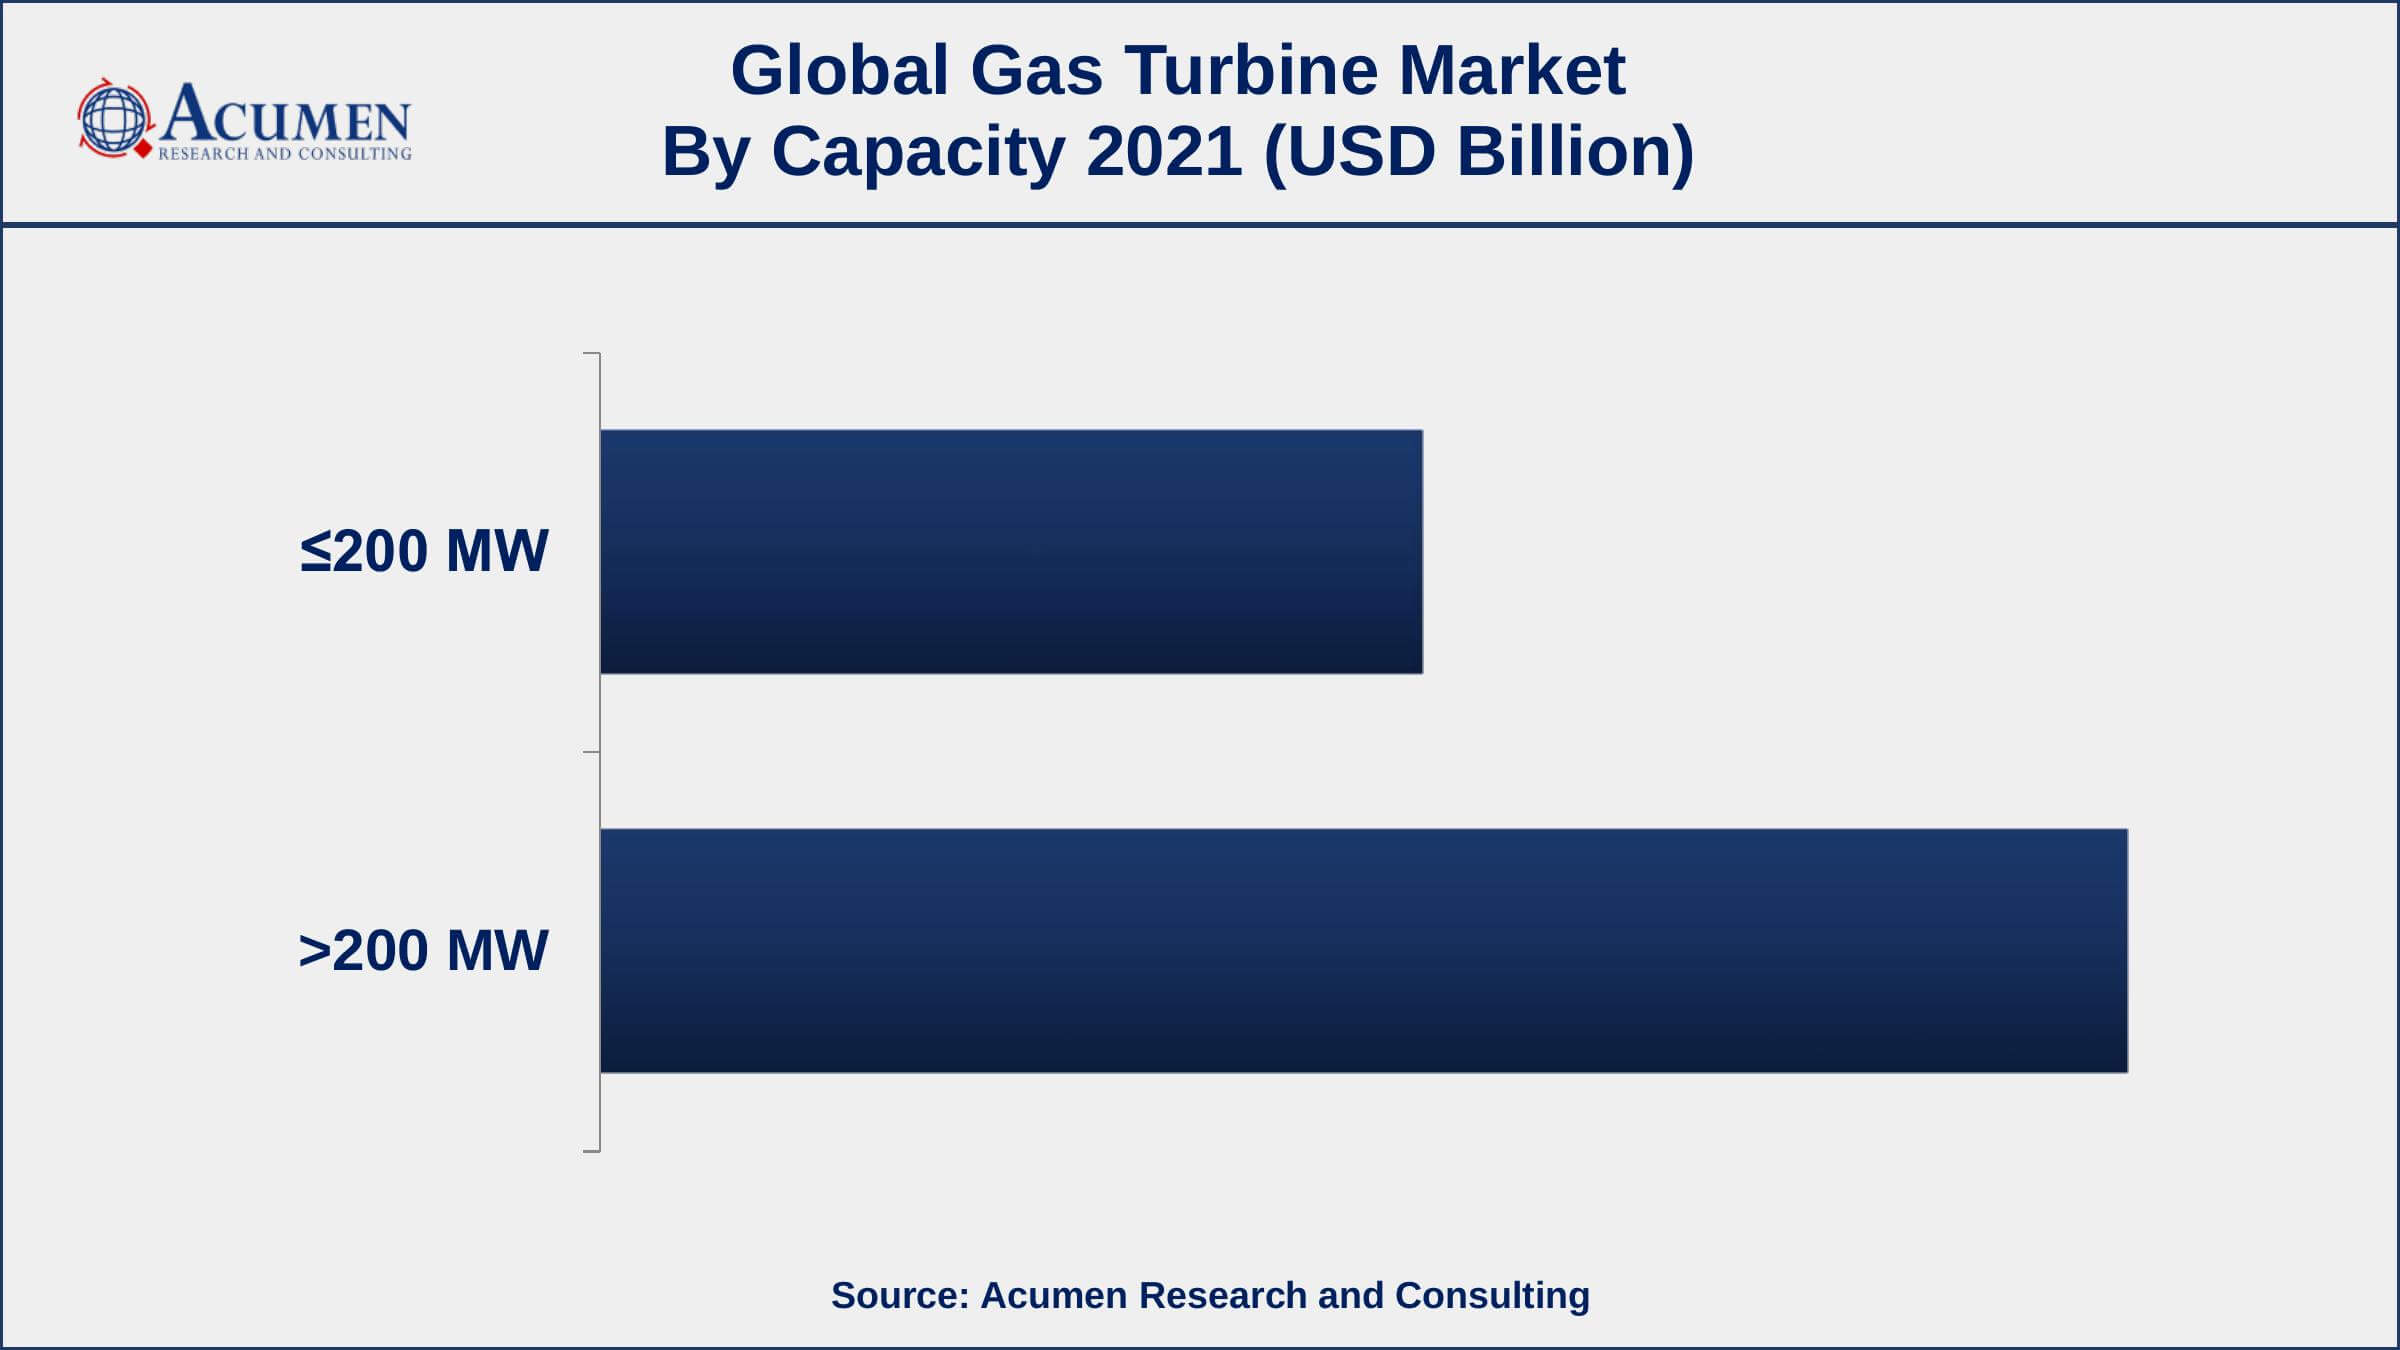
A gas turbine industry analysis found that the >200 MW capacity segment dominated the market in 2021. During the forecast timeframe, it is expected to become the fastest-growing segment. Increasing power generation activities around the globe, as well as the transition of a number of the world's major nations from coal to gas-based power stations, are increasing demand in this segment.
Gas Turbine Market By Technology
- Open Cycle
- Combined Cycle
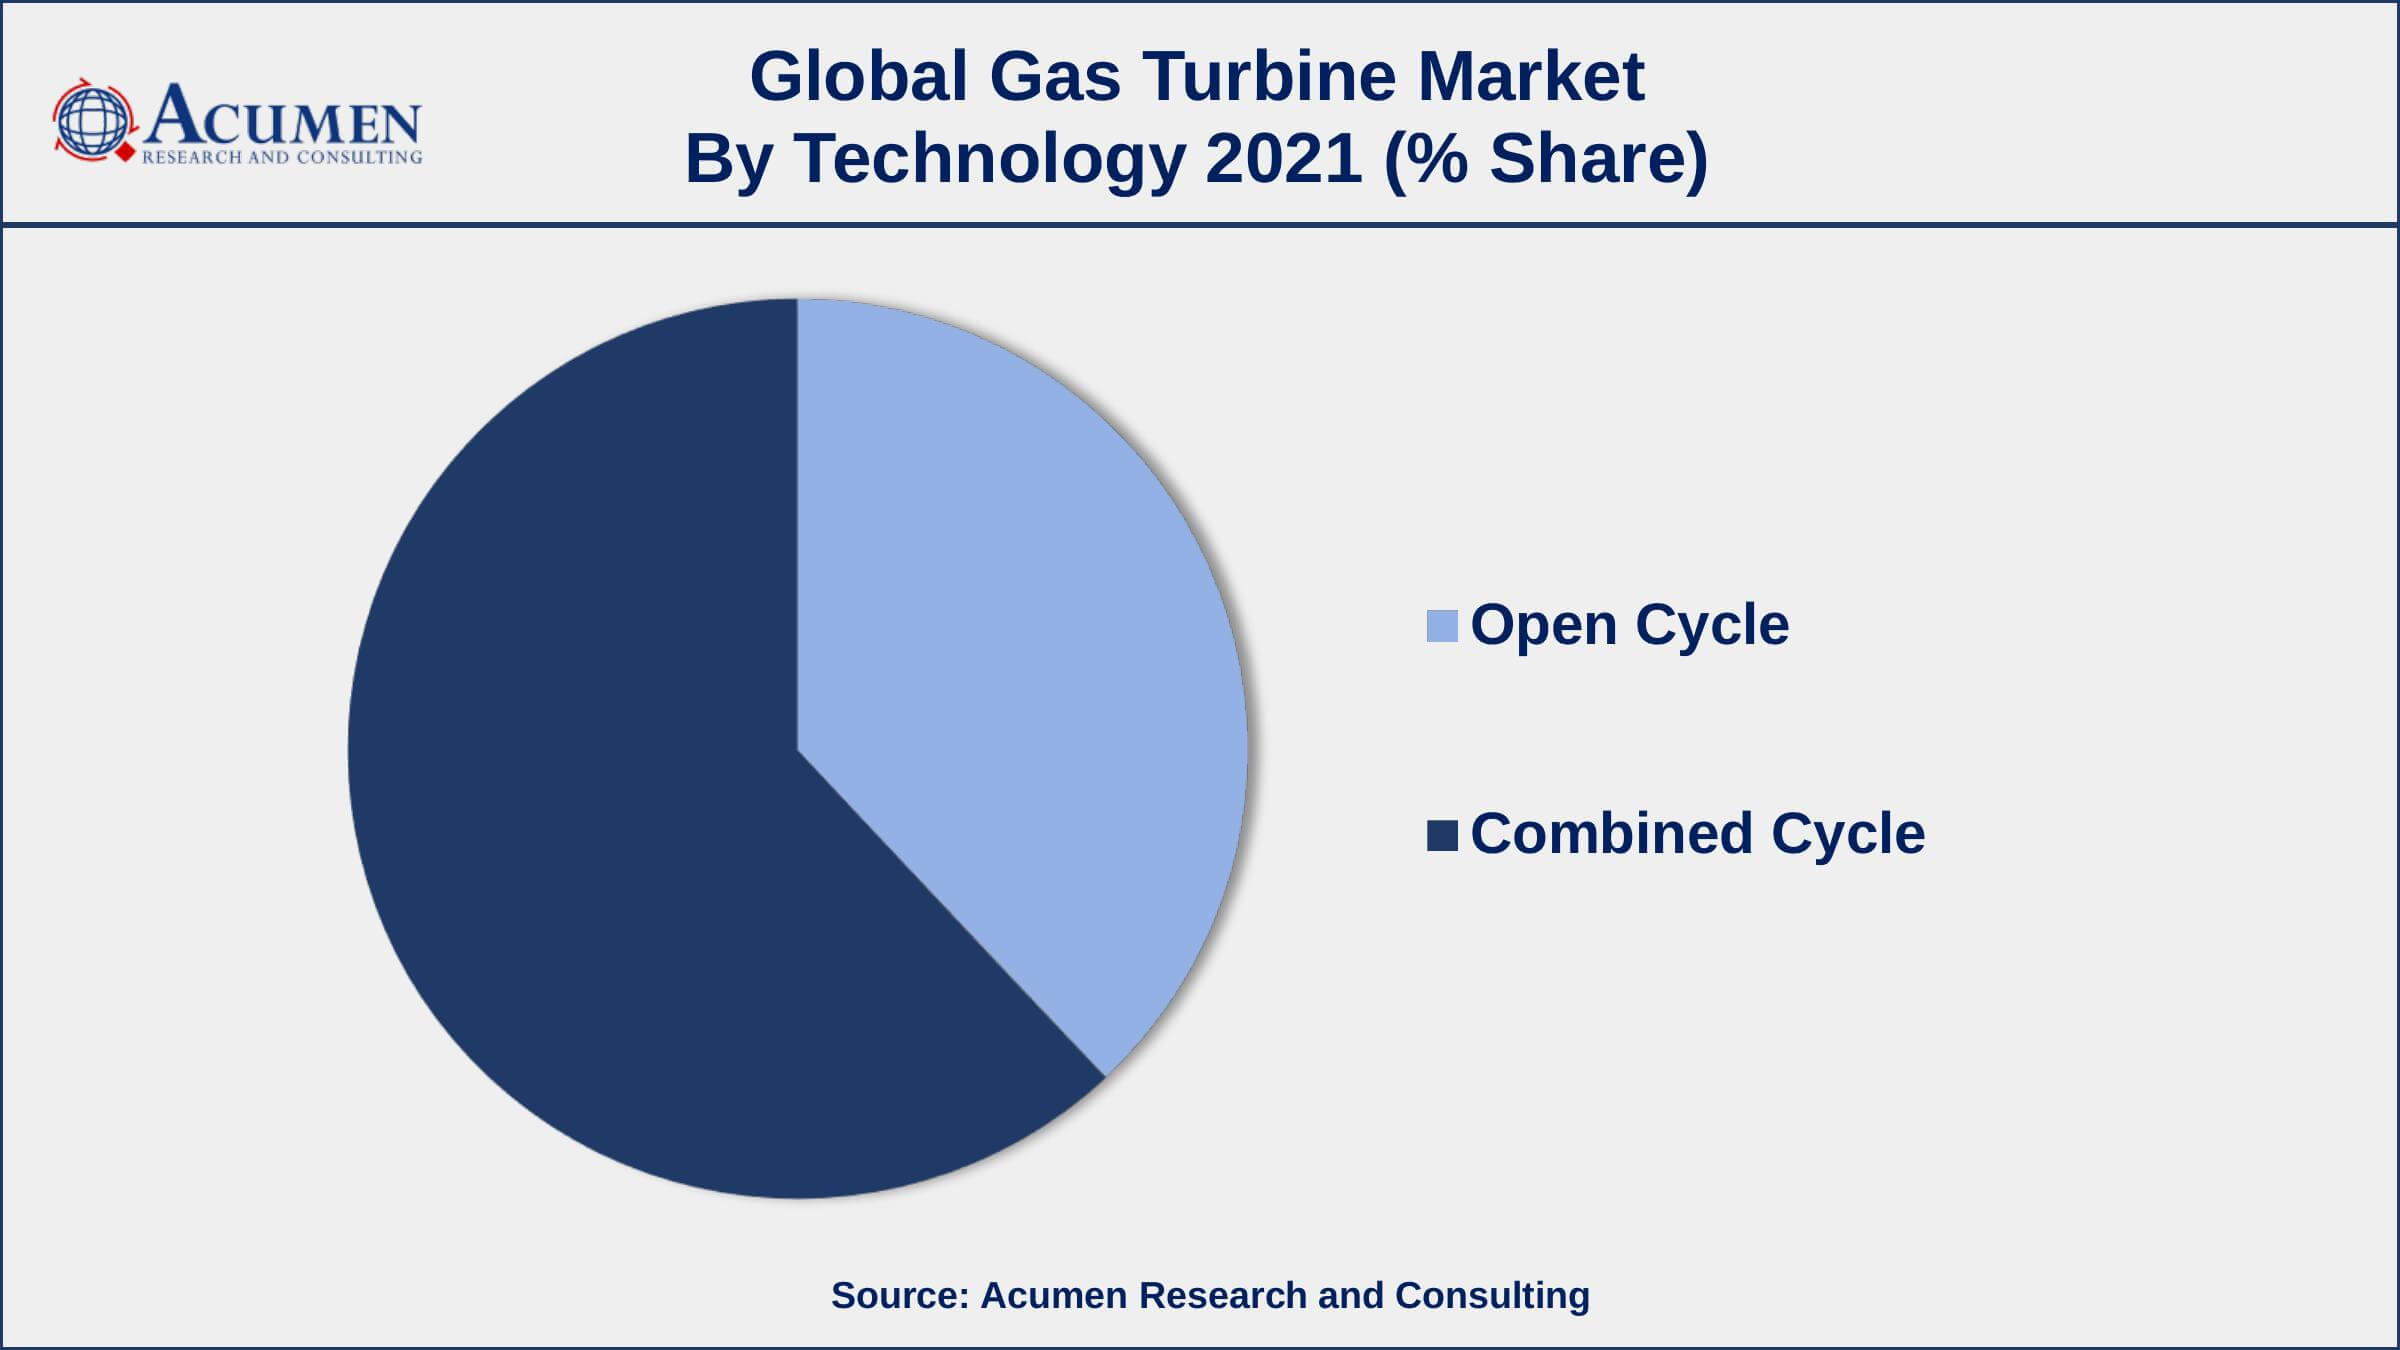
In terms of technology, the mixed-cycle turbines segment held a considerable market share in 2021. In the following years, this technology area is predicted to grow at a quicker rate. Those same turbines use much less gasoline to generate the same amount of electricity as traditional turbines and avoid losses in transmission and distribution. Combined cycle turbines are well-known for their efficiency, with systems achieving performances of 60 to 80%.
Gas Turbine Market By Application
- Power Generation
- Aviation
- Industrial
According to the gas turbine market forecast, the power generation segment led the market and is predicted to increase significantly in the following years. Increased demand for electricity production is being driven by worldwide population growth and urbanization, which is increasing the use of gas turbine engines in the electricity and utility sectors. The emphasis on producing an environmentally acceptable method of electricity generation is another major motivator for the gas turbine business in the industry of electricity generation.
Gas Turbine Market Regional Outlook
North America
- U.S.
- Canada
Europe
- U.K.
- Germany
- France
- Spain
- Rest of Europe
Asia-Pacific
- India
- Japan
- China
- Australia
- South Korea
- Rest of Asia-Pacific
Latin America
- Brazil
- Mexico
- Rest of Latin America
The Middle East & Africa
- South Africa
- GCC Countries
- Rest of the Middle East & Africa (ME&A)
North America and Europe Will See Significant Market Growth In The Coming Years
North America and Europe represent the biggest offer of power stations being decommissioned. This is due to the mainstream of the power plants being in the second period of their life cycle. In Europe, air contamination hardware of various plants that have not been updated was to be shut down by 2015. Maturing limits and authoritative activities made a potential substitution showcase. MEA is anticipated to emerge as the second biggest market in terms of orders and capacity additions. This region was esteemed at more than USD 5,000 million in 2017. Expanding requests can be credited to the rising inclination toward gas-fired combined cycle plants in the territorial oil and gas industry.
Gas Turbine Market Players
Some of the top gas turbine market companies offered in the professional report include Gas turbineare Zorya-Mashproekt, Harbin Electric International Company, General Electric, NPO Saturn, Siemens AG, Cryostar, Wartsila, Capstone Turbine, Mitsubishi Hitachi Power Systems, Man Diesel & Turbo, BHEL, Vericor Power Systems, Kawasaki Heavy Industries, Solar Turbines, and Opra Turbines.
Frequently Asked Questions
What is the size of global gas turbine market in 2021?
The estimated value of global gas turbine market in 2021 was accounted to be USD 25.5 Billion.
What is the CAGR of global gas turbine market during forecast period of 2022 to 2030?
The projected CAGR gas turbine market during the analysis period of 2022 to 2030 is 5.1%.
Which are the key players operating in the market?
The prominent players of the global gas turbine market are Gas turbineare Zorya-Mashproekt, Harbin Electric International Company, General Electric, NPO Saturn, Siemens AG, Cryostar, Wartsila, Capstone Turbine, Mitsubishi Hitachi Power Systems, Man Diesel & Turbo, BHEL, Vericor Power Systems, Kawasaki Heavy Industries, Solar Turbines, and Opra Turbines.
Which region held the dominating position in the global gas turbine market?
Asia-Pacific held the dominating gas turbine during the analysis period of 2022 to 2030.
Which region registered the fastest growing CAGR for the forecast period of 2022 to 2030?
North America region exhibited fastest growing CAGR for gas turbine during the analysis period of 2022 to 2030.
What are the current trends and dynamics in the global gas turbine market?
Increasing demand for natural gas-fired power stations and rising demand for electricity drives the growth of global gas turbine market.
By technology segment, which sub-segment held the maximum share?
Based on technology, combined cycle segment is expected to hold the maximum share of the gas turbine market.


