Flexible Electronics Market Size - Global Industry, Share, Analysis, Trends and Forecast 2022 - 2030
Published :
Report ID:
Pages :
Format :
Flexible Electronics Market Size - Global Industry, Share, Analysis, Trends and Forecast 2022 - 2030
Report Coverage
- Industry Dynamics
- Market Size and Forecast Data
- Segment Analysis
- Competitive Landscape
- Regional Analysis with a Niche Focus on Country-Level Data
- High Level Analysis - Porter's, PESTEL, Value Chain, etc.
- Company Profiles of Key Players
- Option to Customize the Report As Per Your Specific Need
Request Sample Report
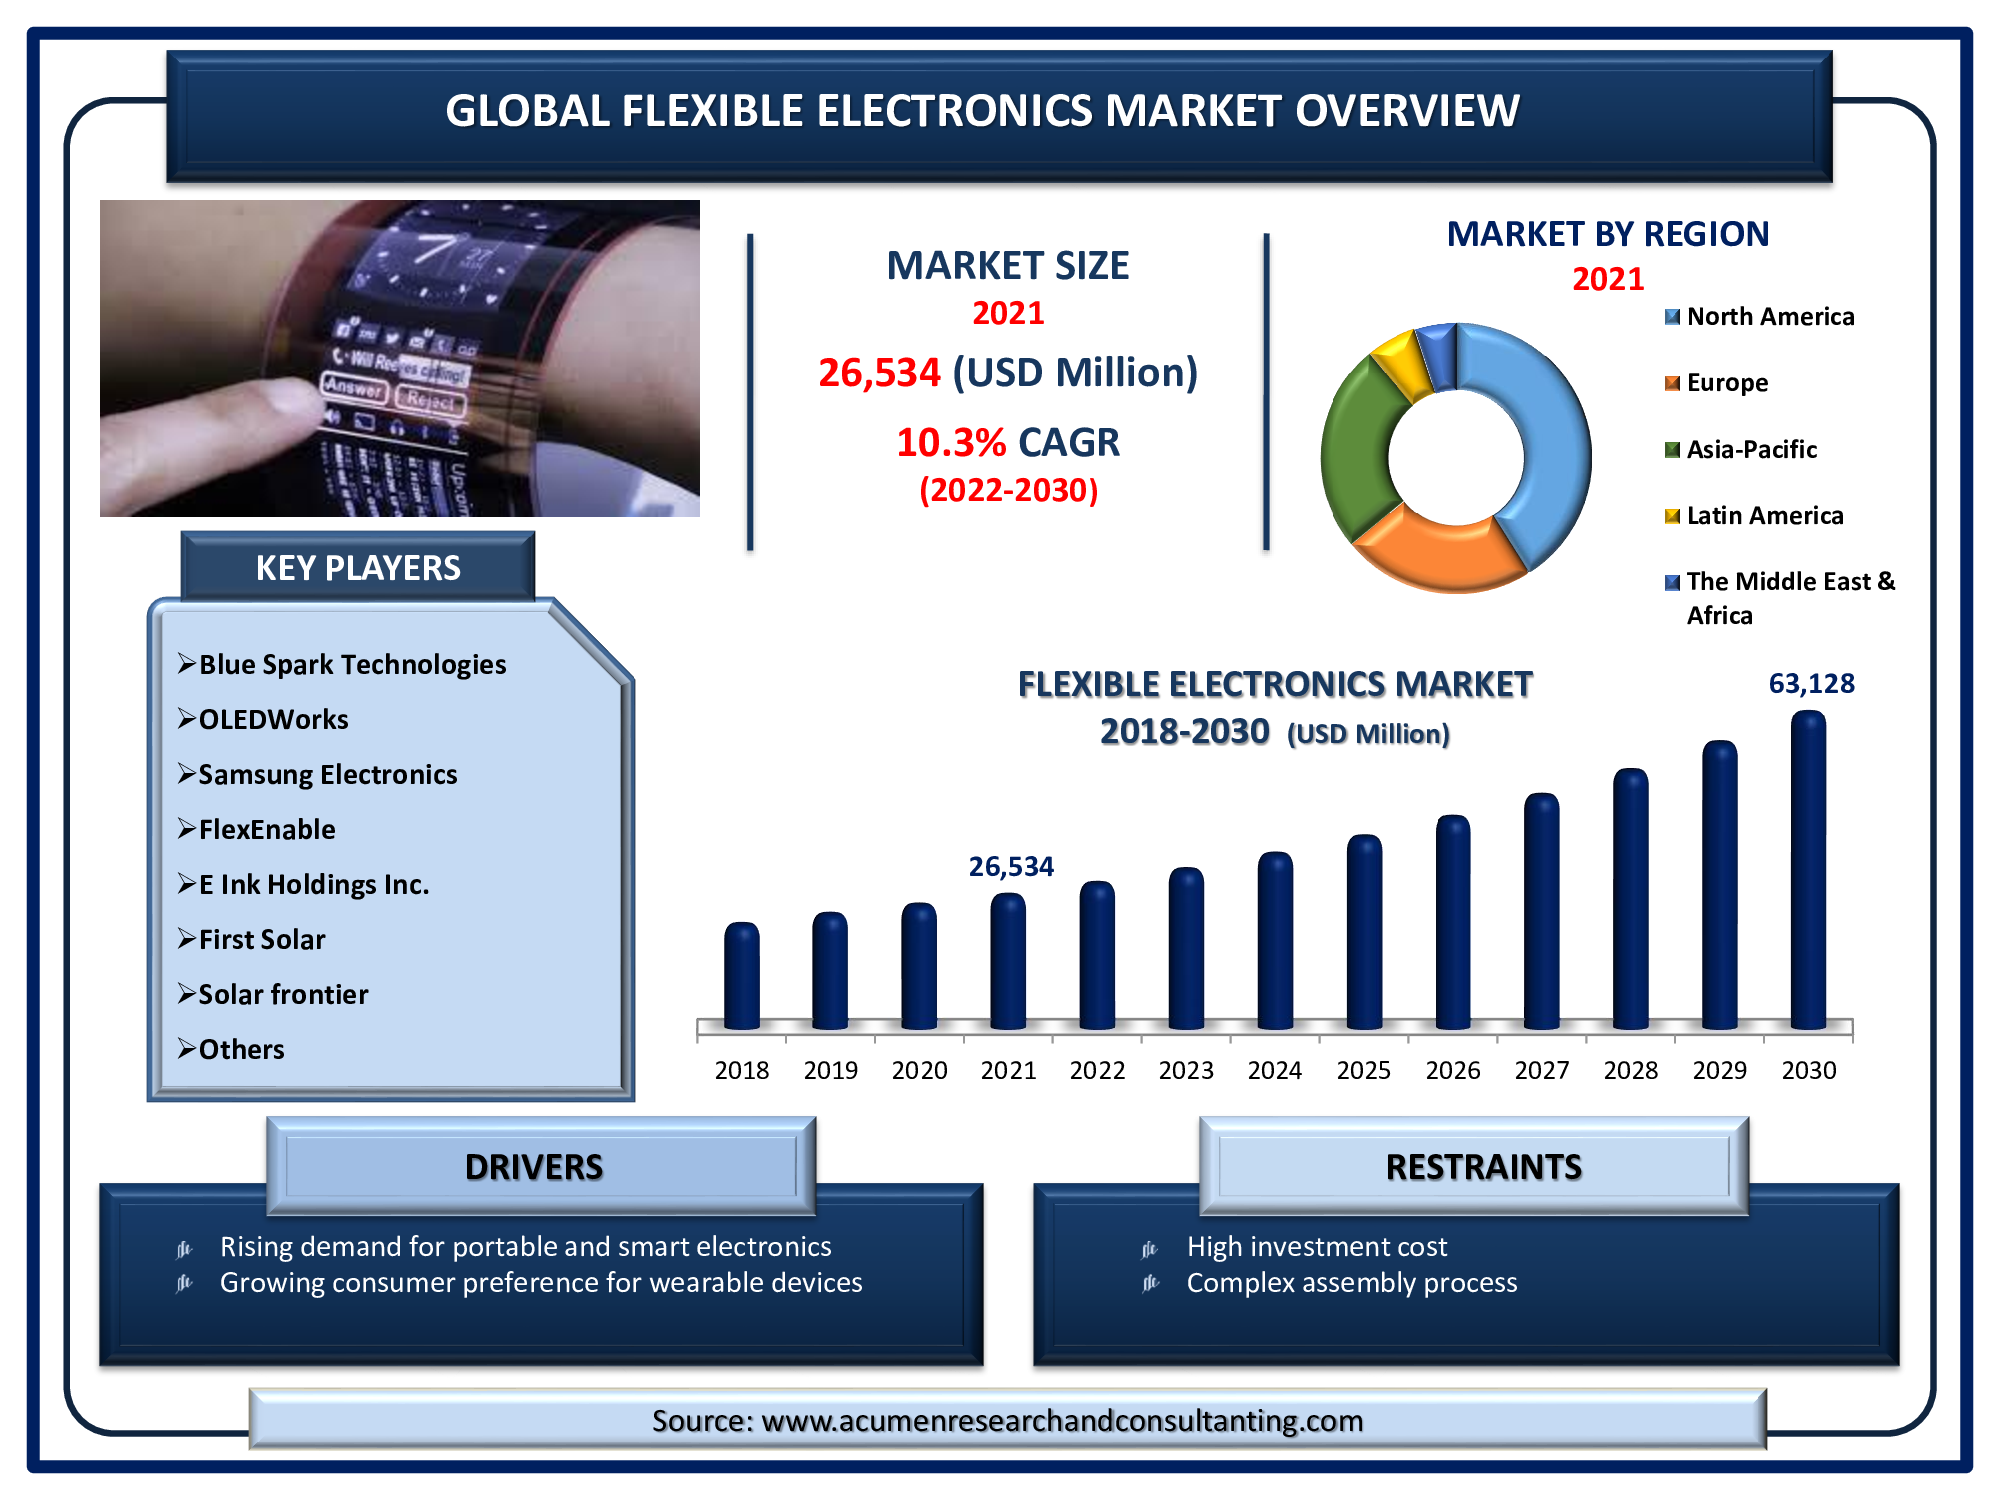
The global flexible electronics market size accounted for US$ 26,534 Mn in 2021 and is estimated to reach US$ 63,128 Mn by 2030, with a CAGR of 10.3% from 2022 to 2030.
Flexible electronics is the technology for arranging electronic circuitry by mounting the electronic devices on a platform of flexible substrates such as PEEK (Polyether Ether Ketone), polyimide or transparent conductive polyester film. Flexible electronics is more flexible and unbreakable so it is preferred for the small electronics devices which make it easy to mount a circuit in the small devices. Integrating a rigid active plastic display can be achieved in flexible electronics. Flexible electronics have witnessed considerable growth in the last few years, ranging from the extensive applications in flexible OLED electronics and flexible solar cell arrays which are made-up on a plastic substrate. Flexible circuits are simpler to assimilate into the end product and also tend to be lesser in weight. Their demand is stimulated by constant technological development in the field of electronics. Furthermore, the surging demand for smart and lightweight wearable devices is the current trend in the flexible electronics market.

Market Growth Drivers:
- Rising demand for portable and smart electronics
- Increasing employment of flexible electronic components for IoT applications
- Growing consumer preference for wearable devices
Market Restraint:
- High investment cost
- Complex assembly process
Market Opportunities:
- Continuous technological development
- Rising implementation of flexible electronics for healthcare applications
Market Dynamics
The growing awareness regarding the benefits of using flexible electronics in diverse applications is one of the key factors predicted to promote the growth of global market in near future. The rising use of thin-film solar modules and growing acceptance of wearable devices and smartphones are anticipated to drive the global market. Conversely, the existence of recognized substitutes like inflexible products is likely to act as a factor restraining the global flexible electronics market. Additionally, the flexible printed circuits are designed and made for particular application, the price of circuit design, photographic plate, and wiring is high. Moreover, flexible electronics is the latest technology, so it has a quite difficult manufacturing process which is time consuming and expensive. On the other hand, the increasing need for improvements in terms of technology for a wider end use adoption such as defense and healthcare sector is projected to offer lucrative opportunities in near future. The increasing government support for renewable energy projects and lighting technologies are expected to tender promising opportunities for the market players. Furthermore, rising implementation of flexible devices in healthcare applications is going to be a significant factor that will boost the flexible electronics market revenue in the coming years.
Flexible Electronics Market Segmentation
Type, application, and geography are all used to segment the worldwide flexible electronics market.
Flexible Electronics Market by Type
- Flexible Battery
- Flexible Sensors
- Flexible Display
- Flexible Memory
- Others

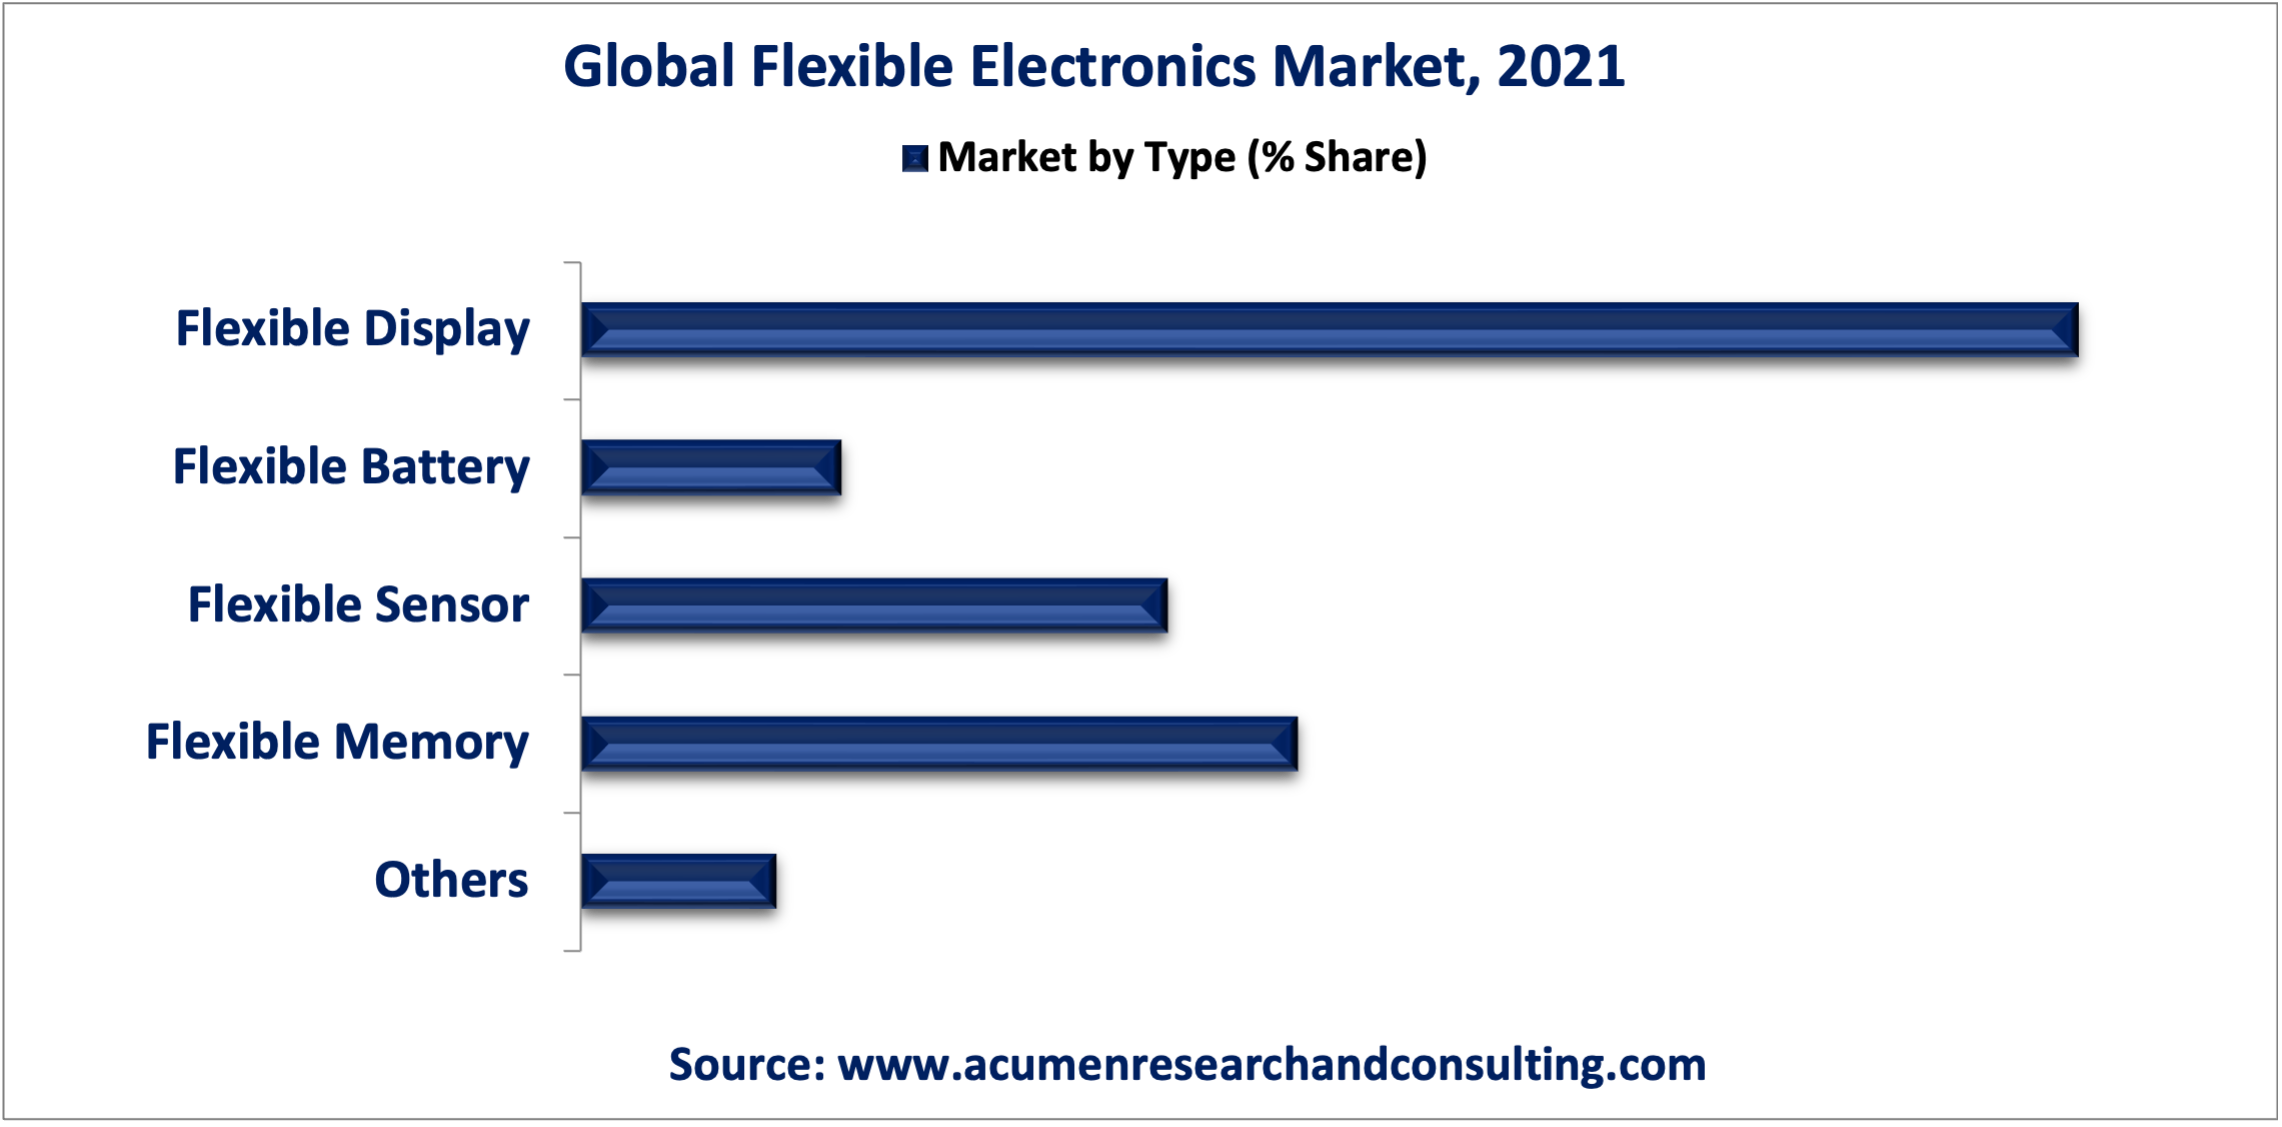
On the basis of type, the flexible display segment achieved maximum flexible electronics market share in 2021. A strong penetration of smartphones, tablets, notebooks, desktops and e-readers will fuel demand in the next 8 years. It is expected that growth in this segment will benefit from features like electricity efficiency and rapid micro-second pixel switching speeds. In the future, demand for flexible display panels, particularly OLED display panels, is expected to rise. Apple and Samsung have begun to incorporate flexible OLED displays into their flagship devices, such as the iPhone X and XS series as well as the Samsung Galaxy S and Note series.
Market by Application
- Consumer Electronics
- Healthcare
- Automotive
- Energy & Power
- Industrial
- Defense
- Others

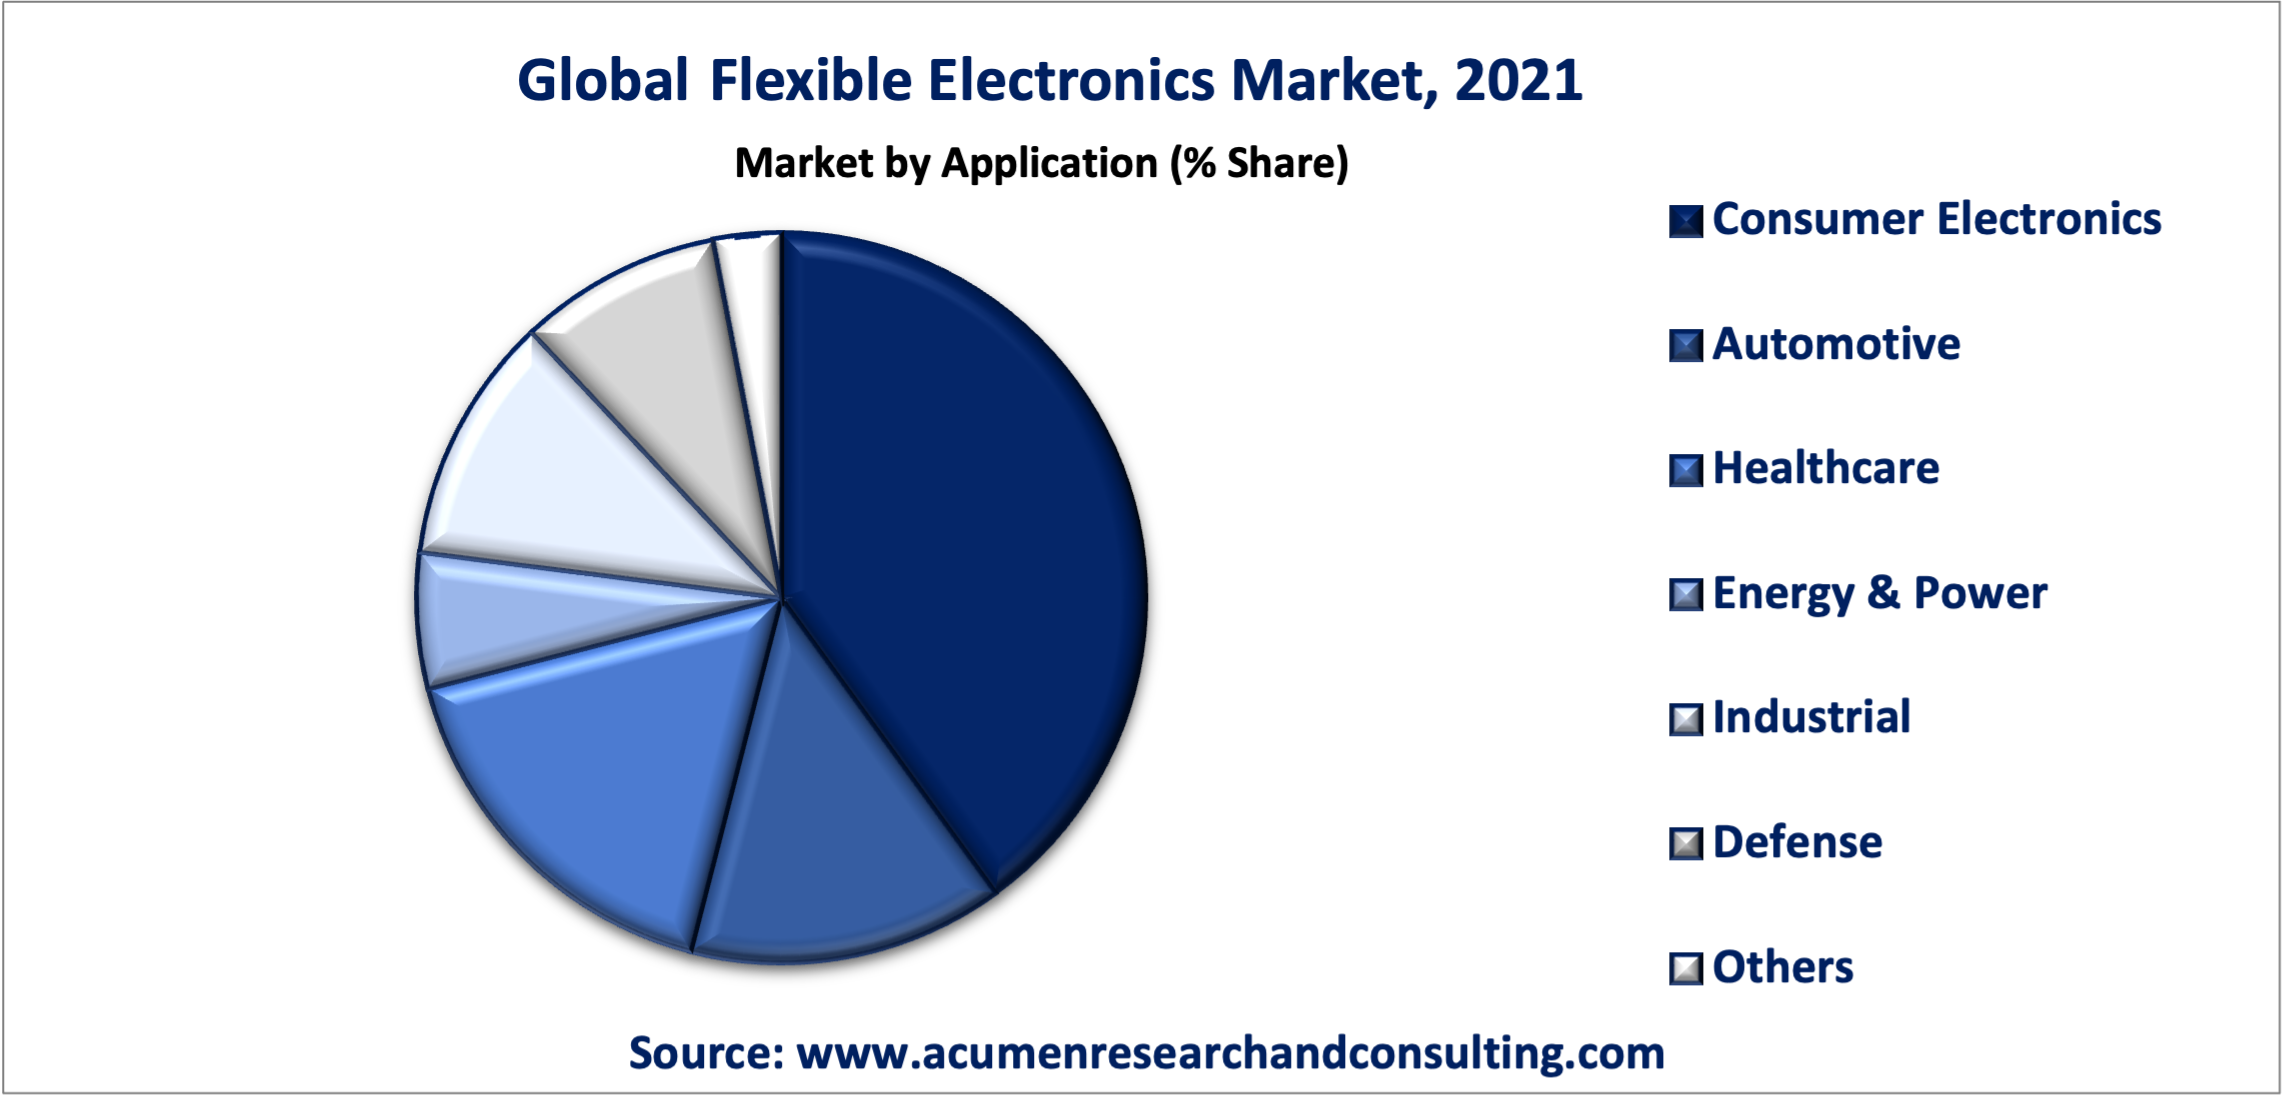
In 2021, consumer electronics generated the maximum revenue in the application segment and is expected to continue its trend over the forecast timeframe from 2022 to 2030. It is primarily due in smart watches, laptops, e-papers, e-books, etc. to the widespread application of this technology. Additionally, in 2021, the automotive industry accounted for more than 16% of total sales and is projected to see steady growth over the next nine years. It is expected that the technology will revolutionize car designs, from the dashboard to the center console. On the other hand, healthcare industry is expected to attain the fastest CAGR throughout the projected years. The increasing prevalence of diseases and the growing geriatric population are major factors encouraging the implementation of intelligent and innovative devices that stimulates the growth of flexible electronics throughout the healthcare industry.
Flexible Electronics Market Regional Overview
North America
- U.S.
- Canada
Europe
- U.K.
- Germany
- France
- Spain
- Rest of Europe
Latin America
- Mexico
- Brazil
- Rest of Latin America
Asia-Pacific
- India
- Japan
- China
- Australia
- South Korea
- Rest of Asia-Pacific
Middle East & Africa (MEA)
- Gulf Cooperation Council (GCC)
- South Africa
- Rest of the Middle East & Africa
The growing preference for smart wearable devices boosts the North America Flexible Electronics market growth
According to regional analysis, North America accounted for the majority of the global flexible electronics market share and is expected to grow significantly in the forecast period. The region is characterized by the presence of numerous research universities involved with technology-related topics in research projects. In addition, several key players with process technologies, competencies, equipment and intellectual property related to flexible electronics are expected to fuel regional market growth over the forecast period. Increasing consumer spending, positive economic outlook, and rising demand for consumer electronics are the key drivers for the flexible electronic market in this region.
However, the presence of Asian companies in the region would be a challenge for regional manufacturers. It is estimated that Asia-Pacific will witness a more than 10% CAGR from 2022 to 2030. It can be due to the presence of segments that are reliably important to the development of flexible electronic devices of several large industrial groups with specific manufacturing capabilities.
Competitive Landscape
Innovative methods that enable new applications, for example wireless sensors for zero power and smart building power management, agriculture field monitoring/reporting devices and information logger delivery in an effort to obtain competitive advantage are included in prominent industry members.
The key flexible electronics companies involved in market are Blue Spark Technologies, OLEDWorks, Samsung Electronics, FlexEnable, E Ink Holdings Inc., First Solar, Solar frontier, Konica Minolta, LG Electronics, Front Edge Technologies, and Multi-Fineline Electronix, Inc.
Electronics businesses are affected by regulations. Companies must factor such costs into expenditures and pay major penalties for non-compliance. The sector is also regulated by other nations at different rates. Some nations have little or no regulations for the electronics sector and others are regulating emissions and the effect on the environment.
Frequently Asked Questions
What is flexible electronics?
Flexible electronics is the technology for assembling electronic circuits by mounting the electronic devices on a platform of flexible substrates such as PEEK (Polyether Ether Ketone), polyimide or transparent conductive polyester film.
What is the main driver of flexible electronics market?
The growing awareness regarding the benefits of using flexible electronics in diverse applications is main driver of the flexible electronics market.
What will be the market value of flexible electronics in the forecast period 2022 to 2030?
According to Acumen Research and Consulting, the flexible electronics market value is anticipated to be worth around US$ 63.1 billion in 2030.
How much is the CAGR of flexible electronics market during the forecast period 2022 to 2030?
The flexible electronics market is anticipated to grow over 10.3% CAGR during the forecast period 2022 to 2030.
Which region held the maximum share of the flexible electronics market?
North America held maximum share in 2020 for flexible electronics market.
Which region is projected to grow at a fastest rate during the forecast period?
Asia Pacific is projected to grow at a fast pace during forecast period in the flexible electronics market.
Which are the top key players operating in the flexible electronics market?
The prominent players of the global flexible electronics market involve include Blue Spark Technologies, OLEDWorks, Samsung Electronics, FlexEnable, E Ink Holdings Inc., First Solar, Solar frontier, Konica Minolta, LG Electronics, Front Edge Technologies, and Multi-Fineline Electronix, Inc.


