Flavored and Functional Water Market Size - Global Industry, Share, Analysis, Trends and Forecast 2023 - 2032
Published :
Report ID:
Pages :
Format :
Flavored and Functional Water Market Size - Global Industry, Share, Analysis, Trends and Forecast 2023 - 2032
Report Coverage
- Industry Dynamics
- Market Size and Forecast Data
- Segment Analysis
- Competitive Landscape
- Regional Analysis with a Niche Focus on Country-Level Data
- High Level Analysis - Porter's, PESTEL, Value Chain, etc.
- Company Profiles of Key Players
- Option to Customize the Report As Per Your Specific Need
Request Sample Report
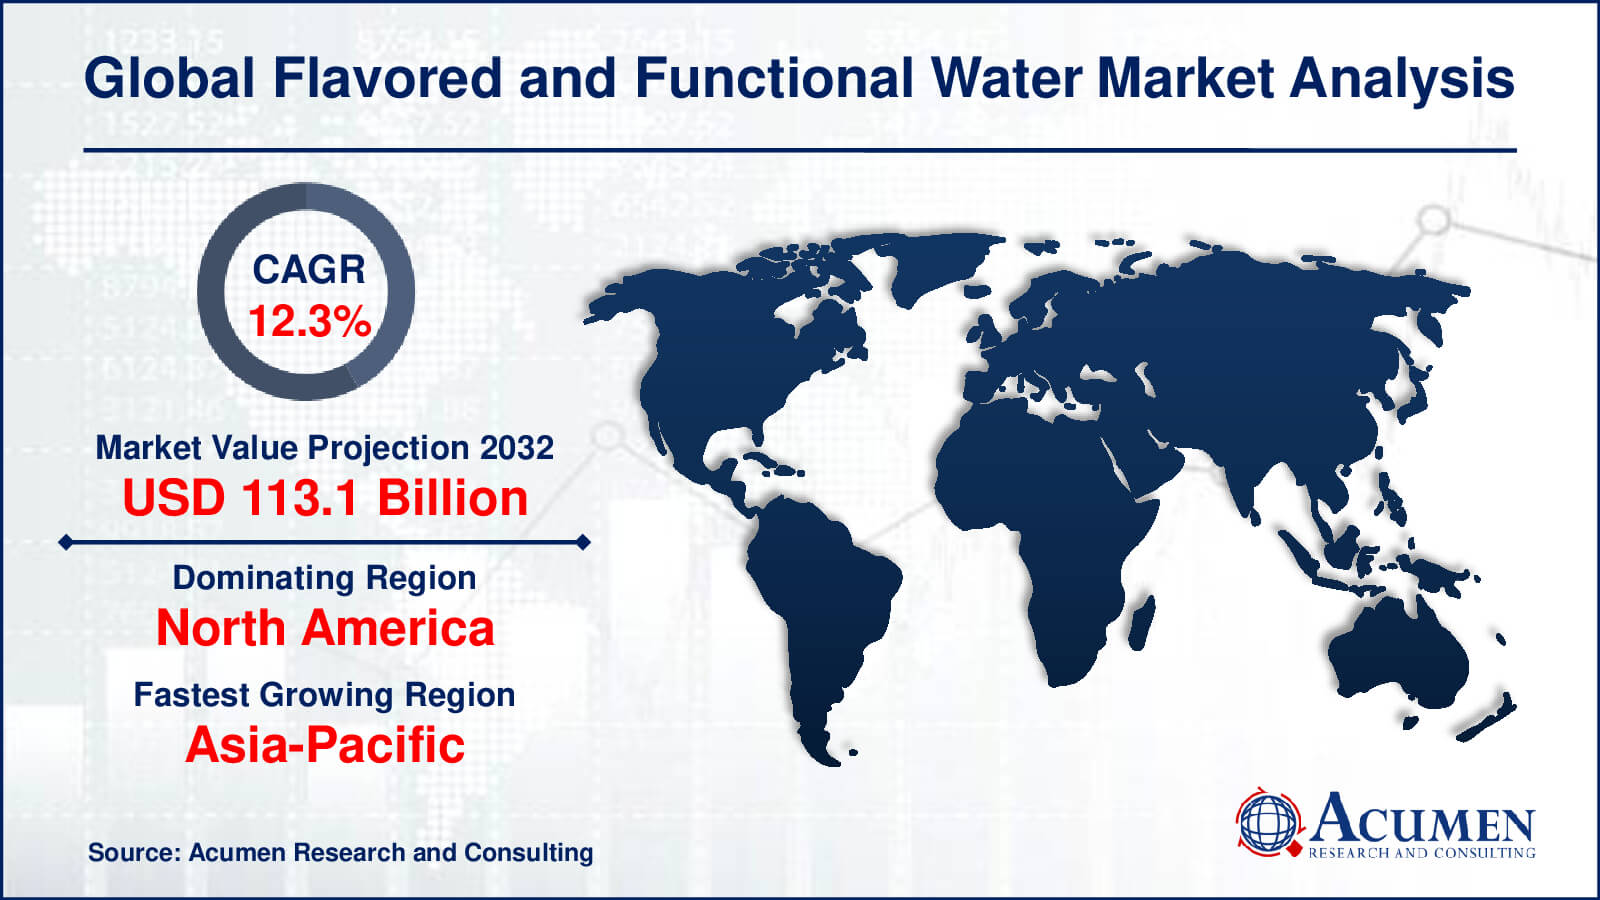
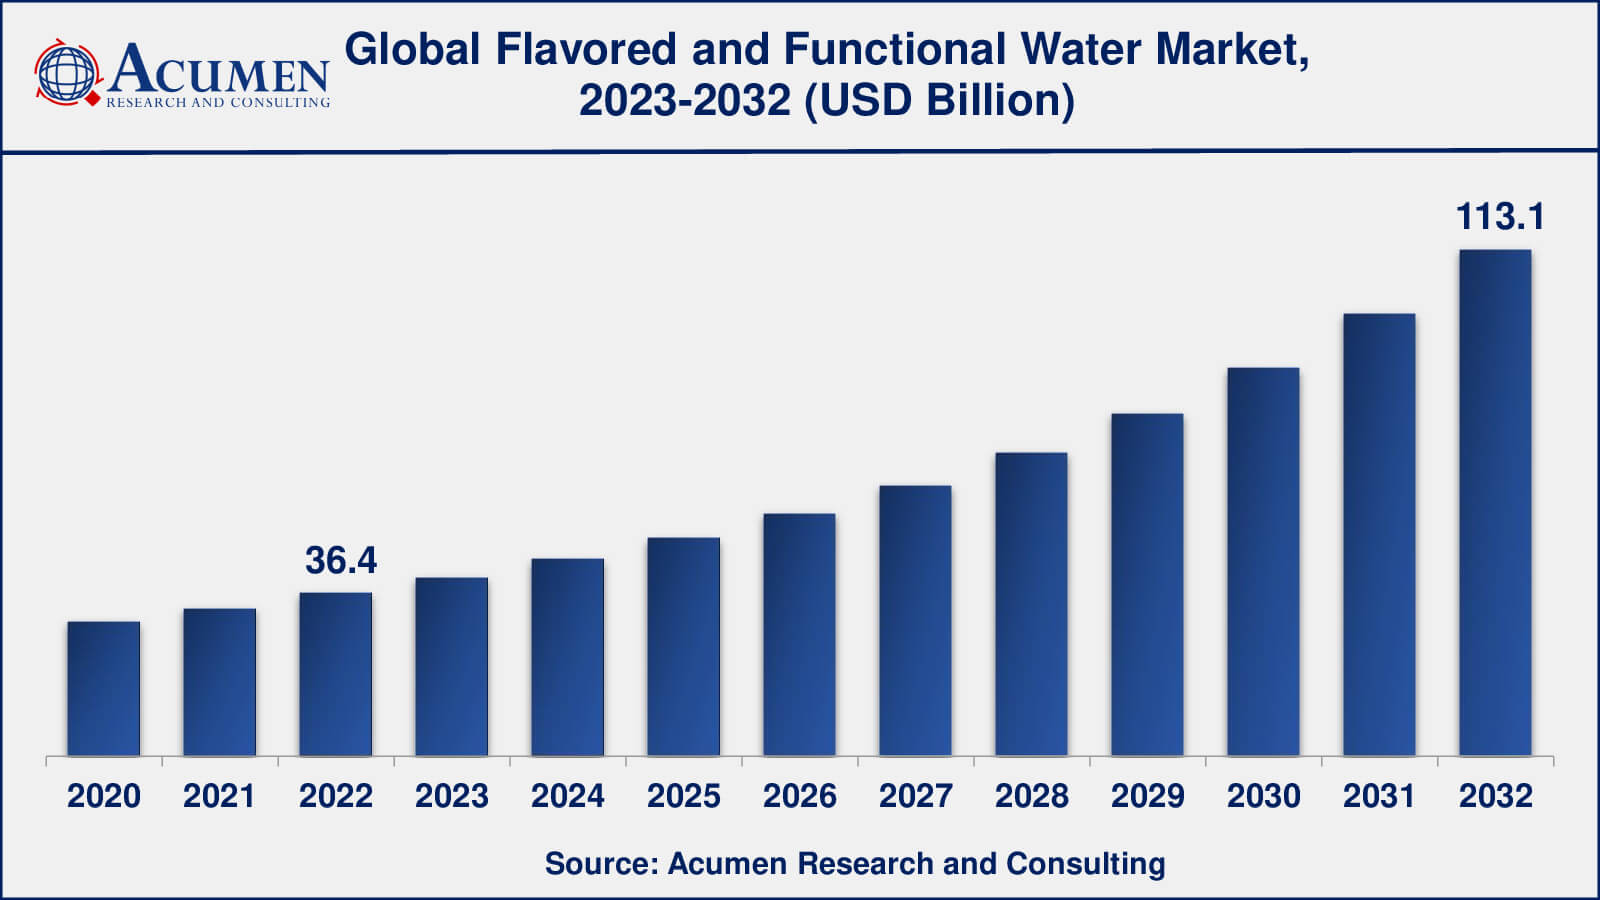
The Global Flavored and Functional Water Market Size accounted for USD 36.4 Billion in 2022 and is estimated to achieve a market size of USD 113.1 Billion by 2032 growing at a CAGR of 12.3% from 2023 to 2032.
Flavored and Functional Water Market Key Highlights
- Global flavored and functional water market revenue is poised to garner USD 113.1 Billion by 2032 with a CAGR of 12.3% from 2023 to 2032
- North America flavored and functional water market value occupied more than USD 13.8 billion in 2022
- Asia-Pacific flavored and functional water market growth will record a CAGR of around 13% from 2023 to 2032
- Among product, the flavored water sub-segment generated around 62% share in 2022
- Based on distribution channel, the retail sales sub-segment generated around US$ 20 billion revenue in 2022
- Emergence of new flavors and ingredients is popular flavored and functional water market trend that fuels the industry demand
Increasing consciousness towards health among consumers across the globe is boosting the popularity of better alternatives to simple food & beverages which they generally consume. Flavored and functional water comes under the category of healthy alternatives of beverages whereas flavored water is purified, spring water, or bottled mineral. Functional water is its derivative along with added functional values such as minerals, oxygen, botanicals, and vitamins. Flavored and functional water comes under the category of beverages that are marketed in similar terms to water. Although, it contains some additional elements including sweeteners and natural or flavors vitamins. The global functional and flavored market concentrates on a healthy image attached to functional benefits and perceived health. Flavored water contains mineral water in combination with several fruit juices including blackberry, pineapple, apple, mango, orange, and strawberry among others along with natural or artificial sweeteners. On the other hand, functional water comes from flavored water and is made by using multiple ingredients such as vitamins, minerals, herbs, vegetables, raw fruit, and oxygen. These antioxidants and additives furnish added nutritional benefits and value to the functional water.
Global Flavored and Functional Water Market Dynamics
Market Drivers
- Increasing health consciousness
- Rising demand for low-calorie and low-sugar beverages
- Availability of a variety of flavors and functional ingredients
- Growing demand for convenience
Market Restraints
- Competition from other beverage categories
- Availability of tap water
- Regulatory issues
Market Opportunities
- Growing demand for natural and organic products
- Increasing focus on immune-boosting ingredients
- Rising popularity of CBD-infused water
Flavored and Functional Water Market Report Coverage
| Market | Flavored and Functional Water Market |
| Flavored and Functional Water Market Size 2022 | USD 36.4 Billion |
| Flavored and Functional Water Market Forecast 2032 | USD 113.1 Billion |
| Flavored and Functional Water Market CAGR During 2023 - 2032 | 12.3% |
| Flavored and Functional Water Market Analysis Period | 2020 - 2032 |
| Flavored and Functional Water Market Base Year | 2022 |
| Flavored and Functional Water Market Forecast Data | 2023 - 2032 |
| Segments Covered | By Product, By Distribution Channel, And By Geography |
| Regional Scope | North America, Europe, Asia Pacific, Latin America, and Middle East & Africa |
| Key Companies Profiled | New York Spring Water, Nestle S.A., PepsiCo, Hint, Inc., Groupe Danone, The Coca-Cola Company, Kraft Foods, Hint Water, Sunny Delight Beverages Company, and Balance Water Company. |
| Report Coverage |
Market Trends, Drivers, Restraints, Competitive Analysis, Player Profiling, Covid-19 Analysis, Regulation Analysis |
Flavored and Functional Water Market Insights
Rising consumer awareness and health concerns are leading to the demand for healthy alternatives such as flavored and functional water as compared to artificial or carbonated soft drinks. The most commonly used flavored and functional water contains guava, cherry, peach, lemon, apple, and mixed flavors. Flavored and functional water does not contain any preservatives, caffeine, colors, or carbonation. Thus, flavored and functional water products are rapidly gaining popularity among consumers of all age groups. Other aerated drinks including fizzy drinks, cola, and soda contain carbon dioxide, which causes several side effects like weight gain which leads to diabetes, and high calories, among others. On the other hand, non-aerated drinks are non-carbonated and pose a lot of nutritional benefits. The supply of polluted water in the industrial sector has led to an increase in demand for flavored and functional water. In addition, the ingredients of functional water address calcium and heart absorption and reduce cholesterol.
Growing awareness towards healthy lifestyles among the population in developed countries along with the rising prevalence of obesity are some key factors anticipated to drive the growth of the flavored and functional water market during the forecast period. Functional water is gaining popularity due to its reduced switching costs and health benefits. Moreover, the increasing availability of flavored water and increasing options in flavored and functional water is another major factor anticipated to boost the overall growth of the global flavored and functional water market. In addition, since consumers generally prefer to opt for new tastes in flavored water, companies are focusing on innovations in product development. However, the high cost of flavored and functional water is the key reason hampering the market growth.

Flavored and Functional Water Market Segmentation
The worldwide market for flavored and functional water is split based on product, distribution channel, and geography.
Flavored and Functional Water Products
- Flavored
- Functional
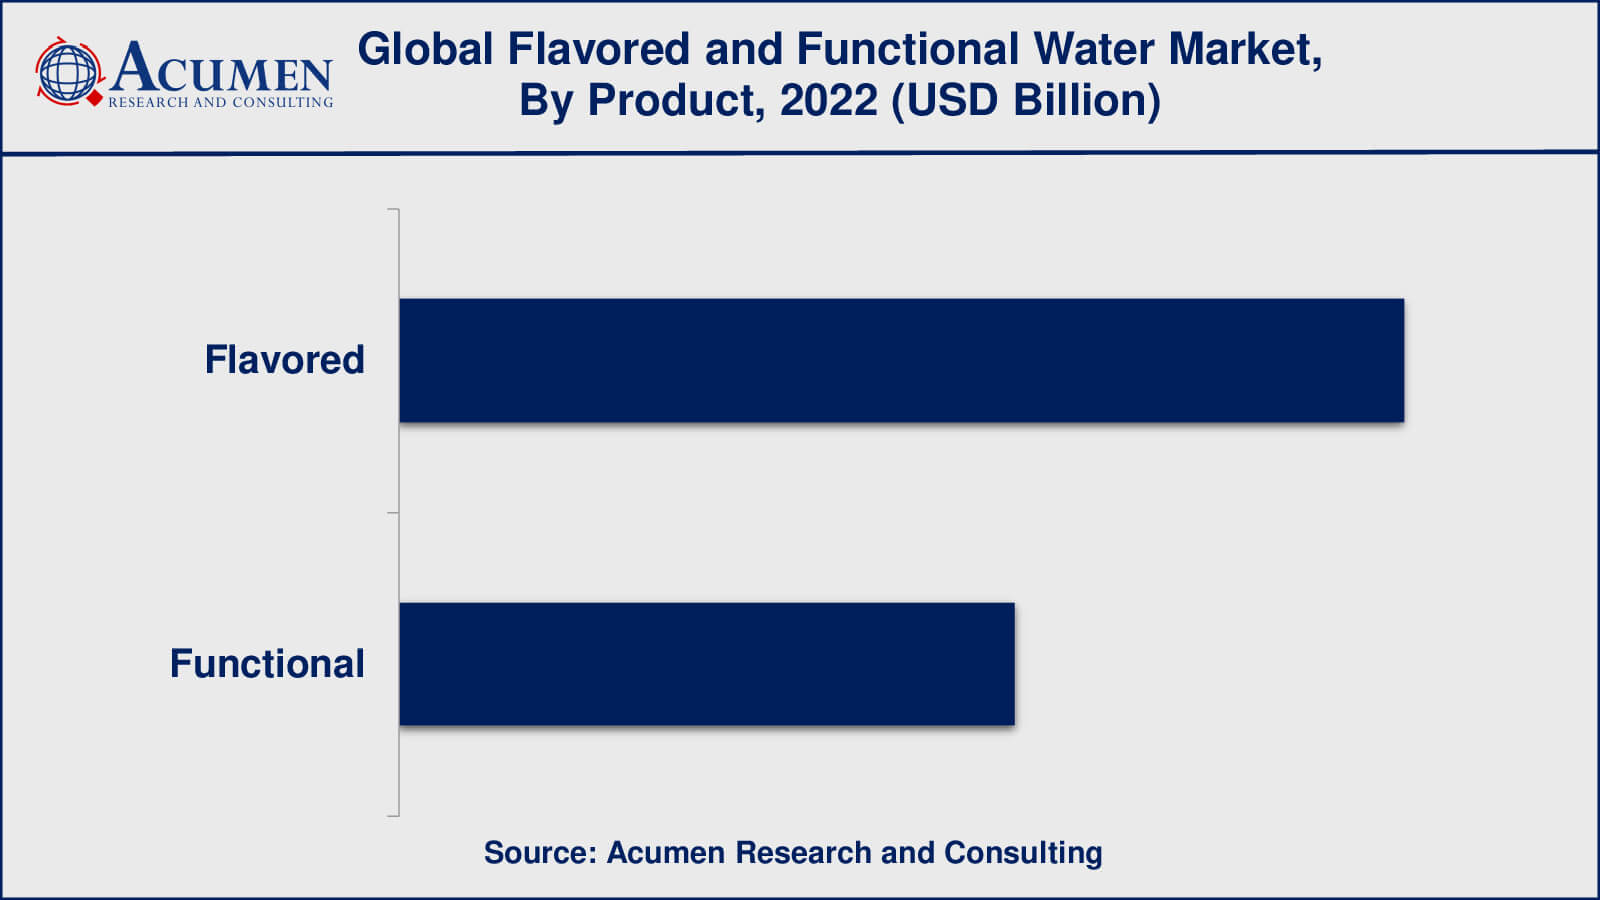
According to the flavored and functional water industry analysis, the flavored water products have a larger market share because they appeal to a broader consumer base, including those looking for a refreshing and tasty alternative to plain water. Flavored water products come in a variety of flavors, including fruit flavors, herbal flavors, and exotic flavors, to appeal to a wide range of tastes and preferences.
Functional water products, on the other hand, are becoming increasingly popular among health-conscious consumers seeking added benefits such as vitamins, minerals, electrolytes, and antioxidants. These products are very often marketed as a healthier alternative to conventional sugary drinks and energy drinks, that are perceived to be less healthy.
Flavored and Functional Water Distribution Channels
- Supermarket & Hypermarket
- Convenience Store
- Online Store
- Others
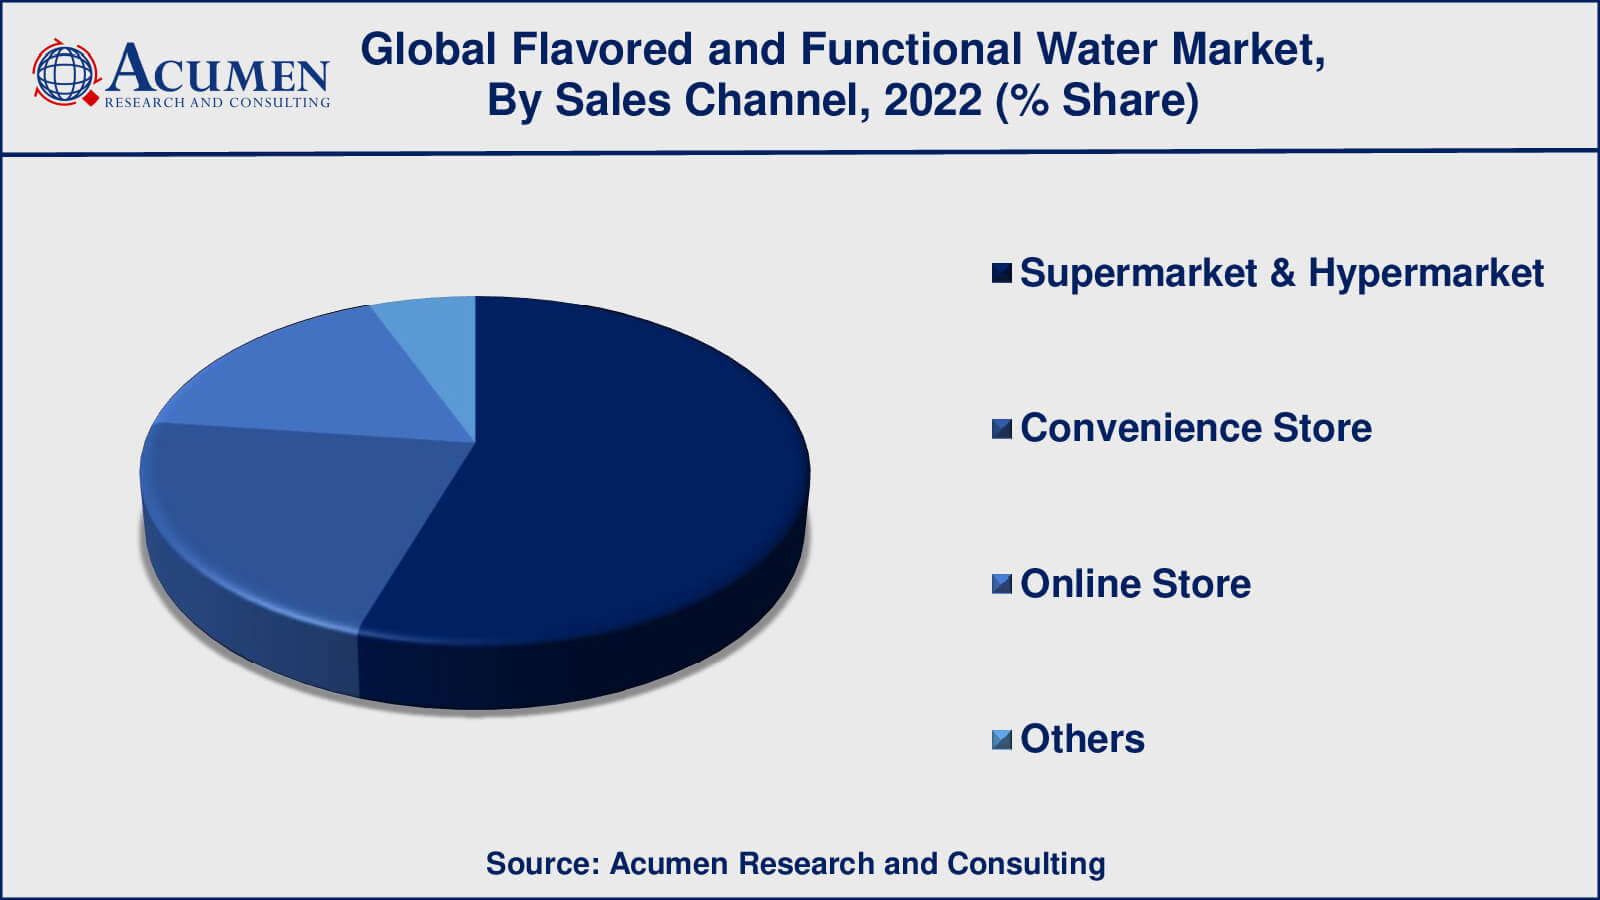
As per the flavored and functional market forecast, the supermarkets and hypermarkets will have the largest distribution channel share from 2023 to 2032. This is mainly due to the wide availability of these products in supermarkets and hypermarkets, which attract a large number of consumers.
Convenience stores are also an important distribution channel for flavored and functional water products, especially in urban areas where consumers tend to make frequent purchases of on-the-go products. Convenience stores offer a convenient and accessible shopping experience, which is appealing to busy consumers.
Online stores are a rapidly growing distribution channel for flavored and functional water products, with many consumers choosing to buy these products online due to the convenience of online shopping and the accessibility of a wider range of products.
Flavored and Functional Water Market Regional Outlook
North America
- U.S.
- Canada
Europe
- U.K.
- Germany
- France
- Spain
- Rest of Europe
Asia-Pacific
- India
- Japan
- China
- Australia
- South Korea
- Rest of Asia-Pacific
Latin America
- Brazil
- Mexico
- Rest of Latin America
The Middle East & Africa
- South Africa
- GCC Countries
- Rest of the Middle East & Africa (ME&A)
Flavored and Functional Water Regional Analysis
The market for flavored and useful water is international, and regional differences in market dominance may exist. Nonetheless, according to current market research estimates, North America has been the prominent region in the flavored and functional water industry. One of the main factors propelling the growth of this market in North America is the rise in health consciousness among consumers, increasing demand for low-calorie and low-sugar beverages, and the accessibility of a wide range of flavours and functional ingredients.
The market for flavored and functional water is anticipated to expand significantly in the Asia-Pacific region as a result of the region's growing awareness of the health advantages of functional beverages, rising disposable income, and rising demand for convenient, healthy beverages. The market is also growing in Europe, driven by the increasing demand for functional water among fitness enthusiasts, athletes, and health-conscious consumers.
Flavored and Functional Water Market Players
Some of the top flavored and functional water companies offered in the professional report include New York Spring Water, Nestle S.A., PepsiCo, Groupe Danone, Hint, Inc., The Coca-Cola Company, Kraft Foods, Hint Water, Sunny Delight Beverages Company, and Balance Water Company.
Frequently Asked Questions
What was the market size of the global flavored and functional water in 2022?
The market size of flavored and functional water was USD 36.4 billion in 2022.
What is the CAGR of the global flavored and functional water market from 2023 to 2032?
The CAGR of flavored and functional water is 12.3% during the analysis period of 2023 to 2032.
Which are the key players in the flavored and functional water market?
The key players operating in the global market are including New York Spring Water, Nestle S.A., PepsiCo, Groupe Danone, The Coca-Cola Company, Kraft Foods, Hint Water, Sunny Delight Beverages Company, and Balance Water Company.
Which region dominated the global flavored and functional water market share?
North America held the dominating position in flavored and functional water industry during the analysis period of 2023 to 2032.
Which region registered fastest CAGR from 2023 to 2032?
Asia-Pacific region exhibited fastest growing CAGR for market of flavored and functional water during the analysis period of 2023 to 2032.
What are the current trends and dynamics in the global flavored and functional water industry?
The current trends and dynamics in the flavored and functional water industry include increasing health consciousness, rising demand for low-calorie and low-sugar beverages, and availability of a variety of flavors and functional ingredients.
Which Product held the maximum share in 2022?
The flavored product held the maximum share of the flavored and functional water industry.


