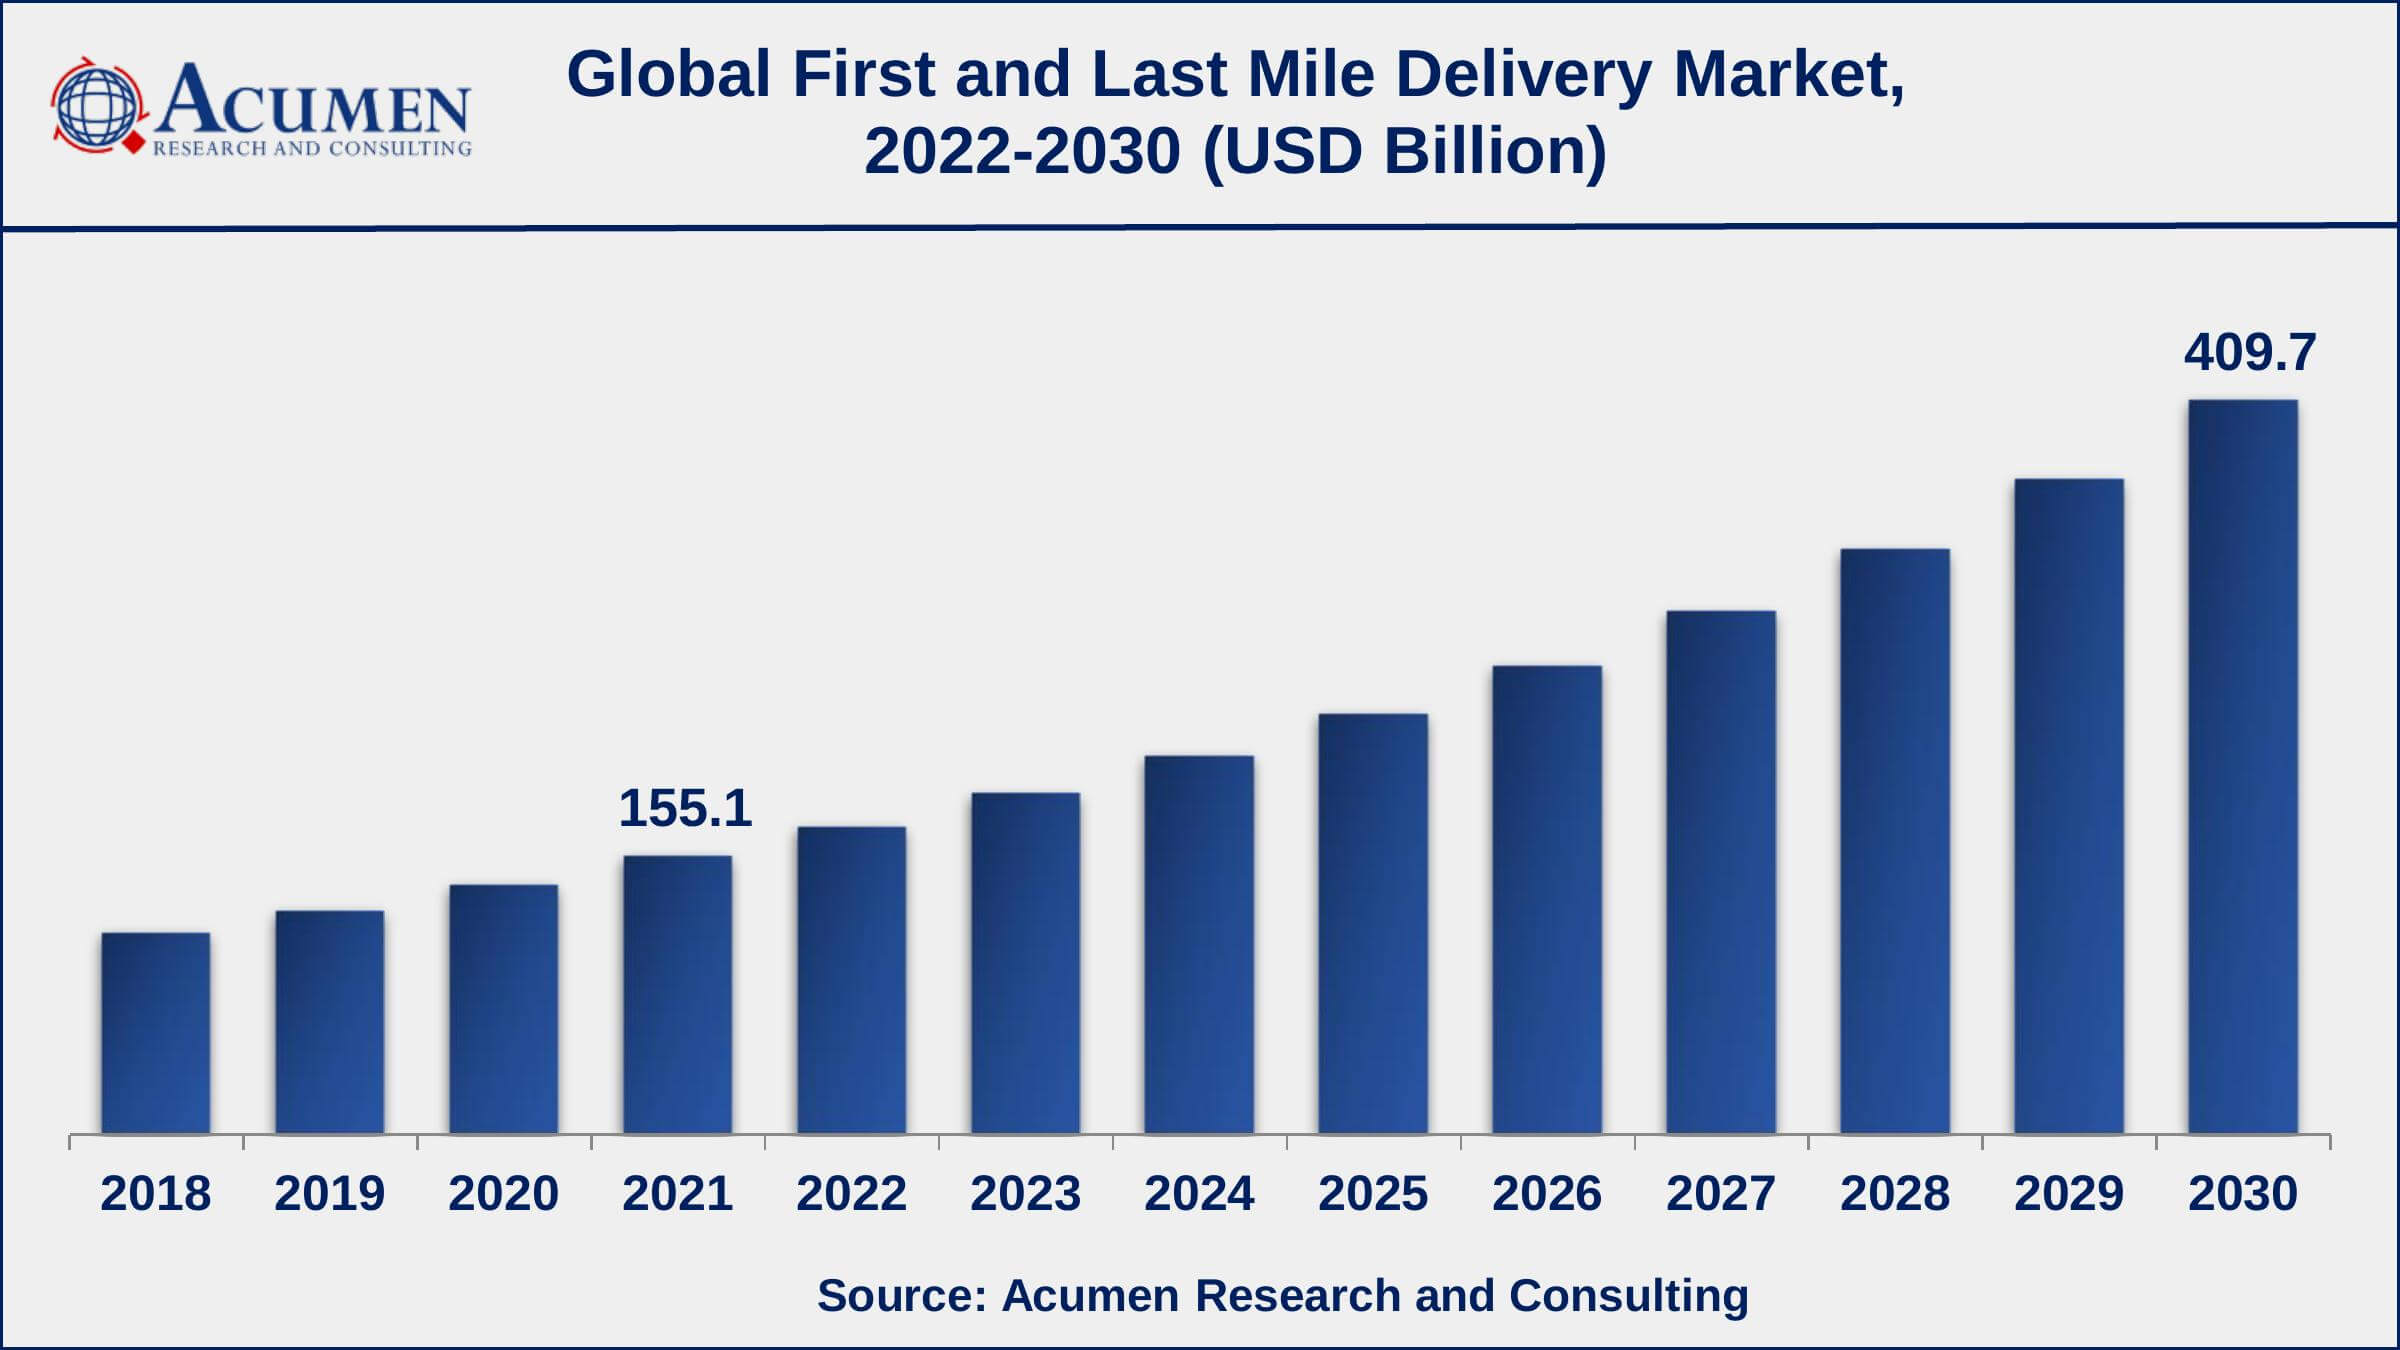
The Global First and Last Mile Delivery Market Size accounted for USD 155.1 Billion in 2021 and is projected to occupy a market size of USD 409.7 Billion by 2030 growing at a CAGR of 6.6% from 2022 to 2030.
First mile means the transfer of various products from a vendor to a courier service or to anyone who is wanted to move goods to their final users. The last mile refers to the final transfer of product to their final proposed customers. First mile delivery can simply be known as the last mile delivery for a manufacturer. The report provides analysis of global first and last mile delivery market for the period 2018-2030, wherein 2022 to 2030 is the forecast period and 2021 is considered as the base year.
First and Last Mile Delivery Market Report Statistics
- Global first and last mile delivery market revenue is projected to reach USD 409.7 billion by 2030 with a CAGR of 6.6% from 2022 to 2030
- Asia-Pacific first and last mile delivery market share generated over US$ 63.59 billion revenue in 2021
- North America first and last mile delivery market growth will record noteworthy CAGR from 2022 to 2030
- Based on vehicle type, light duty vehicle sub-segment gathered 40% shares in 2021
- Among cargo type, dry goods recorded 39% shares in 2021
- Growing adoption of drones in delivery is a popular first and last mile delivery market trend that fuels the industry demand
Global First and Last Mile Delivery Market Dynamics
Market Drivers
- Growing popularity of technology-driven platforms
- Reduction in delivery cost
- Increasing development in ground delivery vehicles
- Rising penetration of internet and smartphones in developing nations
Market Restraints
- Poor management of last-mile delivery operations
- Stringent guidelines pertaining to operations of ground delivery vehicles
Market Opportunities
- Expanding e-commerce industry
- Increasing automation in warehousing and delivery processes
First and Last Mile Delivery Market Report Coverage
Market |
First and Last Mile Delivery Market |
First and Last Mile Delivery Market Size 2021 |
USD 155.1 Billion |
First and Last Mile Delivery Market Forecast 2030 |
USD 409.7 Billion |
First and Last Mile Delivery Market CAGR During 2022 - 2030 |
6.6% |
First and Last Mile Delivery Market Analysis Period |
2018 - 2030 |
First and Last Mile Delivery Market Base Year |
2021 |
First and Last Mile Delivery Market Forecast Data |
2022 - 2030 |
Segments Covered |
By Vehicle Type, By Cargo Type, By End-Use, And By Geography
|
Regional Scope |
North America, Europe, Asia Pacific, Latin America, and Middle East & Africa |
Key Companies Profiled |
Cargo Carriers Limited, United Parcel Service Inc., Swift Transport, Interlogix Pty. Ltd., Transtech Logistics, TNT Express, Tuma Transport, DB SCHENKER, FedEx Corporation, Concargo Private Limited, Procet Freight, J&J Global Limited, Kerry Logistics Network Limited, DHL Global Forwarding and KART.
|
Report Coverage
|
Market Trends, Drivers, Restraints, Competitive Analysis, Player Profiling, Regulation Analysis |
First and Last Mile Delivery Market Growth Factors
Rising number of last mile and first mile delivery companies and start-ups, rapid growth in the logistics industry, changing standards of living, expansion of transport facilities, growing penetration of smartphones, increased disposable income, increasing demand for automation and advancements in technology are some of the primary factors that are propelling the first and last mile delivery market growth across the globe. As first and last mile delivery service has large number of applications in the logistic industry, rising number of last mile and first mile delivery companies and start-ups are providing various intense opportunities for the logistics industry. Augment in population is increasing the consumption and supply of food and other goods across the globe. A number of customers are keen to pay extra charge for quick delivery, resulting in the high demand for first and last mile delivery and is anticipated to supplement the overall market growth in coming years. The ongoing developments in the last mile delivery ecosystem are helping the global market to grow. In addition, acceleration, retail price, fuel economy, ease of operation and interior volume of light duty vehicles are forcing most logistic companies to use light duty vehicles. Road transportation activities are increasing across the globe, thereby boosting the overall growth of the market. Development of electric vehicles and stringent emission norms by OEMs are expected to spur the global first and last mile delivery market during the forecast period. However, an increase in the unemployment rate because of the replacement of laborers and delivery boys by drones and robots may hinder the global first and last mile delivery market growth over the forecast time frame.
First and Last Mile Delivery Market Segmentation
The global first and last mile delivery market is segmented based on vehicle type, cargo type, end-use, and geography.
First and Last Mile Delivery Market By Vehicle Type
- Light Duty Vehicle
- Medium Duty Vehicle
- Heavy Duty Vehicle
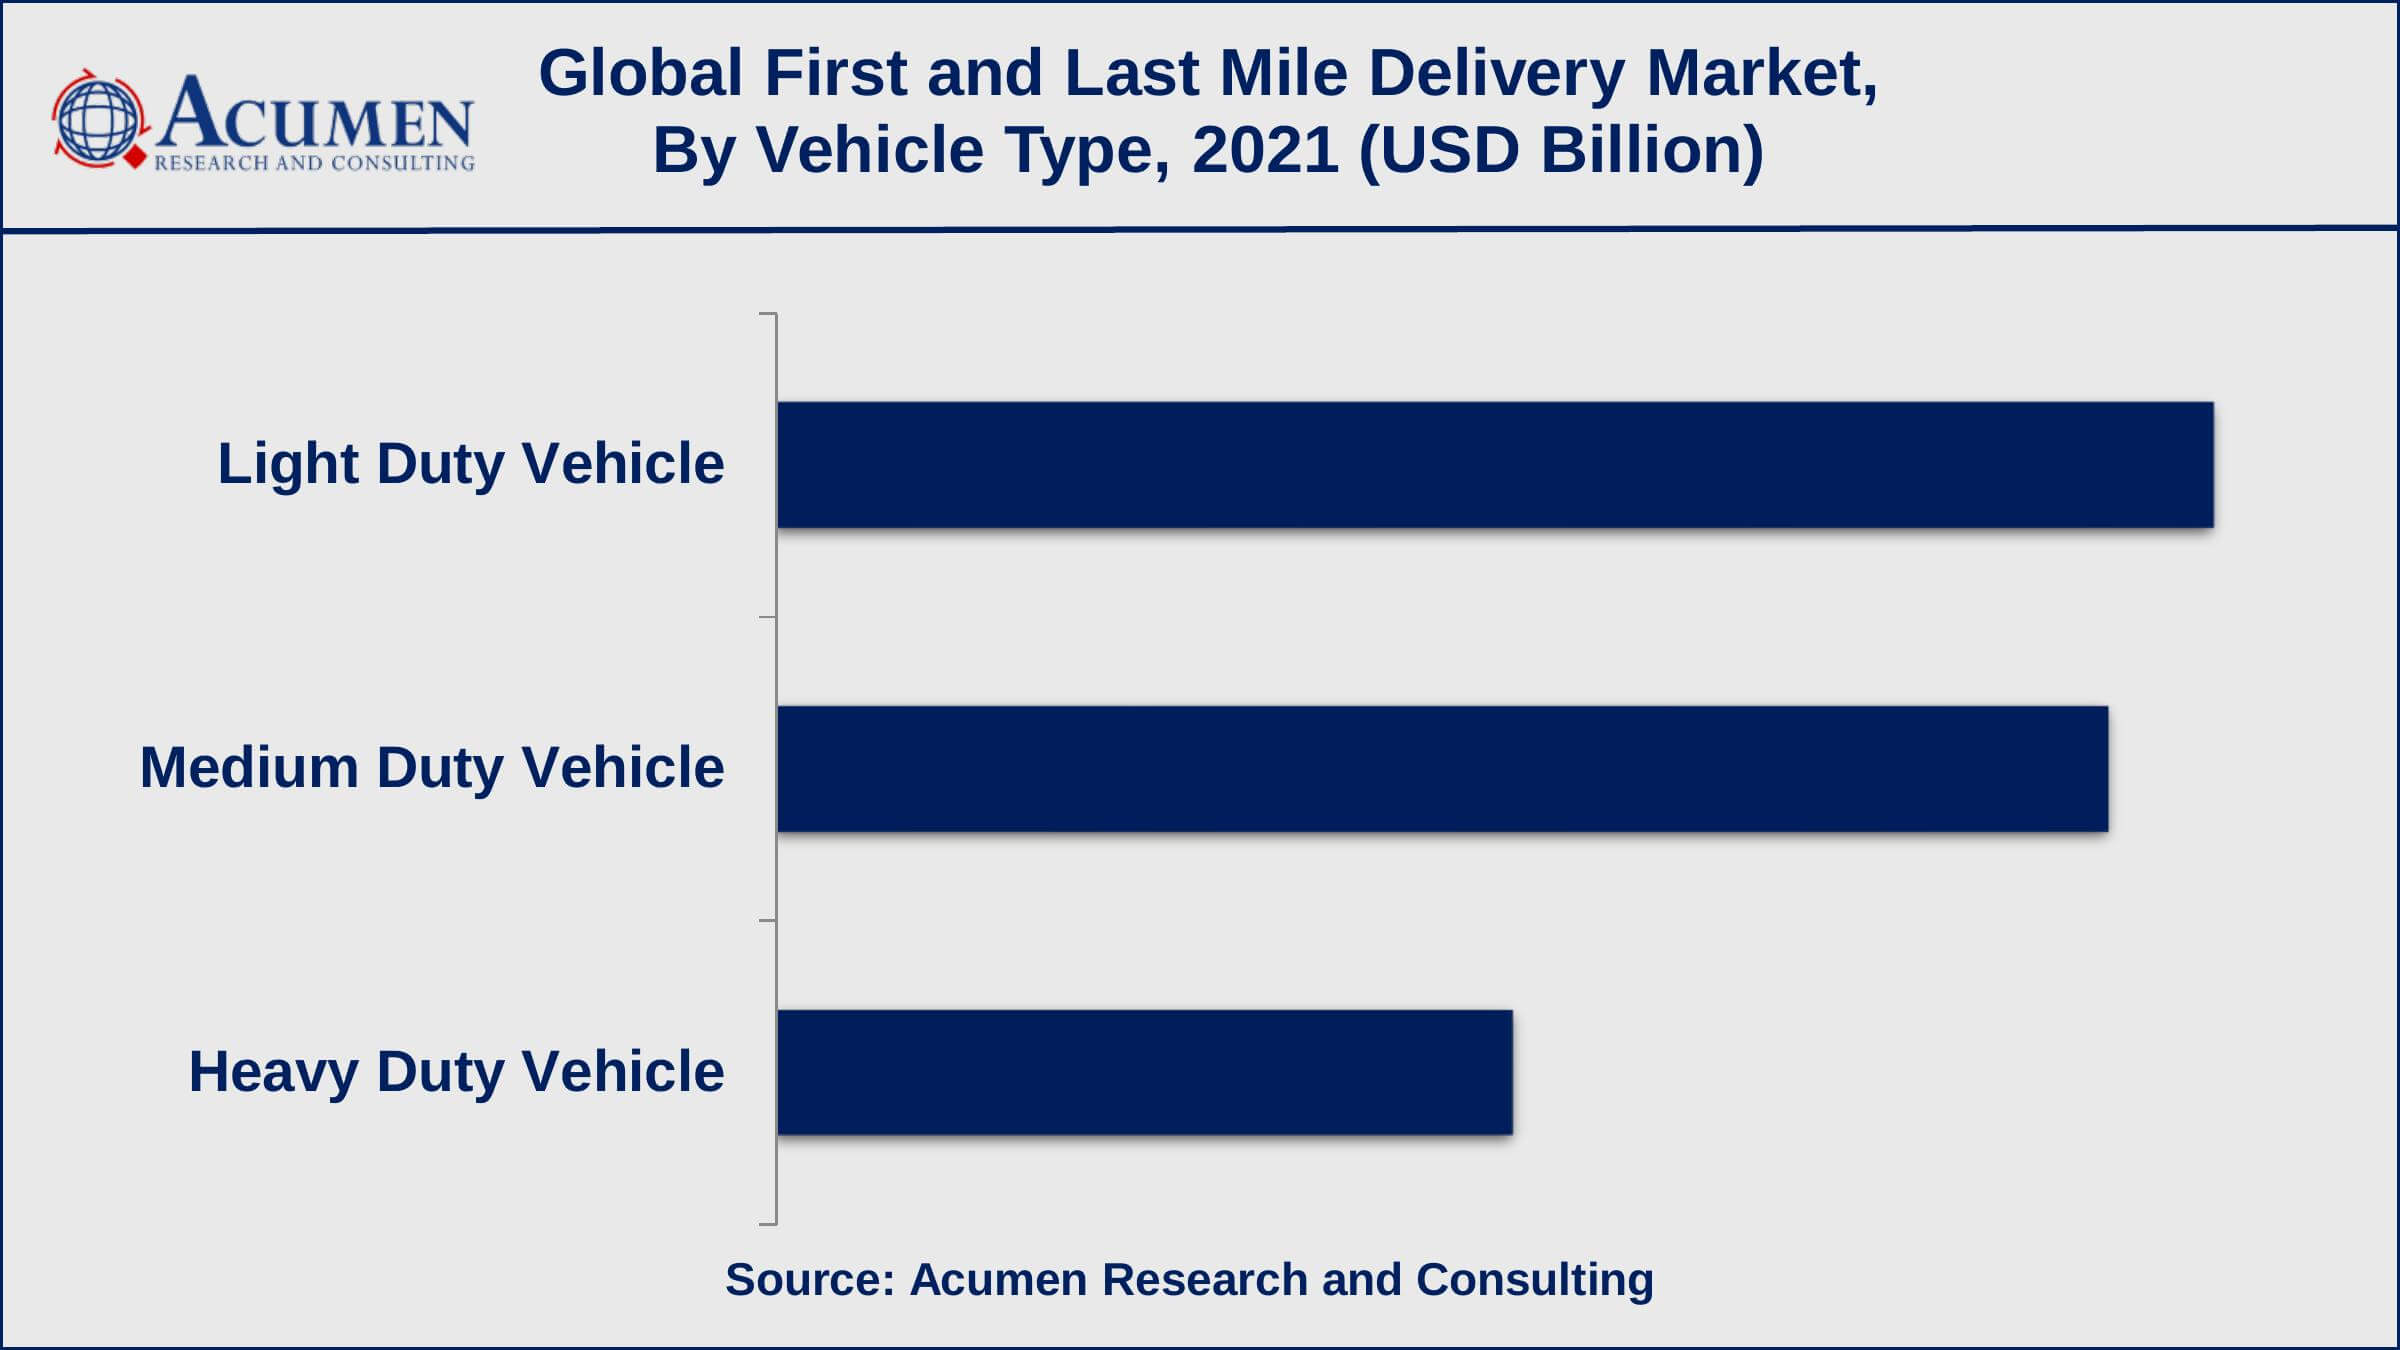
According to our first and last mile delivery industry analysis, the light duty vehicle sub-segment accounted for majority of the revenue in 2021, and this trend is expected to continue in the coming years. The light duty vehicle segment's first and last mile delivery market share is expected to grow, as light commercial vehicle sales are high and it can easily transport FMCG and food & beverage products.
First and Last Mile Delivery Market By Cargo Type
- Dry Goods
- Postal
- Liquid Goods
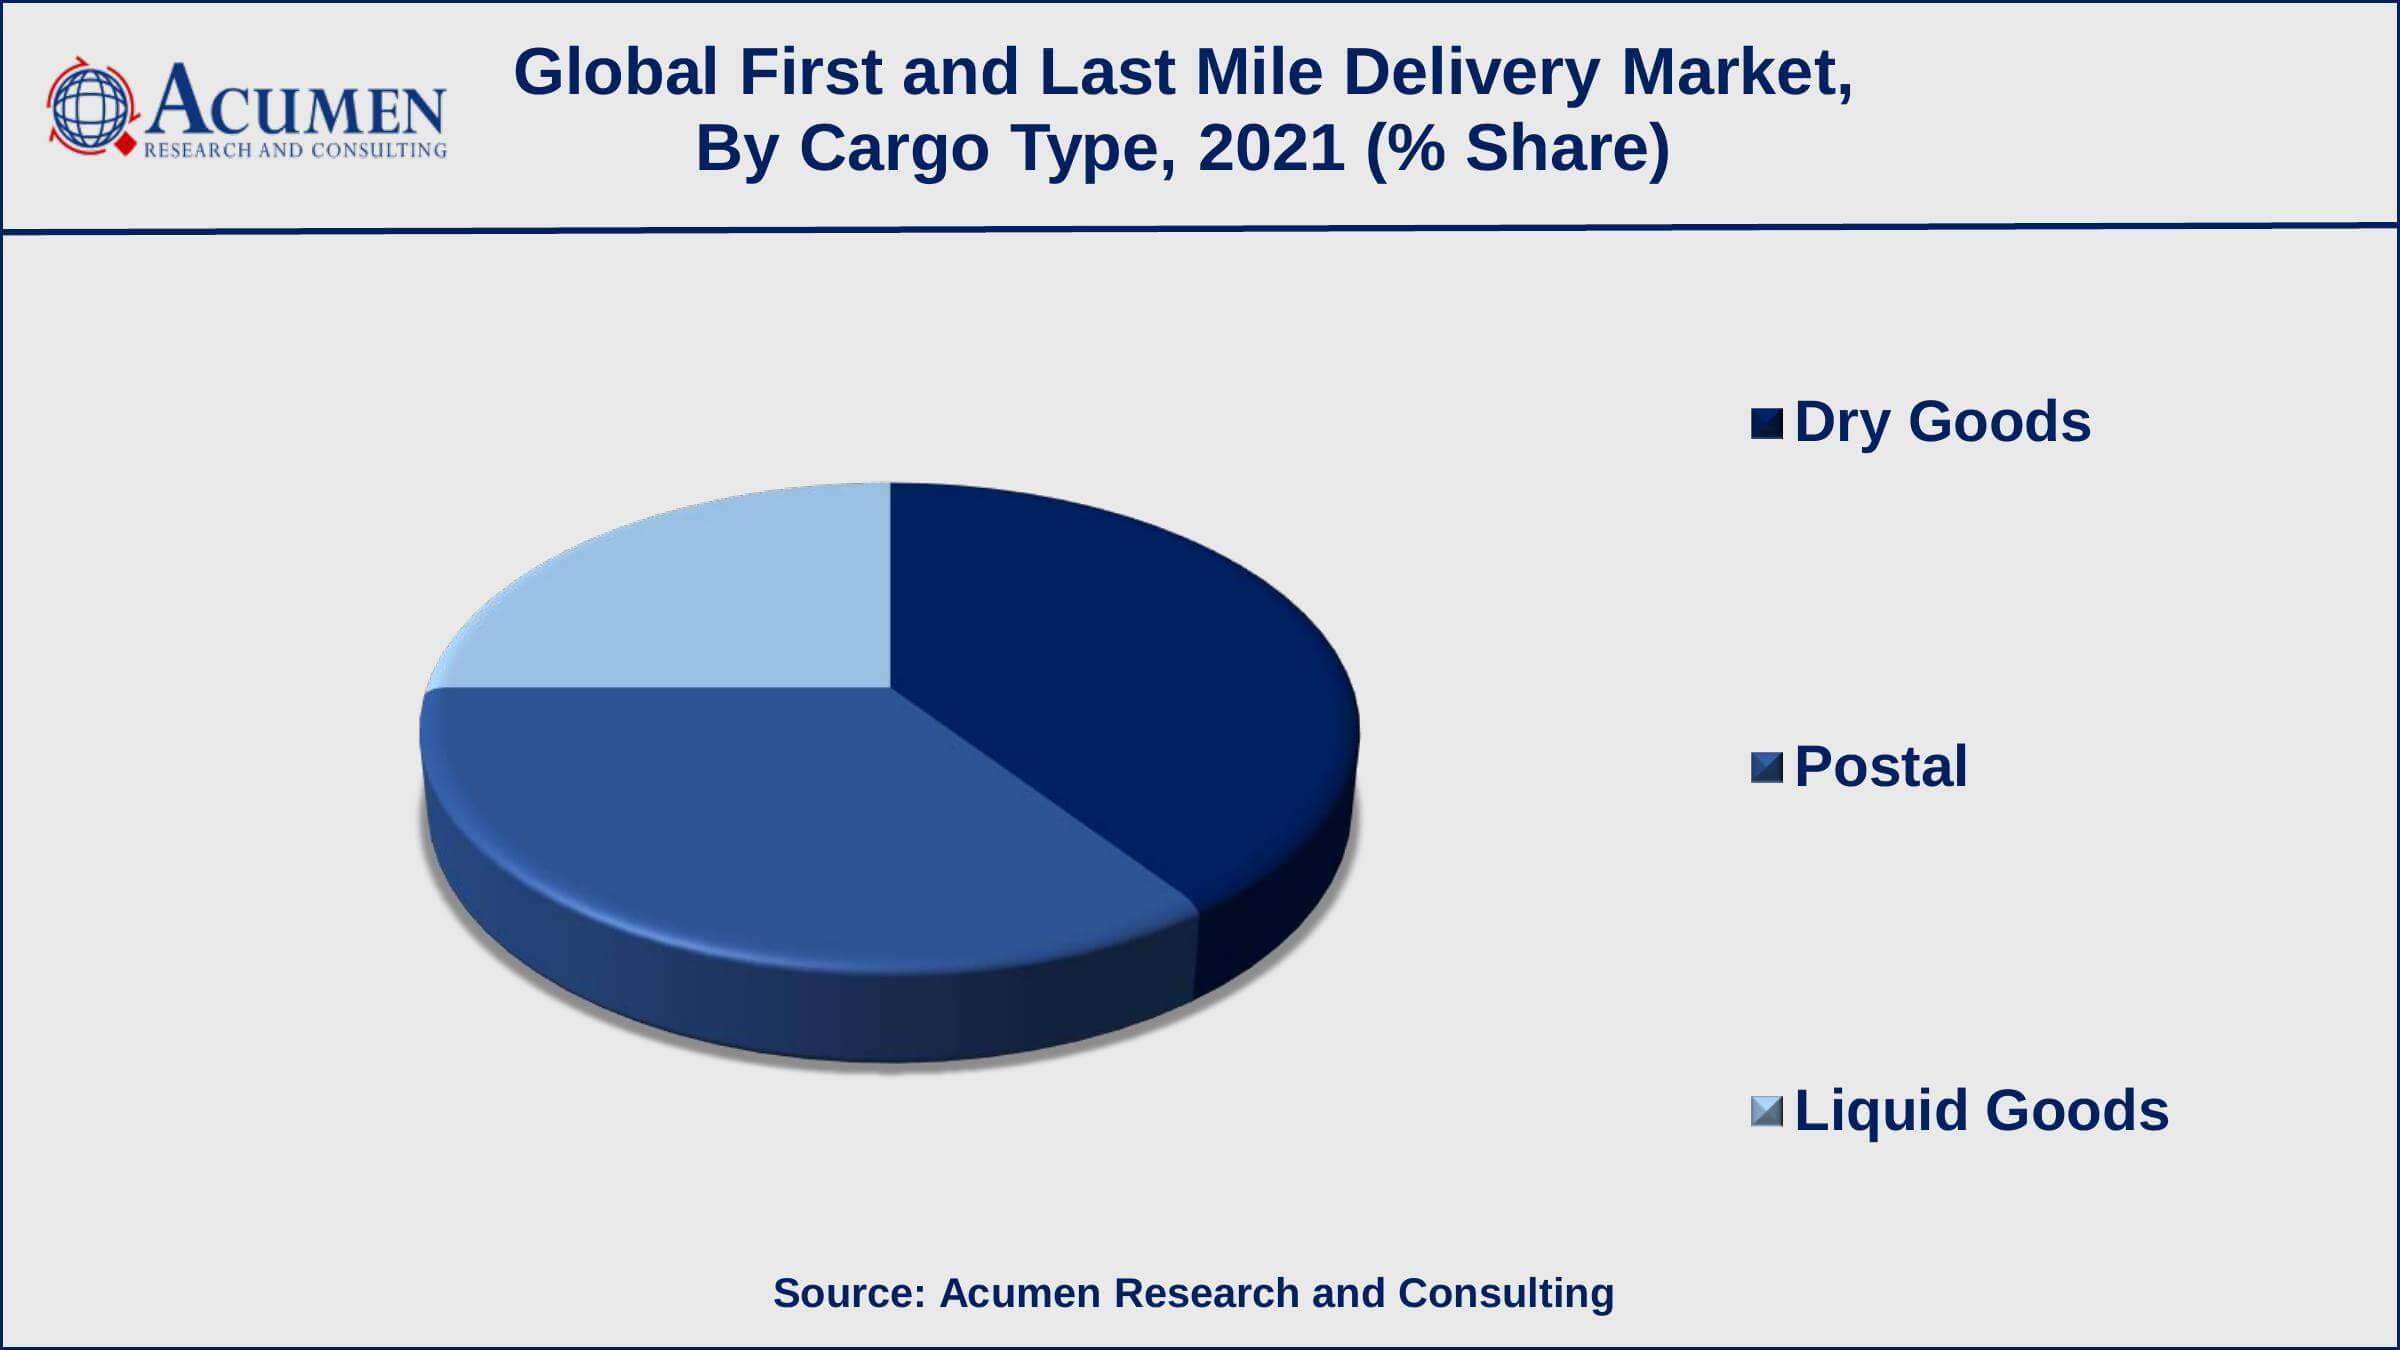
According to our first and last mile delivery market forecast, the dry goods cargo type will account for a sizable market share from 2022 to 2030. Chemicals, liquor, oil, and other liquid goods face transportation and delivery constraints in various countries and such materials require a leak-proof vessel for transportation, raising the cost even further.
First and Last Mile Delivery Market By End-Use
- Chemical
- Pharmaceutical and Healthcare
- FMCG
- Hi-tech Product Industry
- Food and Beverage
- Others
Based on end-use segment, the FMCG sub-segment is expected to generate significant market share in 2021 and is likely to do so in the coming years. The noteworthy market share in the segment is credited to increased disposable income, increased digital connectivity in rural and urban areas, and increased demand for FMCG products via e-commerce portals. On the other hand, food & beverage and pharmaceutical and healthcare are likely to gain significant impetus during the forecasted timeframe from 2022 to 2030.
First and Last Mile Delivery Market Regional Outlook
North America
Europe
- U.K.
- Germany
- France
- Spain
- Rest of Europe
Asia-Pacific
- India
- Japan
- China
- Australia
- South Korea
- Rest of Asia-Pacific
Latin America
- Brazil
- Mexico
- Rest of Latin America
The Middle East & Africa
- South Africa
- GCC Countries
- Rest of the Middle East & Africa (ME&A)
First and Last Mile Delivery Market Regional Analysis
Asia-Pacific leads the global first and last mile delivery markets due to the countries' large populations, which serve as a major consumer base for the e-commerce space. Population growth, an increase in commodity requirements, the existence of third-party logistics (3PL) service providers offering first and last mile deliveries and an increase in the trend of online shopping are some of the key factors driving the Asia-Pacific market. North America and Europe have emerged as the leading first and last mile markets.
First and Last Mile Delivery Market Players
The global first and last mile delivery market is characterized by the presence of experienced and established players. The global first and last mile delivery market is characterized by the presence of experienced and established players. Some of the key players include Cargo Carriers Limited, United Parcel Service Inc., Swift Transport, Interlogix Pty. Ltd., Transtech Logistics, TNT Express, Tuma Transport, DB SCHENKER, FedEx Corporation, Concargo Private Limited, Procet Freight, J&J Global Limited, Kerry Logistics Network Limited, DHL Global Forwarding and KART.

CHAPTER 1. Industry Overview of First and Last Mile Delivery Market
1.1. Definition and Scope
1.1.1. Definition of First and Last Mile Delivery
1.1.2. Market Segmentation
1.1.3. Years Considered for the Study
1.1.4. Assumptions and Acronyms Used
1.1.4.1. Market Assumptions and Market Forecast
1.1.4.2. Acronyms Used in Global First and Last Mile Delivery Market
1.2. Summary
1.2.1. Executive Summary
1.2.2. First and Last Mile Delivery Market By Vehicle Type
1.2.3. First and Last Mile Delivery Market By Cargo Type
1.2.4. First and Last Mile Delivery Market By End-Use
1.2.5. First and Last Mile Delivery Market By Region
CHAPTER 2. Research Approach
2.1. Methodology
2.1.1. Research Programs
2.1.2. Market Size Estimation
2.1.3. Market Breakdown and Data Triangulation
2.2. Data Source
2.2.1. Secondary Sources
2.2.2. Primary Sources
CHAPTER 3. Market Dynamics And Competition Analysis
3.1. Market Drivers
3.1.1. Driver 1
3.1.2. Driver 2
3.2. Restraints and Challenges
3.2.1. Restraint 1
3.2.2. Restraint 2
3.3. Growth Opportunities
3.3.1. Opportunity 1
3.3.2. Opportunity 2
3.4. Porter’s Five Forces Analysis
3.4.1. Bargaining Power of Suppliers
3.4.2. Bargaining Power of Buyers
3.4.3. Threat of Substitute
3.4.4. Threat of New Entrants
3.4.5. Degree of Competition
3.5. Market Concentration Ratio and Market Maturity Analysis of First and Last Mile Delivery Market
3.5.1. Go To Market Strategy
3.5.1.1. Introduction
3.5.1.2. Growth
3.5.1.3. Maturity
3.5.1.4. Saturation
3.5.1.5. Possible Development
3.6. Technological Roadmap for First and Last Mile Delivery Market
3.7. Value Chain Analysis
3.7.1. List of Key Manufacturers
3.7.2. List of Customers
3.7.3. Level of Integration
3.8. Regulatory Compliance
3.9. Competitive Landscape, 2021
3.9.1. Player Positioning Analysis
3.9.2. Key Strategies Adopted By Leading Players
CHAPTER 4. First and Last Mile Delivery Market By Vehicle Type
4.1. Introduction
4.2. First and Last Mile Delivery Market Revenue By Vehicle Type
4.2.1. First and Last Mile Delivery Market Revenue (USD Million) and Forecast, By Vehicle Type, 2018-2030
4.2.2. Light Duty Vehicle
4.2.2.1. Light Duty Vehicle Market Revenue (USD Million) and Growth Rate (%), 2018-2030
4.2.3. Medium Duty Vehicle
4.2.3.1. Medium Duty Vehicle Market Revenue (USD Million) and Growth Rate (%), 2018-2030
4.2.4. Medium Duty Vehicle
4.2.4.1. Medium Duty Vehicle Market Revenue (USD Million) and Growth Rate (%), 2018-2030
CHAPTER 5. First and Last Mile Delivery Market By Cargo Type
5.1. Introduction
5.2. First and Last Mile Delivery Market Revenue By Cargo Type
5.2.1. First and Last Mile Delivery Market Revenue (USD Million) and Forecast, By Cargo Type, 2018-2030
5.2.2. Dry Goods
5.2.2.1. Dry Goods Market Revenue (USD Million) and Growth Rate (%), 2018-2030
5.2.3. Postal
5.2.3.1. Postal Market Revenue (USD Million) and Growth Rate (%), 2018-2030
5.2.4. Liquid Goods
5.2.4.1. Liquid Goods Market Revenue (USD Million) and Growth Rate (%), 2018-2030
CHAPTER 6. First and Last Mile Delivery Market By End-Use
6.1. Introduction
6.2. First and Last Mile Delivery Market Revenue By End-Use
6.2.1. First and Last Mile Delivery Market Revenue (USD Million) and Forecast, By End-Use, 2018-2030
6.2.2. Chemical
6.2.2.1. Chemical Market Revenue (USD Million) and Growth Rate (%), 2018-2030
6.2.3. Pharmaceutical and Healthcare
6.2.3.1. Pharmaceutical and Healthcare Market Revenue (USD Million) and Growth Rate (%), 2018-2030
6.2.4. FMCG
6.2.4.1. FMCG Market Revenue (USD Million) and Growth Rate (%), 2018-2030
6.2.5. Hi-tech Product Industry
6.2.5.1. Hi-tech Product Industry Market Revenue (USD Million) and Growth Rate (%), 2018-2030
6.2.6. Food and Beverage
6.2.6.1. Food and Beverage Market Revenue (USD Million) and Growth Rate (%), 2018-2030
6.2.7. Others
6.2.7.1. Others Market Revenue (USD Million) and Growth Rate (%), 2018-2030
CHAPTER 7. North America First and Last Mile Delivery Market By Country
7.1. North America First and Last Mile Delivery Market Overview
7.2. U.S.
7.2.1. U.S. First and Last Mile Delivery Market Revenue (USD Million) and Forecast By Vehicle Type, 2018-2030
7.2.2. U.S. First and Last Mile Delivery Market Revenue (USD Million) and Forecast By Cargo Type, 2018-2030
7.2.3. U.S. First and Last Mile Delivery Market Revenue (USD Million) and Forecast By End-Use, 2018-2030
7.3. Canada
7.3.1. Canada First and Last Mile Delivery Market Revenue (USD Million) and Forecast By Vehicle Type, 2018-2030
7.3.2. Canada First and Last Mile Delivery Market Revenue (USD Million) and Forecast By Cargo Type, 2018-2030
7.3.3. Canada First and Last Mile Delivery Market Revenue (USD Million) and Forecast By End-Use, 2018-2030
7.4. North America PEST Analysis
CHAPTER 8. Europe First and Last Mile Delivery Market By Country
8.1. Europe First and Last Mile Delivery Market Overview
8.2. U.K.
8.2.1. U.K. First and Last Mile Delivery Market Revenue (USD Million) and Forecast By Vehicle Type, 2018-2030
8.2.2. U.K. First and Last Mile Delivery Market Revenue (USD Million) and Forecast By Cargo Type, 2018-2030
8.2.3. U.K. First and Last Mile Delivery Market Revenue (USD Million) and Forecast By End-Use, 2018-2030
8.3. Germany
8.3.1. Germany First and Last Mile Delivery Market Revenue (USD Million) and Forecast By Vehicle Type, 2018-2030
8.3.2. Germany First and Last Mile Delivery Market Revenue (USD Million) and Forecast By Cargo Type, 2018-2030
8.3.3. Germany First and Last Mile Delivery Market Revenue (USD Million) and Forecast By End-Use, 2018-2030
8.4. France
8.4.1. France First and Last Mile Delivery Market Revenue (USD Million) and Forecast By Vehicle Type, 2018-2030
8.4.2. France First and Last Mile Delivery Market Revenue (USD Million) and Forecast By Cargo Type, 2018-2030
8.4.3. France First and Last Mile Delivery Market Revenue (USD Million) and Forecast By End-Use, 2018-2030
8.5. Spain
8.5.1. Spain First and Last Mile Delivery Market Revenue (USD Million) and Forecast By Vehicle Type, 2018-2030
8.5.2. Spain First and Last Mile Delivery Market Revenue (USD Million) and Forecast By Cargo Type, 2018-2030
8.5.3. Spain First and Last Mile Delivery Market Revenue (USD Million) and Forecast By End-Use, 2018-2030
8.6. Rest of Europe
8.6.1. Rest of Europe First and Last Mile Delivery Market Revenue (USD Million) and Forecast By Vehicle Type, 2018-2030
8.6.2. Rest of Europe First and Last Mile Delivery Market Revenue (USD Million) and Forecast By Cargo Type, 2018-2030
8.6.3. Rest of Europe First and Last Mile Delivery Market Revenue (USD Million) and Forecast By End-Use, 2018-2030
8.7. Europe PEST Analysis
CHAPTER 9. Asia-Pacific First and Last Mile Delivery Market By Country
9.1. Asia-Pacific First and Last Mile Delivery Market Overview
9.2. China
9.2.1. China First and Last Mile Delivery Market Revenue (USD Million) and Forecast By Vehicle Type, 2018-2030
9.2.2. China First and Last Mile Delivery Market Revenue (USD Million) and Forecast By Cargo Type, 2018-2030
9.2.3. China First and Last Mile Delivery Market Revenue (USD Million) and Forecast By End-Use, 2018-2030
9.3. Japan
9.3.1. Japan First and Last Mile Delivery Market Revenue (USD Million) and Forecast By Vehicle Type, 2018-2030
9.3.2. Japan First and Last Mile Delivery Market Revenue (USD Million) and Forecast By Cargo Type, 2018-2030
9.3.3. Japan First and Last Mile Delivery Market Revenue (USD Million) and Forecast By End-Use, 2018-2030
9.4. India
9.4.1. India First and Last Mile Delivery Market Revenue (USD Million) and Forecast By Vehicle Type, 2018-2030
9.4.2. India First and Last Mile Delivery Market Revenue (USD Million) and Forecast By Cargo Type, 2018-2030
9.4.3. India First and Last Mile Delivery Market Revenue (USD Million) and Forecast By End-Use, 2018-2030
9.5. Australia
9.5.1. Australia First and Last Mile Delivery Market Revenue (USD Million) and Forecast By Vehicle Type, 2018-2030
9.5.2. Australia First and Last Mile Delivery Market Revenue (USD Million) and Forecast By Cargo Type, 2018-2030
9.5.3. Australia First and Last Mile Delivery Market Revenue (USD Million) and Forecast By End-Use, 2018-2030
9.6. South Korea
9.6.1. South Korea First and Last Mile Delivery Market Revenue (USD Million) and Forecast By Vehicle Type, 2018-2030
9.6.2. South Korea First and Last Mile Delivery Market Revenue (USD Million) and Forecast By Cargo Type, 2018-2030
9.6.3. South Korea First and Last Mile Delivery Market Revenue (USD Million) and Forecast By End-Use, 2018-2030
9.7. Rest of Asia-Pacific
9.7.1. Rest of Asia-Pacific First and Last Mile Delivery Market Revenue (USD Million) and Forecast By Vehicle Type, 2018-2030
9.7.2. Rest of Asia-Pacific First and Last Mile Delivery Market Revenue (USD Million) and Forecast By Cargo Type, 2018-2030
9.7.3. Rest of Asia-Pacific First and Last Mile Delivery Market Revenue (USD Million) and Forecast By End-Use, 2018-2030
9.8. Asia-Pacific PEST Analysis
CHAPTER 10. Latin America First and Last Mile Delivery Market By Country
10.1. Latin America First and Last Mile Delivery Market Overview
10.2. Brazil
10.2.1. Brazil First and Last Mile Delivery Market Revenue (USD Million) and Forecast By Vehicle Type, 2018-2030
10.2.2. Brazil First and Last Mile Delivery Market Revenue (USD Million) and Forecast By Cargo Type, 2018-2030
10.2.3. Brazil First and Last Mile Delivery Market Revenue (USD Million) and Forecast By End-Use, 2018-2030
10.3. Mexico
10.3.1. Mexico First and Last Mile Delivery Market Revenue (USD Million) and Forecast By Vehicle Type, 2018-2030
10.3.2. Mexico First and Last Mile Delivery Market Revenue (USD Million) and Forecast By Cargo Type, 2018-2030
10.3.3. Mexico First and Last Mile Delivery Market Revenue (USD Million) and Forecast By End-Use, 2018-2030
10.4. Rest of Latin America
10.4.1. Rest of Latin America First and Last Mile Delivery Market Revenue (USD Million) and Forecast By Vehicle Type, 2018-2030
10.4.2. Rest of Latin America First and Last Mile Delivery Market Revenue (USD Million) and Forecast By Cargo Type, 2018-2030
10.4.3. Rest of Latin America First and Last Mile Delivery Market Revenue (USD Million) and Forecast By End-Use, 2018-2030
10.5. Latin America PEST Analysis
CHAPTER 11. Middle East & Africa First and Last Mile Delivery Market By Country
11.1. Middle East & Africa First and Last Mile Delivery Market Overview
11.2. GCC
11.2.1. GCC First and Last Mile Delivery Market Revenue (USD Million) and Forecast By Vehicle Type, 2018-2030
11.2.2. GCC First and Last Mile Delivery Market Revenue (USD Million) and Forecast By Cargo Type, 2018-2030
11.2.3. GCC First and Last Mile Delivery Market Revenue (USD Million) and Forecast By End-Use, 2018-2030
11.3. South Africa
11.3.1. South Africa First and Last Mile Delivery Market Revenue (USD Million) and Forecast By Vehicle Type, 2018-2030
11.3.2. South Africa First and Last Mile Delivery Market Revenue (USD Million) and Forecast By Cargo Type, 2018-2030
11.3.3. South Africa First and Last Mile Delivery Market Revenue (USD Million) and Forecast By End-Use, 2018-2030
11.4. Rest of Middle East & Africa
11.4.1. Rest of Middle East & Africa First and Last Mile Delivery Market Revenue (USD Million) and Forecast By Vehicle Type, 2018-2030
11.4.2. Rest of Middle East & Africa First and Last Mile Delivery Market Revenue (USD Million) and Forecast By Cargo Type, 2018-2030
11.4.3. Rest of Middle East & Africa First and Last Mile Delivery Market Revenue (USD Million) and Forecast By End-Use, 2018-2030
11.5. Middle East & Africa PEST Analysis
CHAPTER 12. Player Analysis Of First and Last Mile Delivery Market
12.1. First and Last Mile Delivery Market Company Share Analysis
12.2. Competition Matrix
12.2.1. Competitive Benchmarking of key players by price, presence, market share, and R&D investment
12.2.2. New Product Launches and Product Enhancements
12.2.3. Mergers And Acquisition In Global First and Last Mile Delivery Market
12.2.4. Partnership, Joint Ventures and Strategic Alliances/ Sales Agreements
CHAPTER 13. Company Profile
13.1. Cargo Carriers Limited
13.1.1. Company Snapshot
13.1.2. Business Overview
13.1.3. Financial Overview
13.1.3.1. Revenue (USD Million), 2021
13.1.3.2. Cargo Carriers Limited 2021 First and Last Mile Delivery Business Regional Distribution
13.1.4. Product /Service and Specification
13.1.5. Recent Developments & Business Strategy
13.2. United Parcel Service Inc.
13.3. Swift Transport
13.4. Interlogix Pty. Ltd.
13.5. Transtech Logistics
13.6. TNT Express
13.7. Tuma Transport
13.8. DB SCHENKER
13.9. FedEx Corporation
13.10. Concargo Private Limited
13.11. Procet Freight
13.12. J&J Global Limited
13.13. Kerry Logistics Network Limited
13.14. DHL Global Forwarding
13.15. KART