Energy as a Service Market Size- Global Industry, Share, Analysis, Trends and Forecast 2023 - 2032
Published :
Report ID:
Pages :
Format :
Energy as a Service Market Size- Global Industry, Share, Analysis, Trends and Forecast 2023 - 2032
Report Coverage
- Industry Dynamics
- Market Size and Forecast Data
- Segment Analysis
- Competitive Landscape
- Regional Analysis with a Niche Focus on Country-Level Data
- High Level Analysis - Porter's, PESTEL, Value Chain, etc.
- Company Profiles of Key Players
- Option to Customize the Report As Per Your Specific Need
Request Sample Report
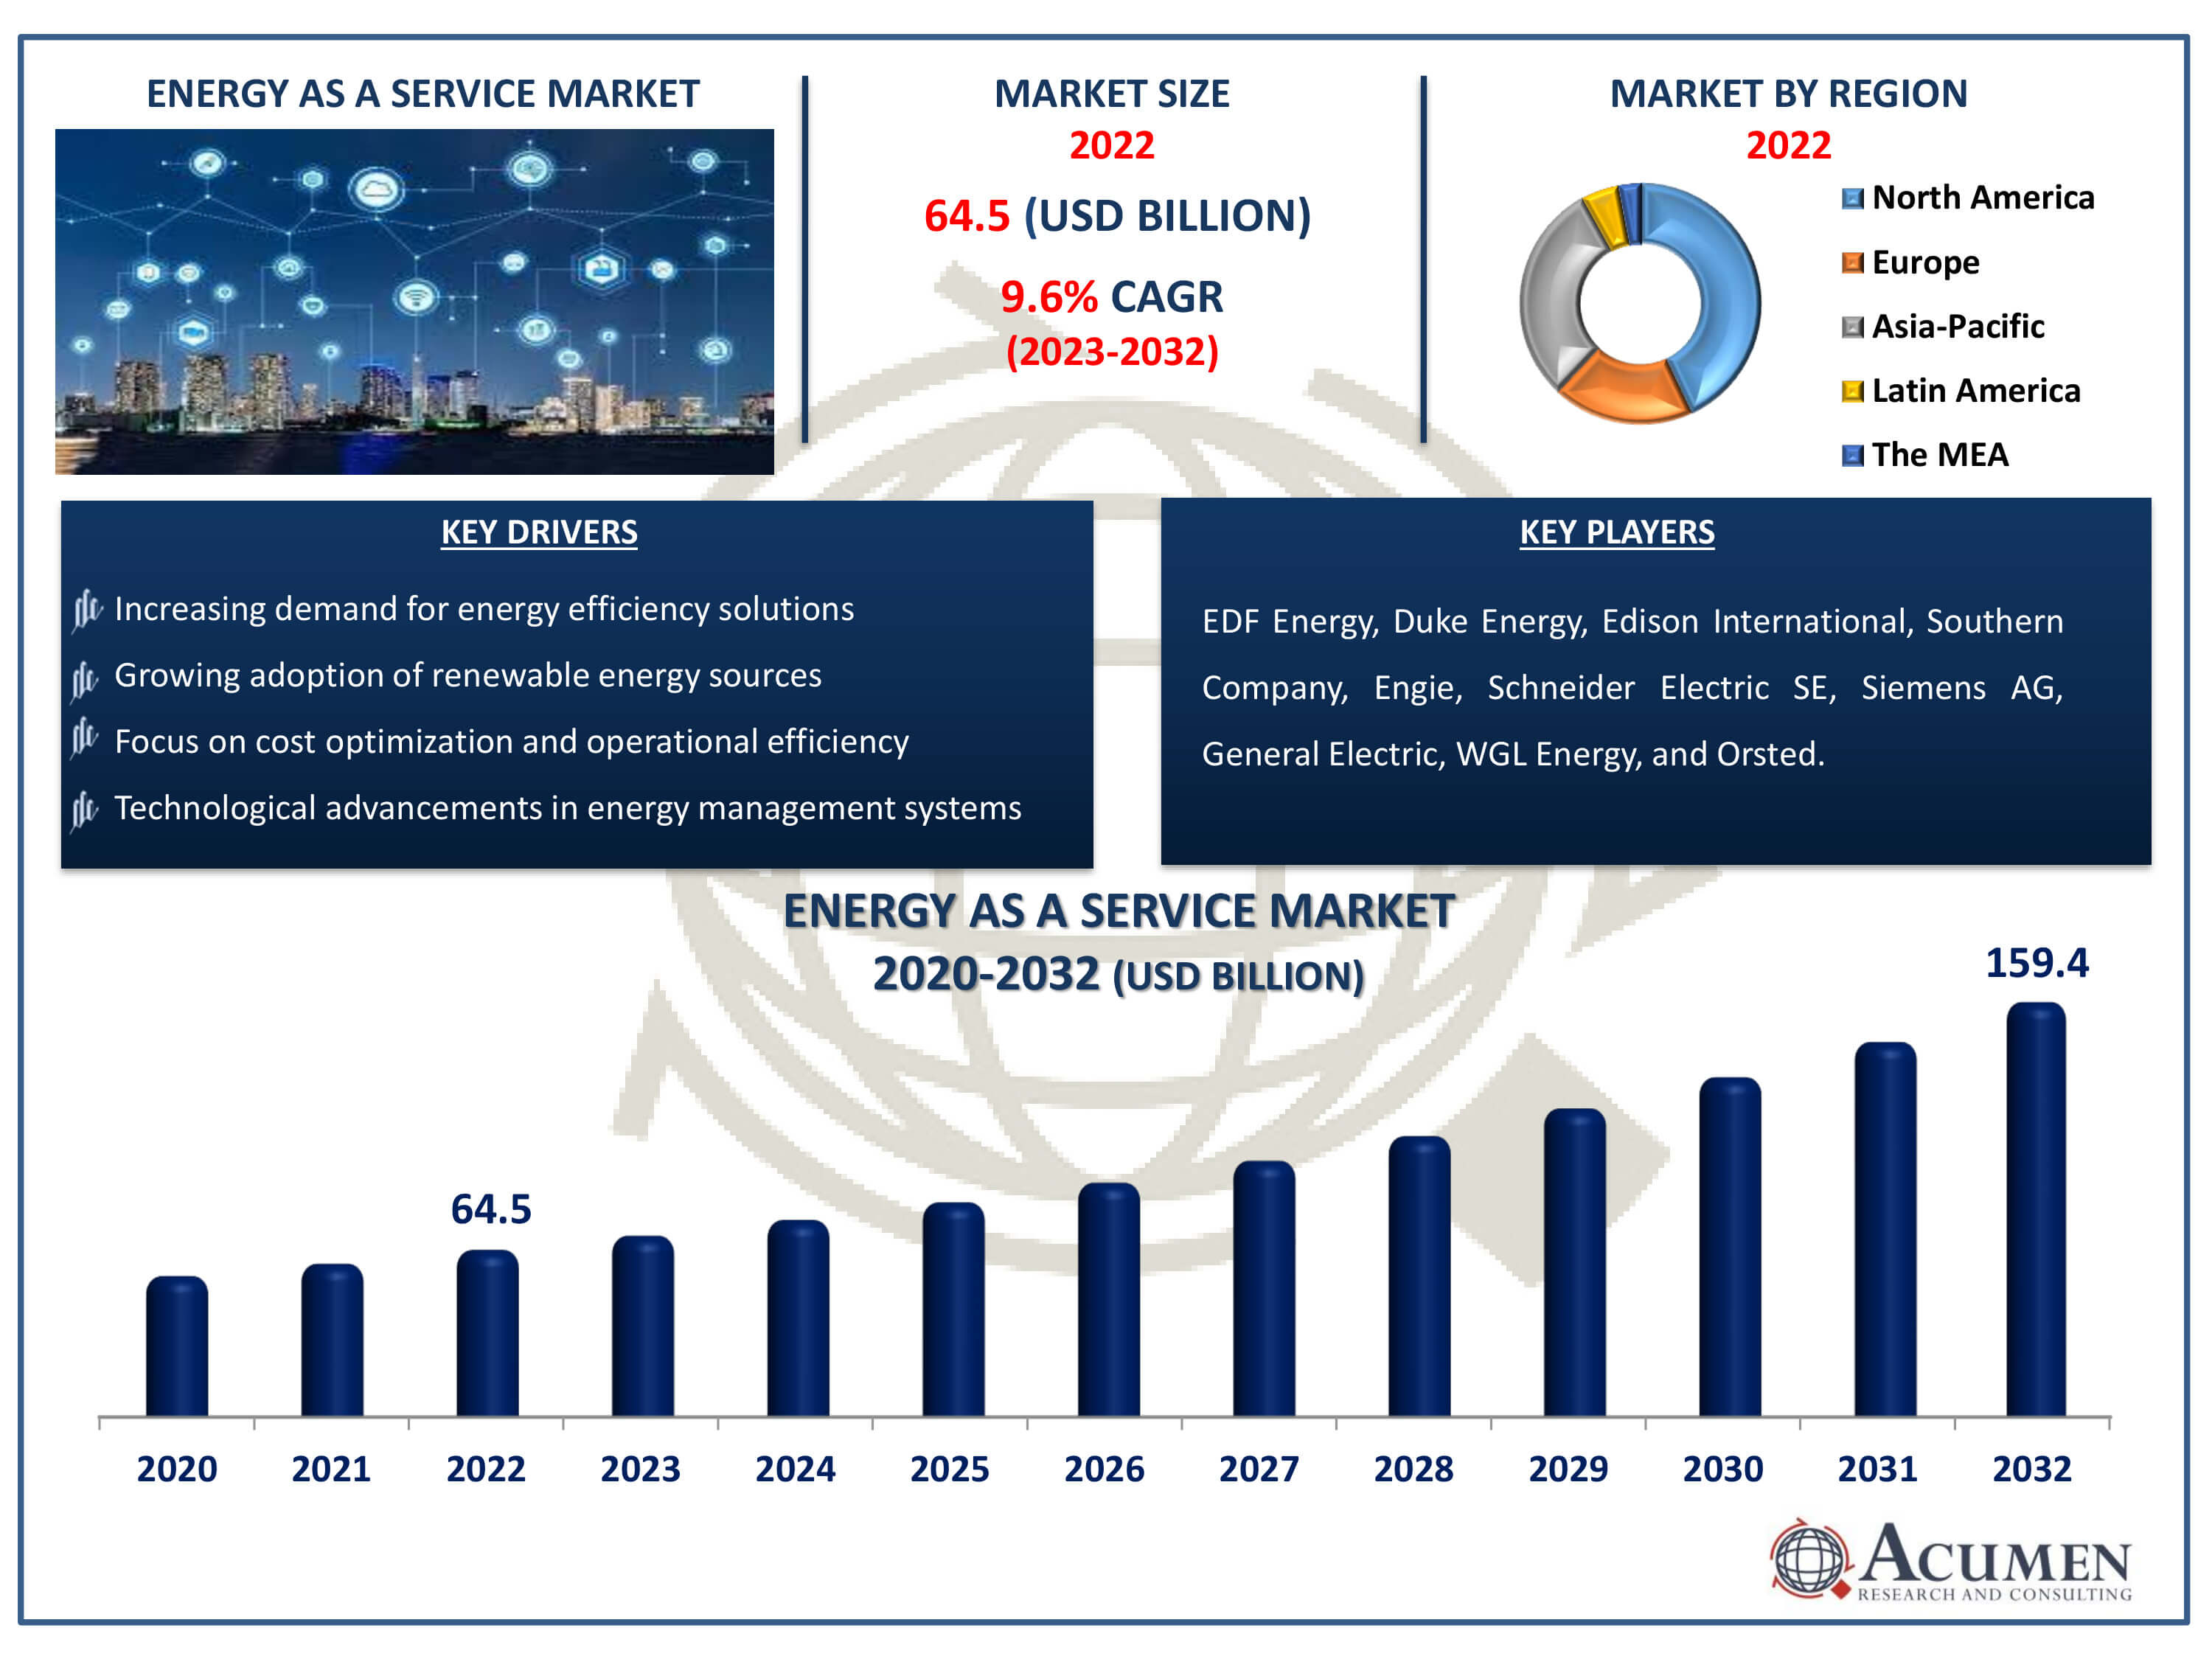
The Energy as a Service Market size accounted for USD 64.5 Billion in 2022 and is estimated to achieve a market size of USD 159.4 Billion by 2032 growing at a CAGR of 9.6% from 2023 to 2032.
Energy as a Service Market Highlights
- Global energy as a service market revenue is poised to garner USD 159.4 billion by 2032 with a CAGR of 9.6% from 2023 to 2032
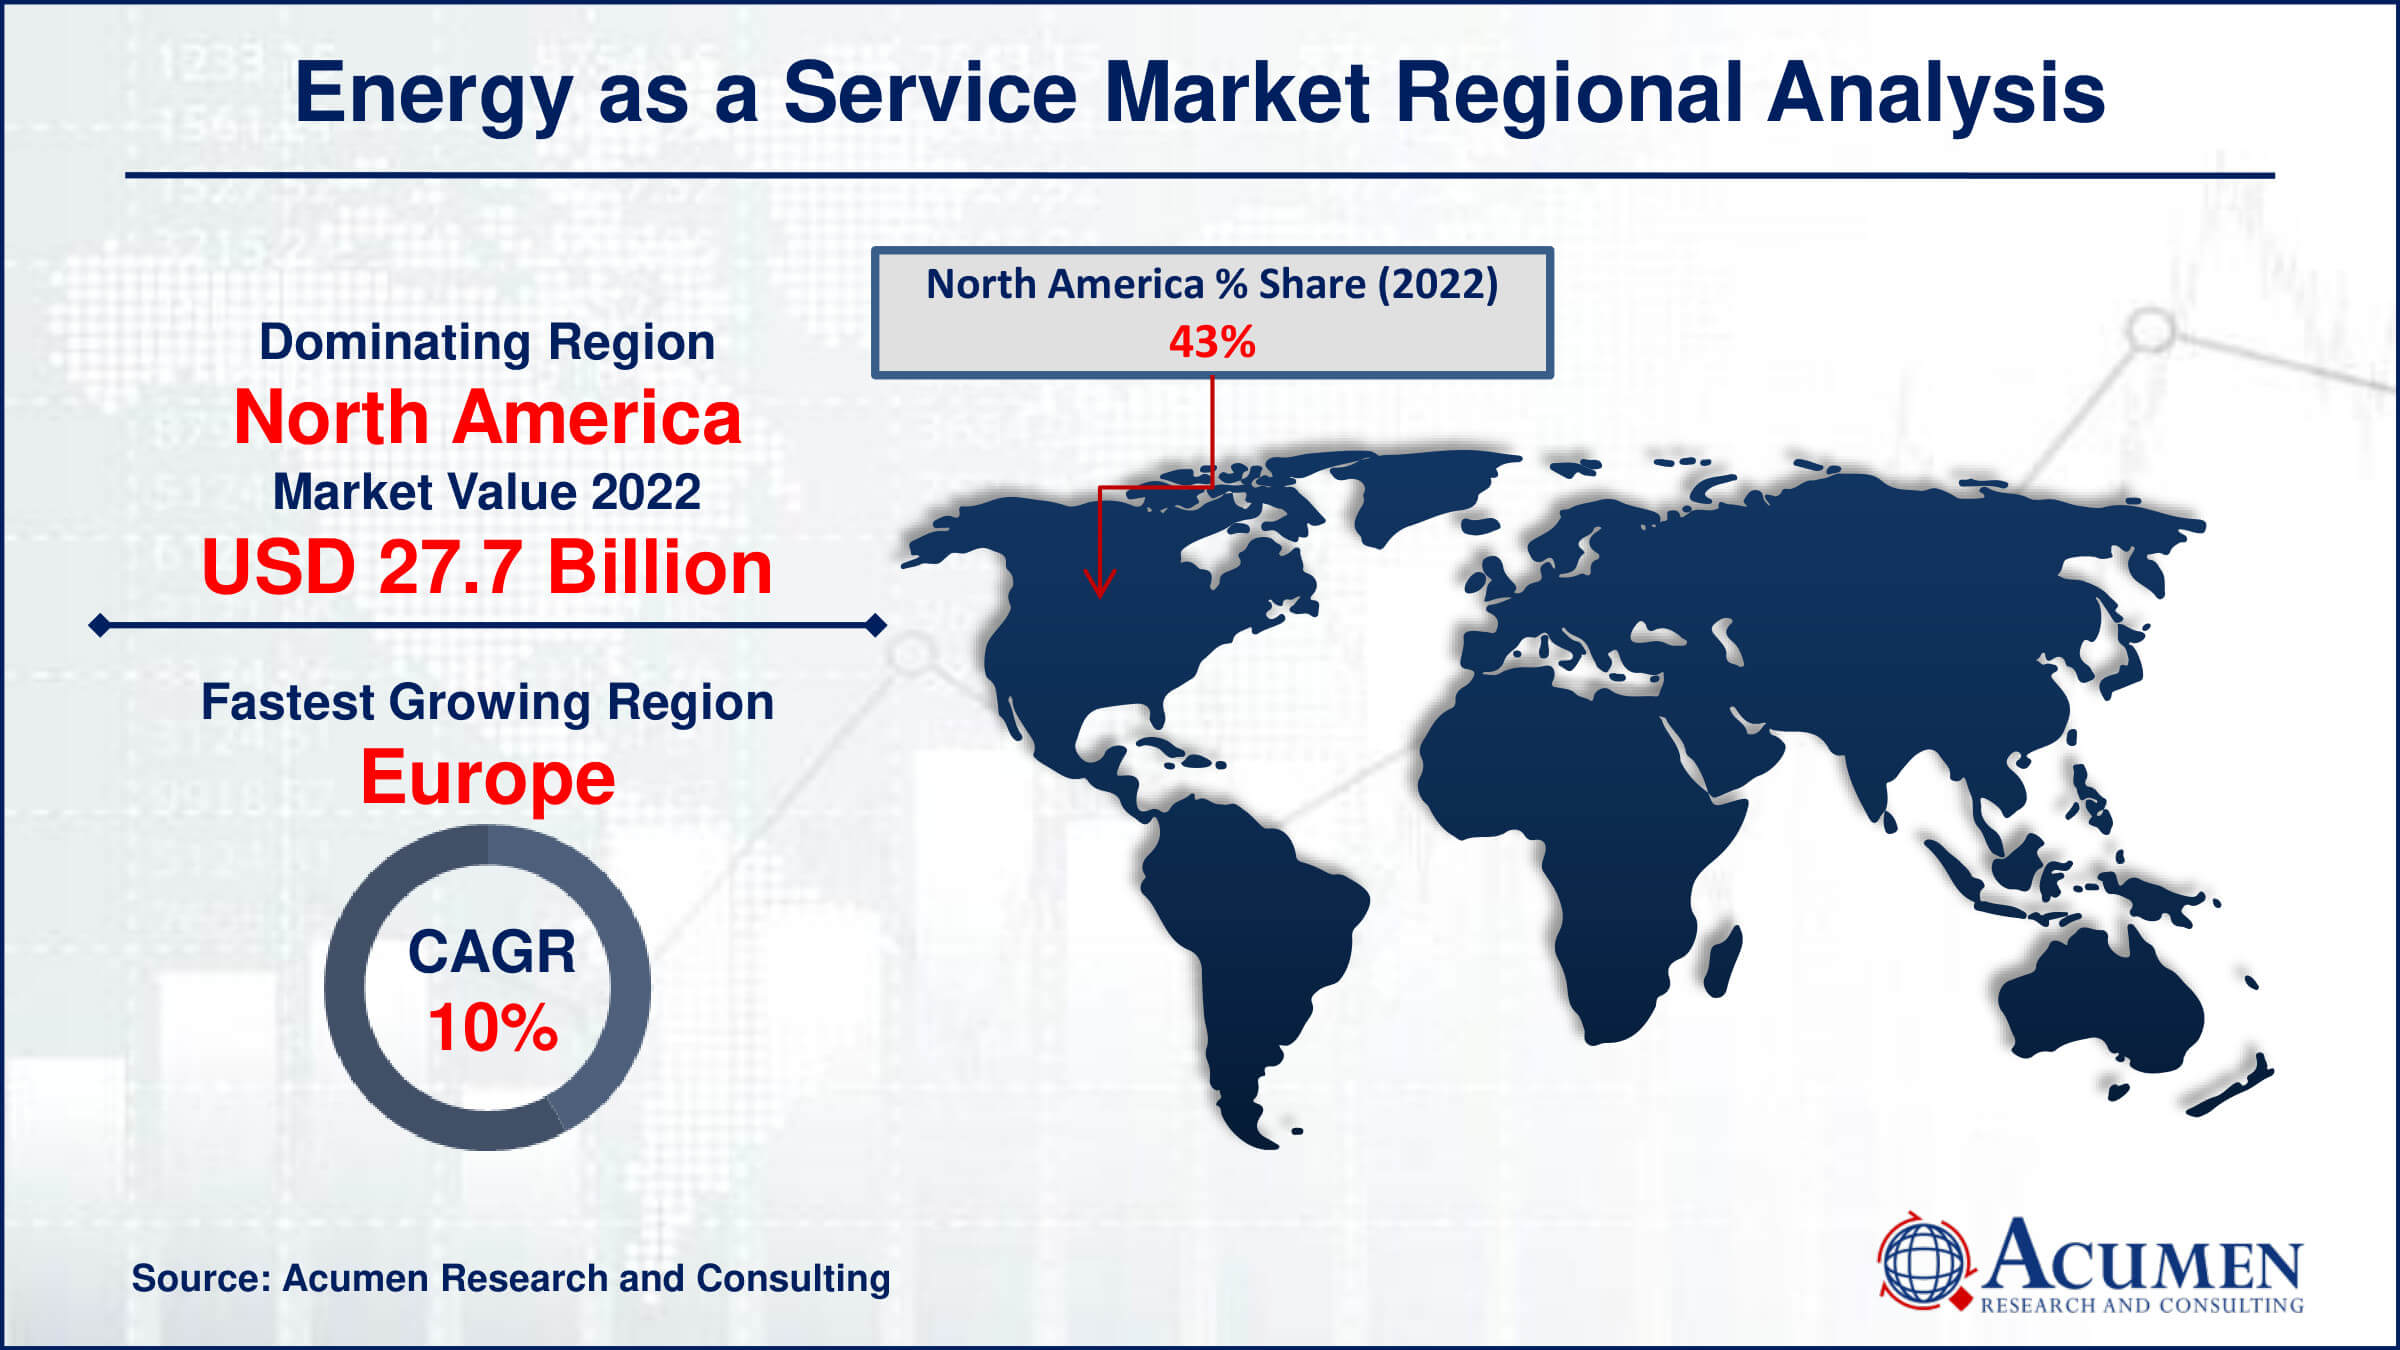
- North America energy as a service market value occupied around USD 27.7 billion in 2022
- Europe energy as a service market growth will record a CAGR of more than 10% from 2023 to 2032
- Among service type, the energy supply services sub-segment generated more that USD 27 billion revenue in 2022
- Based on end-user, the commercial sub-segment generated around 63% share in 2022
- Emergence of innovative financing models such as energy performance contracting is a popular energy as a service market trend that fuels the industry demand

Energy as a service (EaaS) embodies a transformative model in energy management, leveraging cutting-edge advancements to tailor solutions for diverse energy portfolios. This comprehensive approach integrates novel products, technologies, and financial instruments to optimize various facets of energy consumption. By encompassing planning, system management, energy procurement, resource allocation, and asset oversight, EaaS provides a holistic framework for clients to achieve efficiency and sustainability goals. Collaboration with third-party stakeholders, including manufacturers and distributors, enriches EaaS offerings, fostering access to innovative solutions and expertise. Moreover, EaaS encourages the exploration of inventive business strategies, such as niche technical innovations and strategic acquisitions, to further enhance energy portfolios. For instance, initiatives like power purchase agreements (PPAs) facilitate the seamless integration of renewable sources like solar power, while strategic contracting in deregulated retail electricity sectors promotes flexibility and cost-effectiveness. In essence, EaaS represents a dynamic and collaborative approach to energy management, driving towards a more resilient and sustainable future.
Global Energy as a Service Market Dynamics
Market Drivers
- Increasing demand for energy efficiency solutions
- Growing adoption of renewable energy sources
- Focus on cost optimization and operational efficiency
- Technological advancements in energy management systems
Market Restraints
- Initial high implementation costs
- Lack of awareness and education about EaaS
- Regulatory uncertainties and policy changes
Market Opportunities
- Expansion of smart city initiatives
- Rising investments in green infrastructure
- Integration of Internet of Things (IoT) in energy management
Energy as a Service Market Report Coverage
| Market | Energy as a Service (EaaS) Market |
| Energy as a Service (EaaS) Market Size 2022 | USD 64.5 Billion |
| Energy as a Service (EaaS) Market Forecast 2032 | USD 159.4 Billion |
| Energy as a Service (EaaS) Market CAGR During 2023 - 2032 | 9.6% |
| Energy as a Service (EaaS) Market Analysis Period | 2020 - 2032 |
| Energy as a Service (EaaS) Market Base Year |
2022 |
| Energy as a Service (EaaS) Market Forecast Data | 2023 - 2032 |
| Segments Covered | By Service Type, By Component, By End-User, And By Geography |
| Regional Scope | North America, Europe, Asia Pacific, Latin America, and Middle East & Africa |
| Key Companies Profiled | EDF Energy, Duke Energy, Edison International, Southern Company, Engie, Schneider Electric SE, Siemens AG, General Electric, WGL Energy, and Orsted. |
| Report Coverage |
Market Trends, Drivers, Restraints, Competitive Analysis, Player Profiling, Covid-19 Analysis, Regulation Analysis |
Energy as a Service Market Insights
The energy sector is experiencing growth and transformation driven by various market dynamics. Alongside the factors mentioned earlier, such as the expansion of energy delivery infrastructure and the decreasing costs of solar electricity production, there's a notable shift towards sustainability and environmental preservation. This shift, embraced by corporations, governments, and consumers alike, is fostering increased demand for renewable energy sources and influencing policy decisions in favor of clean energy projects. Technological innovations, including advancements in energy storage, smart grid infrastructure, and renewable energy technologies, are reshaping the energy market landscape. These innovations enhance productivity, reduce costs, and enable seamless integration of renewable energy sources into existing networks.
Market liberalization and deregulation initiatives are further enhancing competitiveness and driving exploration of novel business strategies and revenue streams. This competitive environment encourages investment in renewable energy projects and fosters adoption of cutting-edge energy solutions and services. Additionally, geopolitical issues and global economic trends play a significant role in shaping energy markets. Changes in trade rules, energy costs, and geopolitical tensions can impact global supply chains, market dynamics, and investment decisions. Furthermore, evolving consumer preferences, such as the rise of prosumers and the increasing demand for energy independence and electric vehicles, are driving the need for adaptable and sustainable energy solutions.
Energy as a Service Market Segmentation
The worldwide market for energy as a service is split based on service type, component, end-user, and geography.
EaaS Market by Service Types
- Energy Supply Services
- Operational and Maintenance Services
- Energy Efficiency and Optimization Services
Accordning to the energy as a service industry analysis, the energy supply services section of the market comprises various solutions that are designed to furnish clients with dependable and economical energy provision. Purchasing energy resources like electricity, natural gas, or renewable energy sources like solar or wind power is included in this. Businesses in this industry source, buy, and deliver energy supplies, guaranteeing customers have reliable access to power while maximising profits and lowering risks. Through the utilisation of cutting-edge technologies, economies of scale, and industry knowledge, companies in this sector allow companies to concentrate on their main business activities while effectively satisfying their energy requirements. Because energy supply plays such a critical role in supporting a wide range of sectors and organisations, this category usually holds the greatest share of the energy as a service market.
EaaS Market by Components
- Solution
- Services
The services category usually makes up the majority of the market for energy as a service (EaaS). This is due to the fact that EaaS focuses more on offering consumers complete energy solutions and services than it does on selling them individual goods. A wide range of services, including energy supply, maintenance and operation, energy efficiency and optimisation, and more, are included in the services section. These services address all facets of energy management, from distribution and purchase to upkeep and optimisation, and are customised to fit the unique requirements of companies and institutions. The Services segment is the cornerstone of the energy industry because service providers enable clients to efficiently achieve their energy goals, decrease costs, minimise risks, and improve overall operational performance by using professional knowledge, cutting-edge technologies, and industry best practices.
EaaS Market by End-Users
- Government
- Commercial
- Industrial
The commercial segment is the largest end user category in the energy as a service (EaaS) market. This is mainly because companies in commercial sectors including retail, hotel, healthcare, and office spaces have adopted energy management solutions and services on a large scale. Energy requirements for commercial organisations are often varied and include, but are not limited to, lighting, heating, cooling, and power. These companies can obtain complete solutions designed to maximise energy use, cut expenses, and improve sustainability by collaborating with EaaS suppliers. Demand for energy-efficient solutions is further fueled by the commercial sector's frequent pressure to comply with environmental standards and exhibit corporate responsibility. As a result, the commercial segment now controls the majority of the EaaS market as companies place a higher priority on environmental stewardship, cost reduction, and energy efficiency.
EaaS Market Regional Outlook
North America
- U.S.
- Canada
Europe
- U.K.
- Germany
- France
- Spain
- Rest of Europe
Asia-Pacific
- India
- Japan
- China
- Australia
- South Korea
- Rest of Asia-Pacific
Latin America
- Brazil
- Mexico
- Rest of Latin America
The Middle East & Africa
- South Africa
- GCC Countries
- Rest of the Middle East & Africa (ME&A)

Energy as a Service Market Regional Analysis
In terms of energy as a service market analysis, The involvement of intelligent design and building automation vendors is expected to make North America the main geographic market. Key players are likely to reduce service delivery costs and enhance customer experience. The rise of major corporations is projected to lead the market in Asia Pacific. For instance, India had over 300 planned $2 billion worth of smart city projects. Although the energy market remains in its early stages in the country, the depletion of fossil fuels for electricity production in the coming years will provide growth opportunities for the market. Additionally, factors such as the implementation of green building models and increased policy funding will drive regional development. Thanks to the presence of several major service providers, the European industry is expected to experience substantial growth over the energy as a service industry forecast period. The emergence of SMEs, mainly in Belgium, Cyprus, and Greece, is expected to create opportunities for growth in the field.
Energy as a Service Market Players
Some of the top energy as a service companies offered in our report includes EDF Energy, Duke Energy, Edison International, Southern Company, Engie, Schneider Electric SE, Siemens AG, General Electric, WGL Energy, and Orsted.
Frequently Asked Questions
How big is the energy as a service market?
The Energy as a Service Market was valued at USD 64.5 billion in 2022.
What is the CAGR of the global energy as a service market from 2023 to 2032?
The CAGR of energy as a service is 9.6% during the analysis period of 2023 to 2032.
Which are the key players in the energy as a service market?
The key players operating in the global market are including EDF Energy, Duke Energy, Edison International, Southern Company, Engie, Schneider Electric SE, Siemens AG, General Electric, WGL Energy, and Orsted
Which region dominated the global energy as a service market share?
North America held the dominating position in energy as a service industry during the analysis period of 2023 to 2032.
Which region registered fastest CAGR from 2023 to 2032?
Europe region exhibited fastest growing CAGR for market of energy as a service during the analysis period of 2023 to 2032.
What are the current trends and dynamics in the global energy as a service industry?
The current trends and dynamics in the energy as a service industry include increasing demand for energy efficiency solutions, growing adoption of renewable energy sources, focus on cost optimization and operational efficiency, and technological advancements in energy management systems.
Which end-user held the maximum share in 2022?
The commercial end-user held the maximum share of the energy as a service industry.


