Embolic Protection Devices Market Size - Global Industry, Share, Analysis, Trends and Forecast 2024 - 2032
Published :
Report ID:
Pages :
Format :
Embolic Protection Devices Market Size - Global Industry, Share, Analysis, Trends and Forecast 2024 - 2032
Report Coverage
- Industry Dynamics
- Market Size and Forecast Data
- Segment Analysis
- Competitive Landscape
- Regional Analysis with a Niche Focus on Country-Level Data
- High Level Analysis - Porter's, PESTEL, Value Chain, etc.
- Company Profiles of Key Players
- Option to Customize the Report As Per Your Specific Need
Request Sample Report
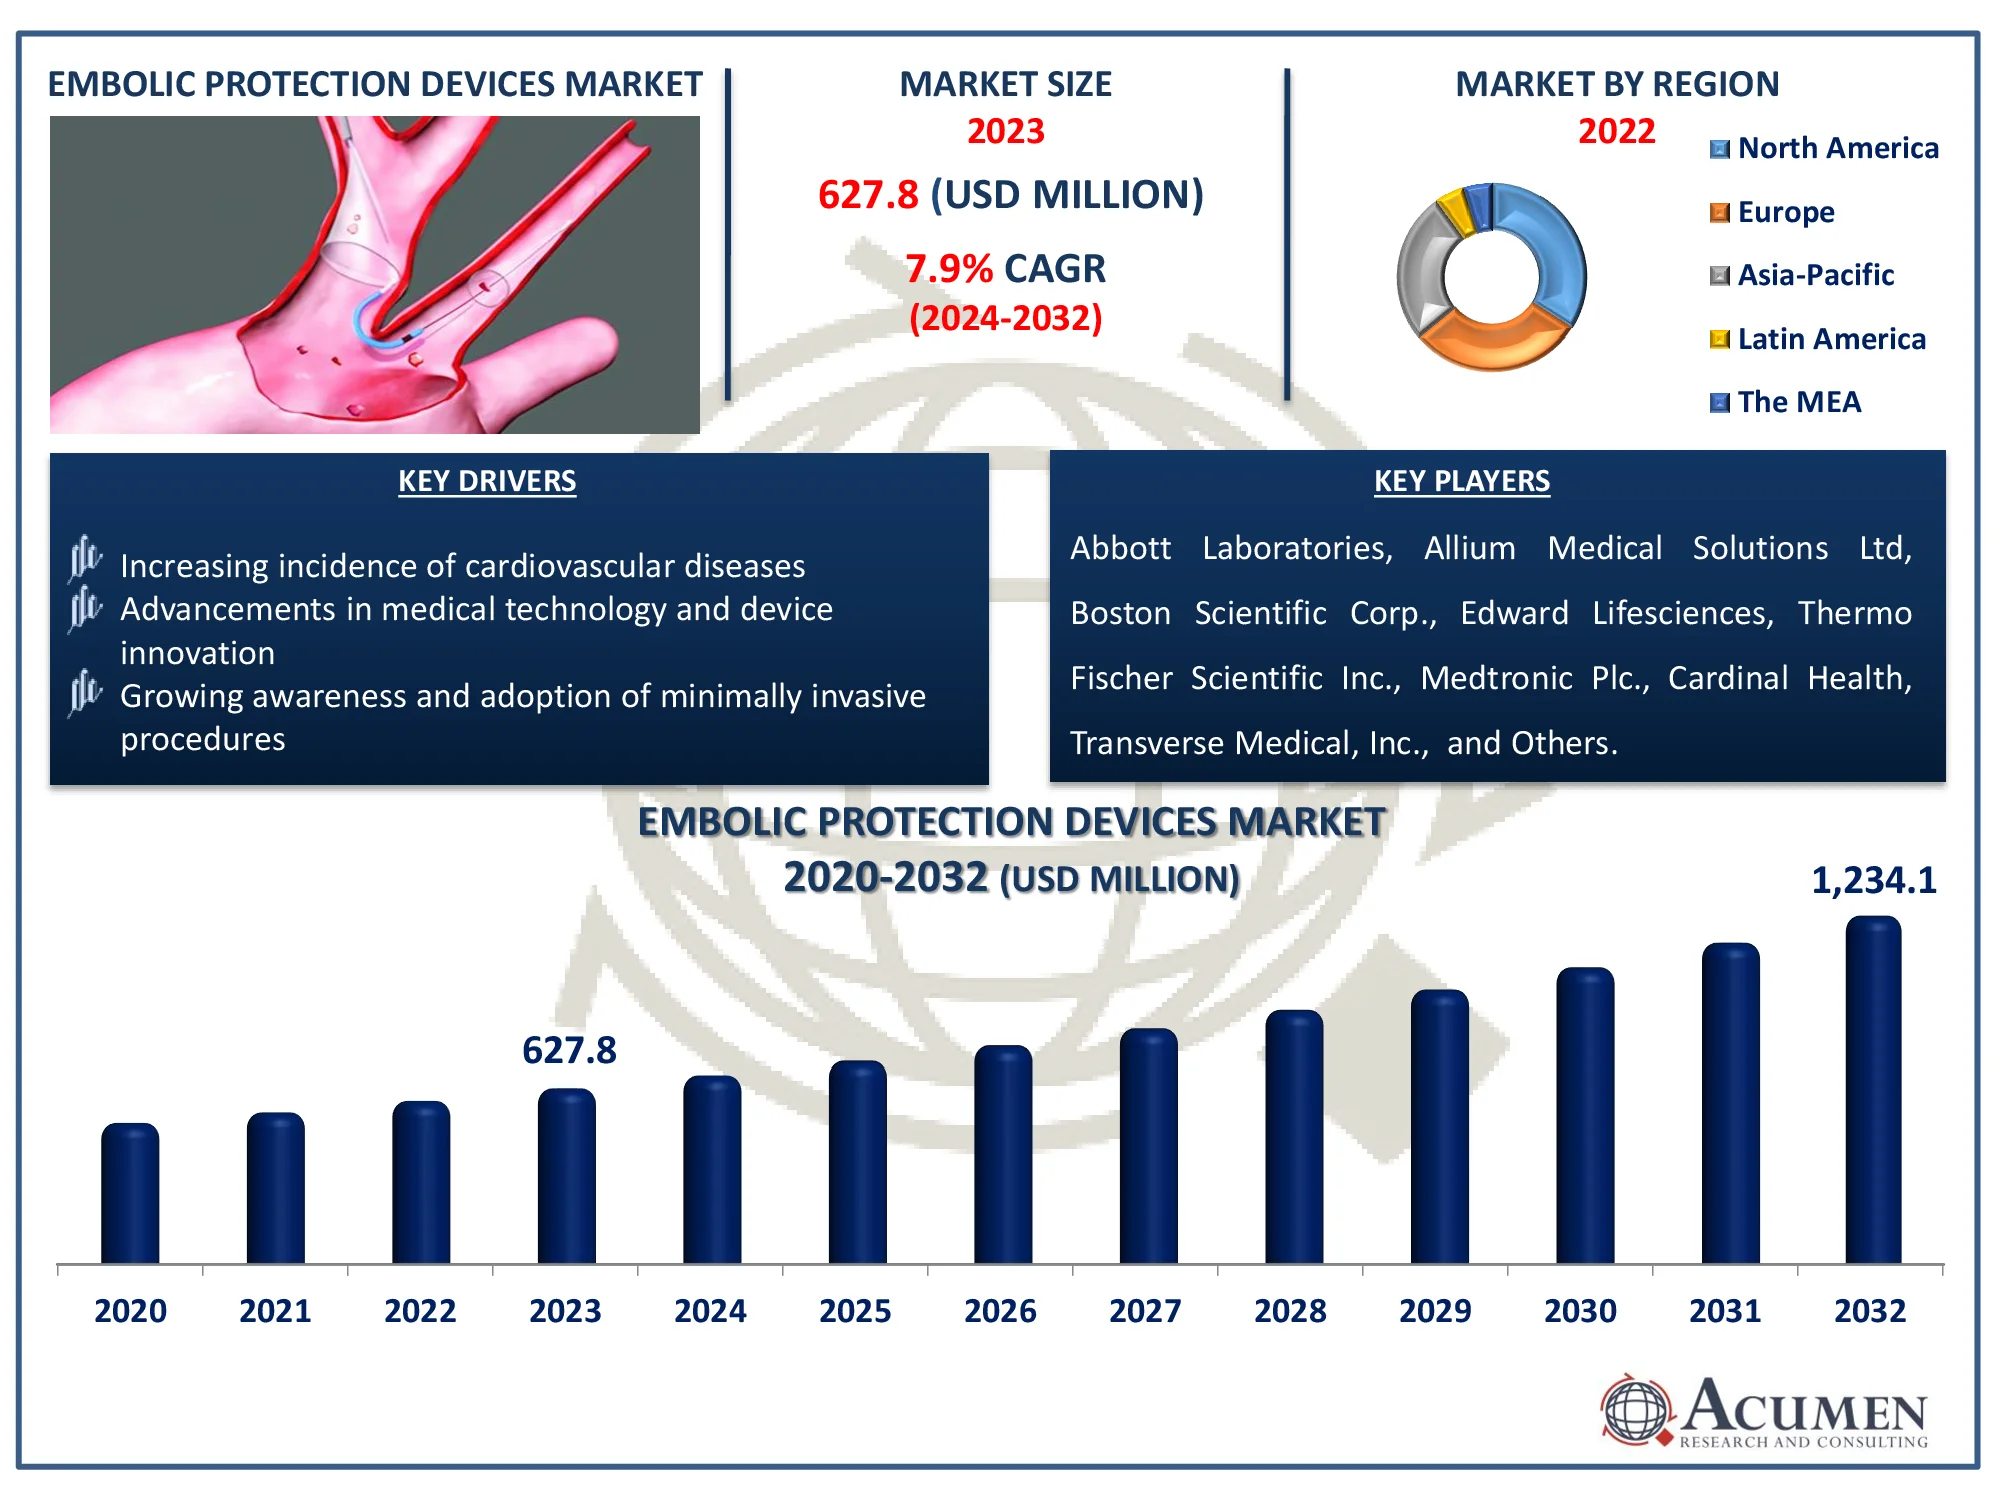
The Global Embolic Protection Devices Market Size accounted for USD 627.8 Million in 2023 and is estimated to achieve a market size of USD 1,234.1 Million by 2032 growing at a CAGR of 7.9% from 2024 to 2032.
Embolic Protection Devices Market Highlights
- Global embolic protection devices market revenue is poised to garner USD 1,234.1 million by 2032 with a CAGR of 7.9% from 2024 to 2032
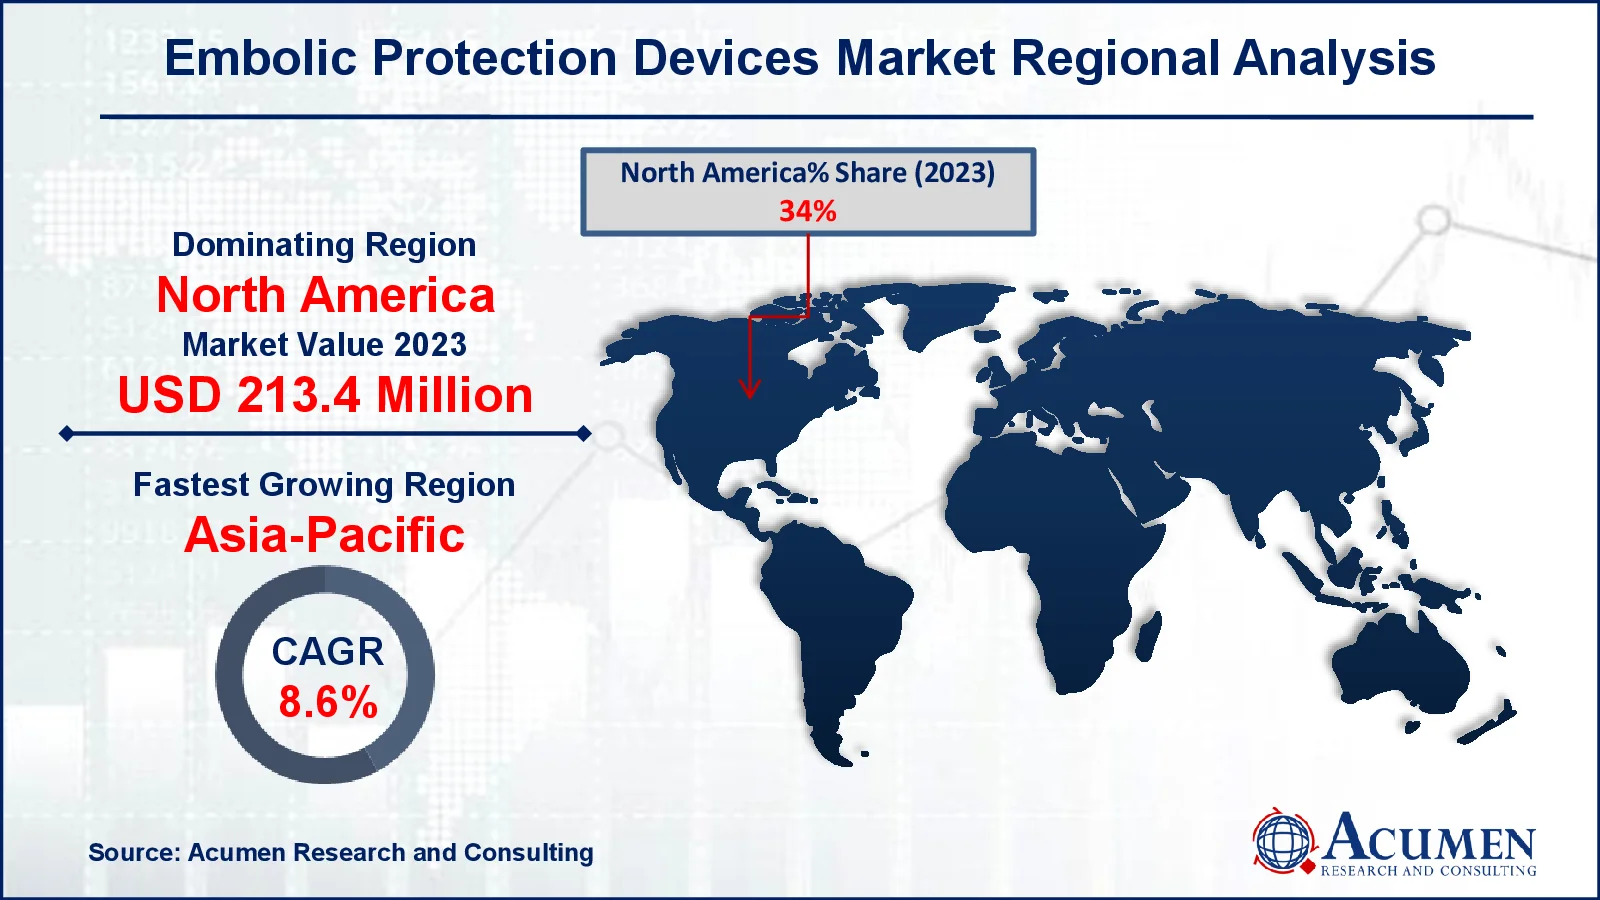
- North America embolic protection devices market value occupied around USD 213.4 million in 2023
- Asia-Pacific embolic protection devices market growth will record a CAGR of more than 8.6% from 2024 to 2032
- Among product, the distal occlusion filters sub-segment generated 63% of the market share in 2023
- Based on application, the cardiovascular diseases sub-segment generated 39% of market share in 2023
- Increasing demand for minimally invasive procedures is the embolic protection devices market trend that fuels the industry demand

Embolic protection devices (EPDs) are medical tools designed to capture and remove debris that may dislodge during vascular procedures, such as angioplasty or stent placement. These devices are crucial in preventing embolisms, which can lead to serious complications like strokes or myocardial infarctions. EPDs are commonly used in carotid artery interventions, lower extremity interventions, and coronary procedures. By trapping debris, they enhance patient safety and improve the outcomes of minimally invasive vascular surgeries. EPDs are available in various forms, including distal filters and proximal occlusion balloons, each tailored to specific clinical needs. Their use has become standard practice in high-risk patients undergoing percutaneous interventions.
Global Embolic Protection Devices Market Dynamics
Market Drivers
- Increasing incidence of cardiovascular diseases
- Advancements in medical technology and device innovation
- Growing awareness and adoption of minimally invasive procedures
Market Restraints
- High cost of embolic protection devices
- Stringent regulatory approvals and standards
- Limited reimbursement and insurance coverage
Market Opportunities
- Rising demand in emerging markets
- Development of next-generation embolic protection devices
- Expansion of procedural applications and indications
Embolic Protection Devices Market Report Coverage
| Market | Embolic Protection Devices Market |
| Embolic Protection Devices Market Size 2022 |
USD 627.8 Million |
| Embolic Protection Devices Market Forecast 2032 | USD 1,234.1 Million |
| Embolic Protection Devices Market CAGR During 2023 - 2032 | 7.9% |
| Embolic Protection Devices Market Analysis Period | 2020 - 2032 |
| Embolic Protection Devices Market Base Year |
2022 |
| Embolic Protection Devices Market Forecast Data | 2023 - 2032 |
| Segments Covered | By Product, By Application, By End-User, And By Geography |
| Regional Scope | North America, Europe, Asia Pacific, Latin America, and Middle East & Africa |
| Key Companies Profiled | Abbott Laboratories, Allium Medical Solutions Ltd, Boston Scientific Corp., Edward Lifesciences, Thermo Fischer Scientific Inc., Medtronic Plc., Cardinal Health Transverse Medical, Inc., Siemens Healthcare GmbH, and Gore Medical. |
| Report Coverage |
Market Trends, Drivers, Restraints, Competitive Analysis, Player Profiling, Covid-19 Analysis, Regulation Analysis |
Embolic Protection Devices Market Insights
The rising prevalence of cardiovascular diseases is significantly boosting the demand for embolic protection devices. For instance, According to the World Health Organization, India accounts for one-fifth of the global deaths, particularly among the younger population. The Global Burden of Disease study indicates that India's age-standardized cardiovascular disease (CVD) death rate is 272 per 100,000 populations, significantly higher than the global average of 235. Additionally, these devices are crucial in preventing emboli, or blood clots, from traveling to critical areas during cardiovascular procedures. As the incidence of such diseases escalates, healthcare providers are increasingly turning to advanced embolic protection solutions to enhance patient outcomes. Consequently, the growing need for these devices reflects a broader trend of prioritizing safety and effectiveness in cardiovascular treatments.
The high cost of embolic protection devices (EPDs) poses a significant restraint on the market by limiting their accessibility and adoption, particularly in cost-sensitive healthcare systems. This elevated price point can deter both healthcare providers and patients from utilizing these devices, potentially impacting patient outcomes and procedural efficiency. As a result, the market may experience slower growth and reduced penetration, despite the clinical benefits of EPDs. Addressing cost barriers through innovative pricing strategies or cost-effective solutions could help alleviate this restraint.
The development of next-generation embolic protection devices is driving significant growth in the embolic protection devices market. For instance, in February 2023, Medtronic plc introduced the EnVeo drug-eluting stent (DES) for treating patients with peripheral artery disease (PAD). These advanced devices offer enhanced safety and efficacy by improving blood flow protection during cardiovascular procedures. Innovations in design and technology are making these devices more reliable and user-friendly. As a result, healthcare providers are increasingly adopting these advanced solutions, expanding market opportunities and boosting industry growth.
Embolic Protection Devices Market Segmentation
The worldwide market for embolic protection devices is split based on product, application, end-user, and geography.
Embolic Protection Device Market By Product
- Distal Occlusion Filters
- Proximal Occlusion Filters
- Distal Filters
According to the embolic protection devices industry analysis, distal occlusion filters are anticipated to dominate the market due to their effectiveness in capturing debris during vascular procedures, thereby reducing the risk of distal embolization. Their minimally invasive nature, combined with improved patient outcomes, makes them a preferred choice among healthcare professionals. Additionally, advancements in filter design and increased adoption in emerging markets contribute to their growing prominence. The rising incidence of cardiovascular diseases further drives the demand for these filters.
Embolic Protection Device Market By Application
- Neurovascular Diseases
- Cardiovascular Diseases
- Peripheral Vascular Diseases
The cardiovascular diseases segment is the largest application category in the embolic protection devices market and it is expected to increase over the industry, due to their high prevalence and the associated risks of embolism during procedures such as angioplasty and stenting. The rising incidence of heart diseases drives the demand for advanced protection devices to prevent complications during cardiovascular interventions. Innovations in embolic protection technology cater to the specific needs of cardiac procedures, further solidifying this segment's dominance.
Embolic Protection Device Market By End-User
- Hospitals
- Ambulatory Surgical Centers (ASCs)
- Specialty Clinics
According to the embolic protection devices industry forecast, hospitals dominate the market due to their comprehensive infrastructure, extensive patient intake, and advanced medical facilities. These institutions handle a high volume of complex cardiovascular procedures, making them primary users of such devices. Additionally, hospitals have greater financial resources and access to cutting-edge technologies, further driving their dominance in this market.
Embolic Protection Devices Market Regional Outlook
North America
- U.S.
- Canada
Europe
- U.K.
- Germany
- France
- Spain
- Rest of Europe
Asia-Pacific
- India
- Japan
- China
- Australia
- South Korea
- Rest of Asia-Pacific
Latin America
- Brazil
- Mexico
- Rest of Latin America
The Middle East & Africa
- South Africa
- GCC Countries
- Rest of the Middle East & Africa (ME&A)

Embolic Protection Devices Market Regional Analysis
For several reasons, North America dominates the embolic protection devices market due to its advanced healthcare infrastructure, high prevalence of cardiovascular diseases, and strong focus on innovative medical technologies. The region benefits from significant investments in research and development, which drive the adoption of cutting-edge embolic protection solutions. For instance, in April 2021, Contego Medical LLC, a leading innovator in cardiovascular devices, achieved a significant milestone by obtaining the prestigious CE Mark approval for its advanced Neuroguard IEP 3-in-1 Carotid Stent and Post-Dilation Balloon System with Integrated Embolic Protection (Neuroguard IEP System). This achievement represents a major advancement in interventional cardiology. The Neuroguard IEP System features a comprehensive approach, combining a carotid stent and a post-dilation balloon with cutting-edge embolic protection technology. Additionally, favorable reimbursement policies and the presence of major market players contribute to North America's leading position in this sector.
The Asia-Pacific region is experiencing rapid growth in the embolic protection devices market due to rising healthcare investments, increasing prevalence of cardiovascular diseases, and improving healthcare infrastructure. This region's market potential is further boosted by technological advancements and supportive government policies. For instance, in March 2023, Terumo Corporation obtained a CE mark for its Zilver PTX DCB, designed for treating patients with peripheral artery disease (PAD). Additionally, the growing elderly population and increasing awareness about minimally invasive procedures contribute to this expansion.
Embolic Protection Devices Market Players
Some of the top embolic protection devices companies offered in our report includes Abbott Laboratories, Allium Medical Solutions Ltd, Boston Scientific Corp., Edward Lifesciences, Thermo Fischer Scientific Inc., Medtronic Plc., Cardinal Health, Transverse Medical, Inc., Siemens Healthcare GmbH, and Gore Medical.
Frequently Asked Questions
How big is the embolic protection devices market?
The embolic protection devices market size was valued at USD 627.8 Million in 2023.
What is the CAGR of the global embolic protection devices market from 2024 to 2032?
The CAGR of embolic protection devices is 7.9% during the analysis period of 2024 to 2032.
Which are the key players in the embolic protection devices market?
The key players operating in the global market are including Abbott Laboratories, Allium Medical Solutions Ltd, Boston Scientific Corp., Edward Lifesciences, Thermo Fischer Scientific Inc., Medtronic Plc., Cardinal Health, Transverse Medical, Inc., Siemens Healthcare GmbH, and Gore Medical.
Which region dominated the global embolic protection devices market share?
North America held the dominating position in embolic protection devices industry during the analysis period of 2024 to 2032.
Which region registered fastest CAGR from 2024 to 2032?
Asia-Pacific region exhibited fastest growing CAGR for market of embolic protection devices during the analysis period of 2024 to 2032.
What are the current trends and dynamics in the global embolic protection devices industry?
The current trends and dynamics in the embolic protection devices industry include Increasing incidence of cardiovascular diseases, advancements in medical technology and device innovation, and growing awareness and adoption of minimally invasive procedures.
Which product held the maximum share in 2023?
The distal occlusion filters product held the maximum share of the embolic protection devices industry.


