Electrical Impedance Tomography Market Size - Global Industry, Share, Analysis, Trends and Forecast 2022 - 2030
Published :
Report ID:
Pages :
Format :
Electrical Impedance Tomography Market Size - Global Industry, Share, Analysis, Trends and Forecast 2022 - 2030
Report Coverage
- Industry Dynamics
- Market Size and Forecast Data
- Segment Analysis
- Competitive Landscape
- Regional Analysis with a Niche Focus on Country-Level Data
- High Level Analysis - Porter's, PESTEL, Value Chain, etc.
- Company Profiles of Key Players
- Option to Customize the Report As Per Your Specific Need
Request Sample Report
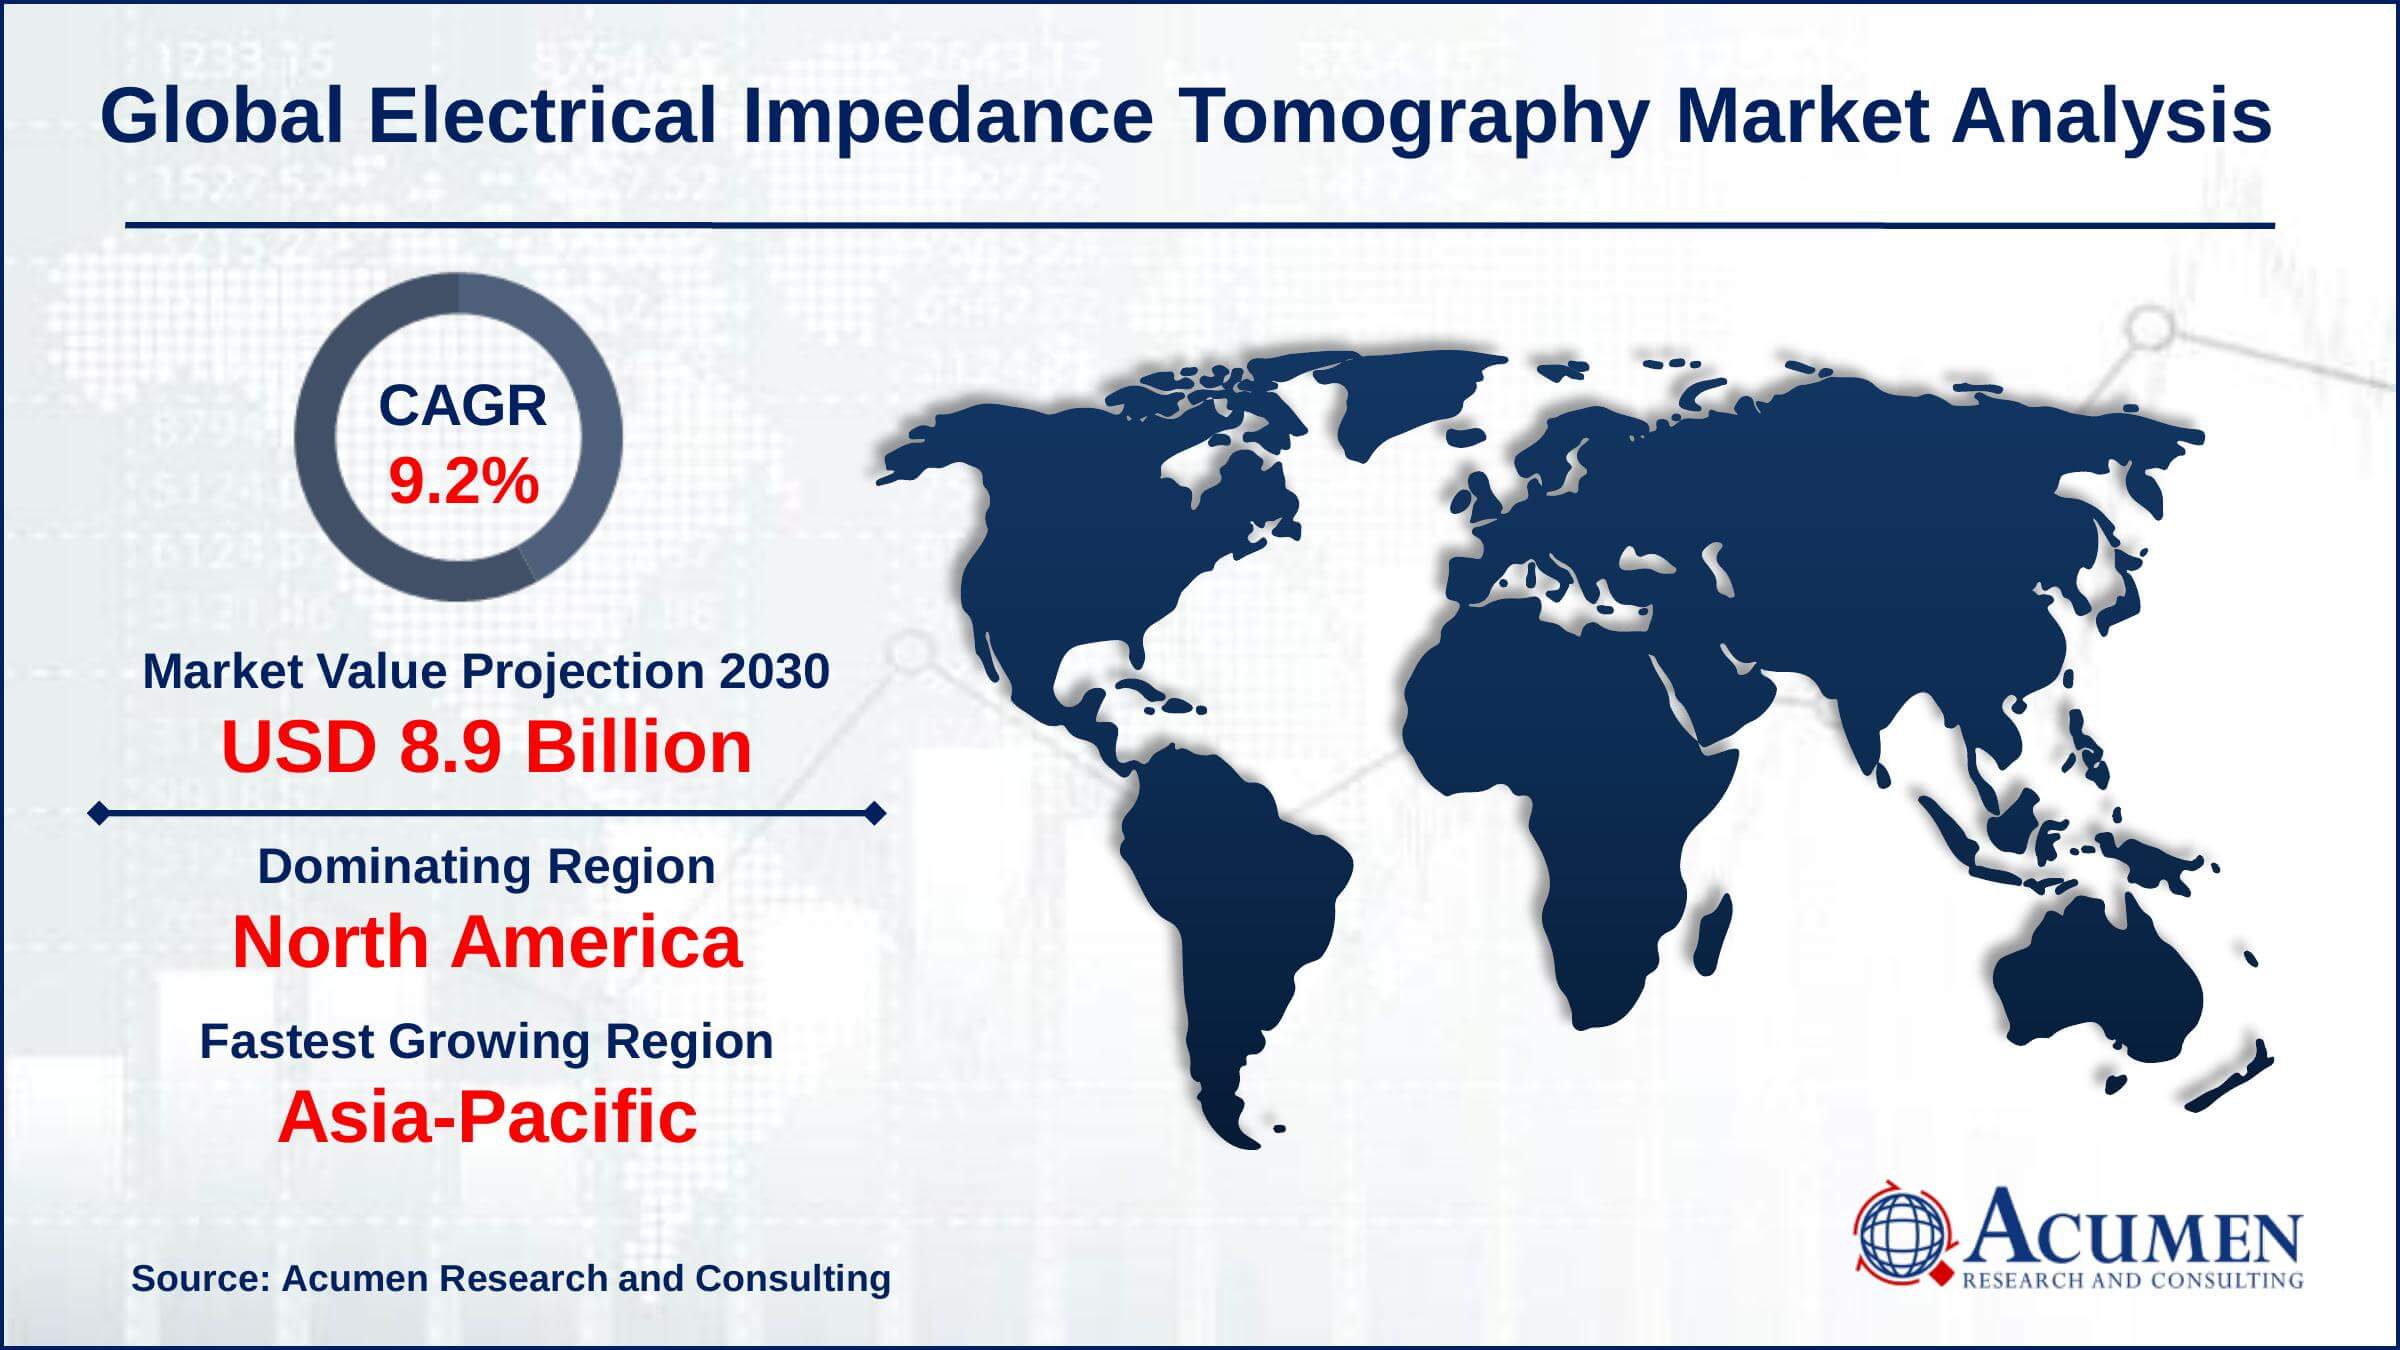
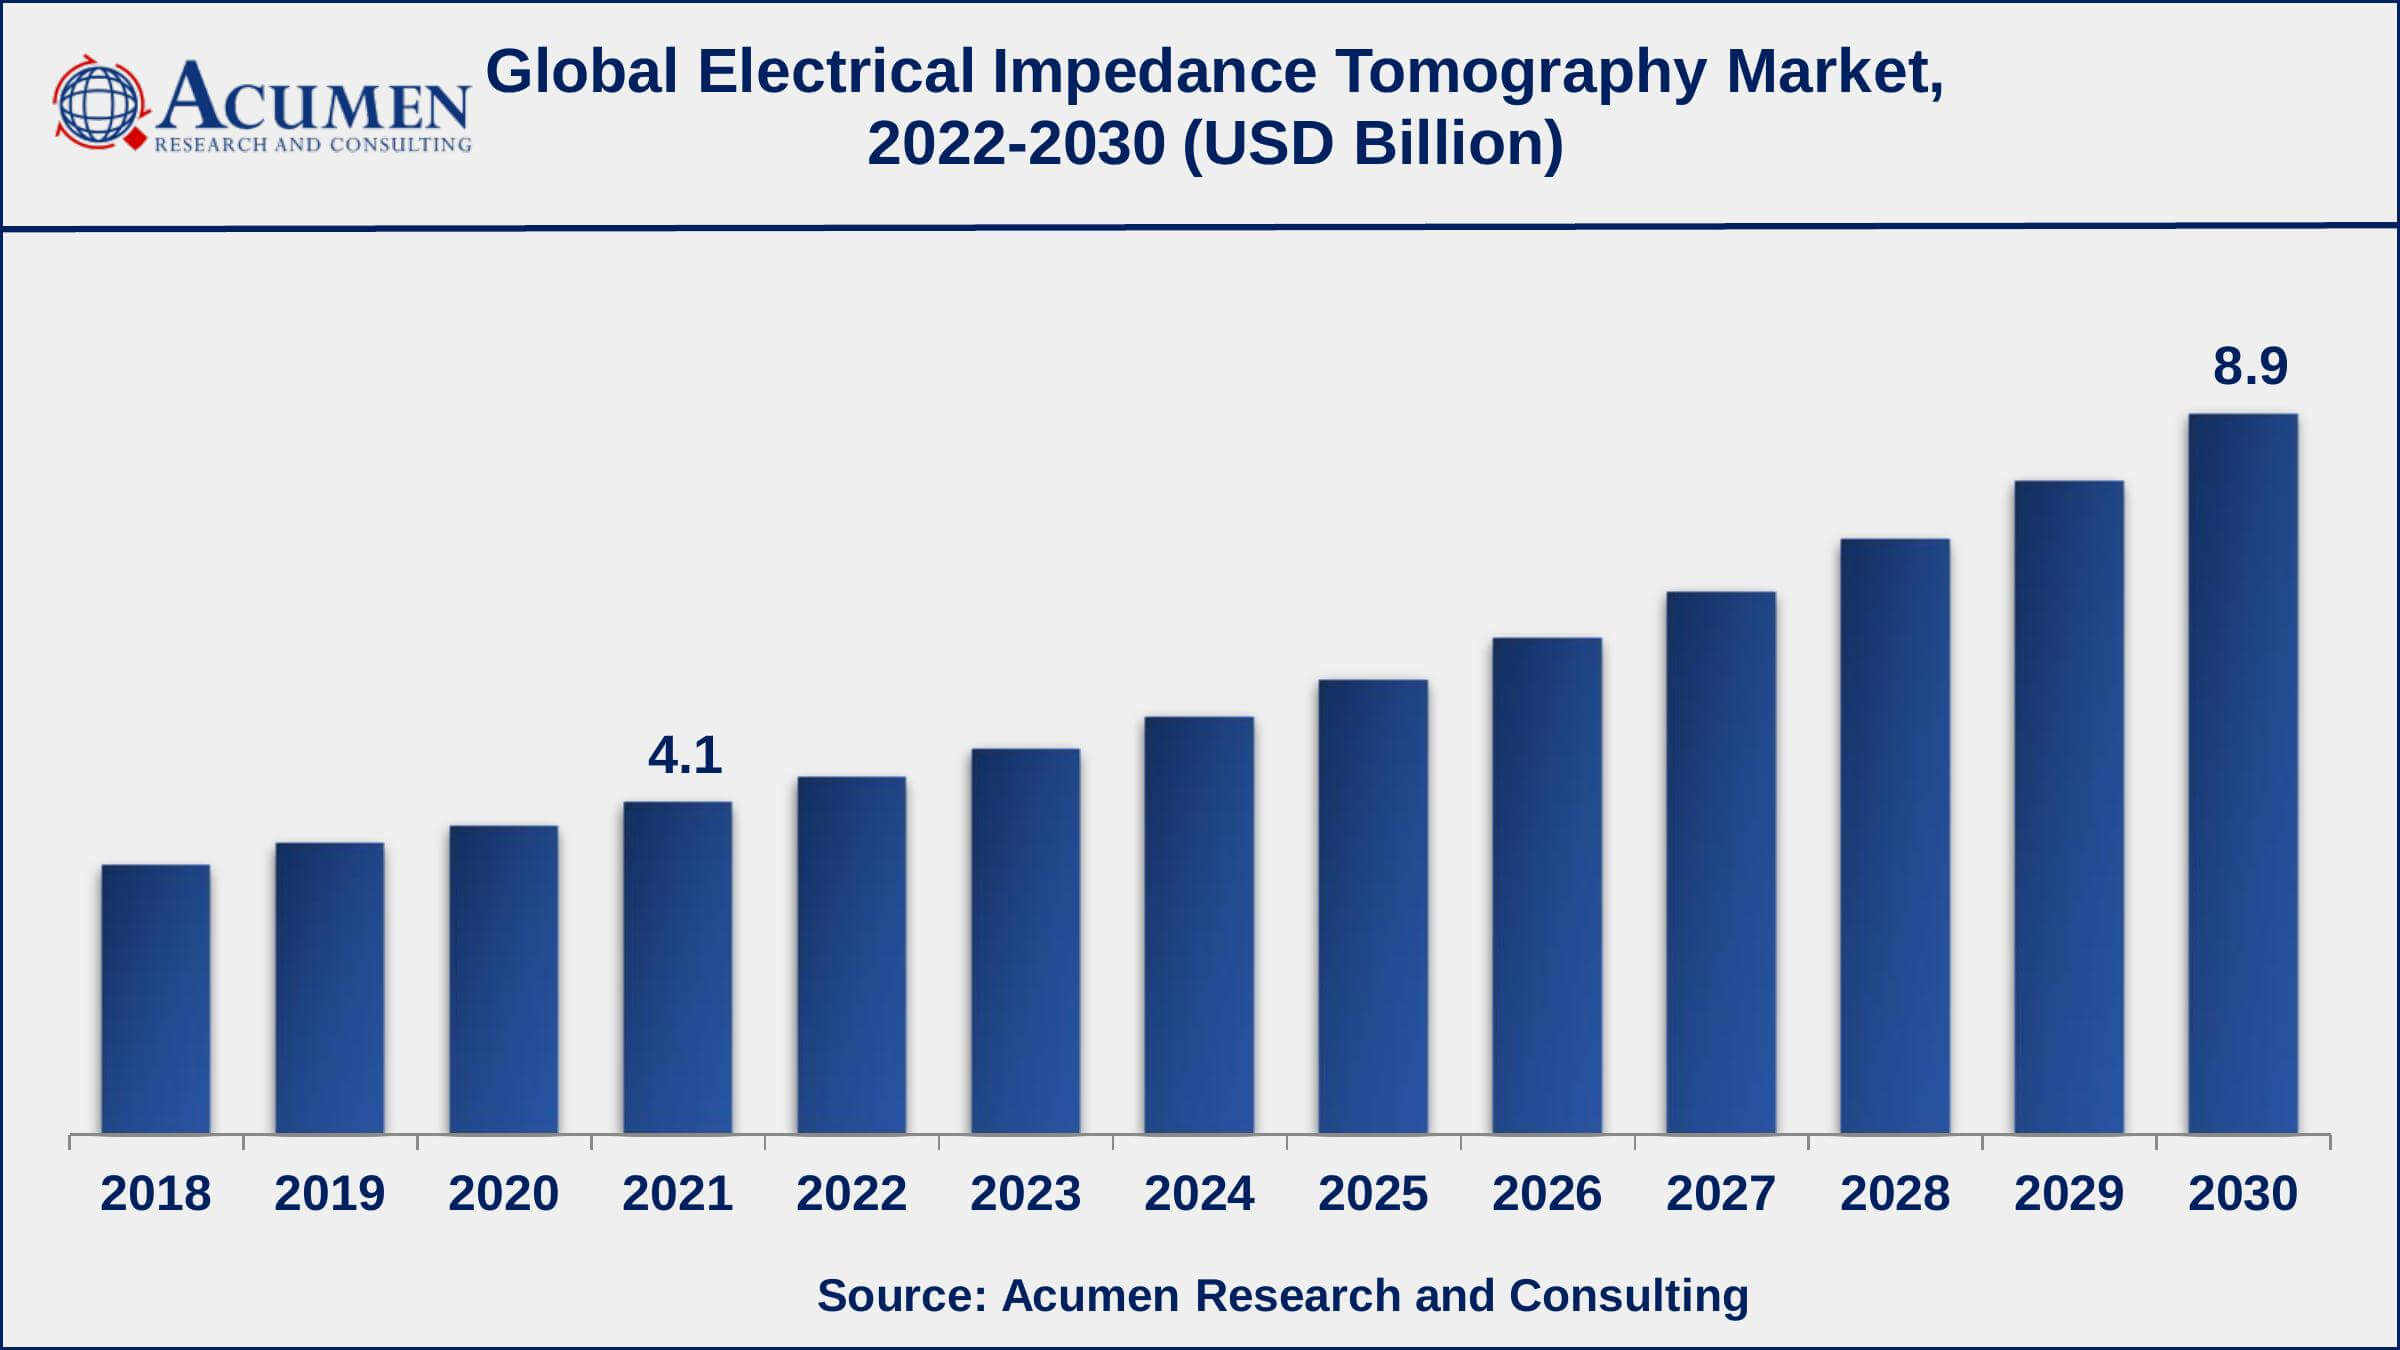
The Global Electrical Impedance Tomography Market Size gathered USD 4.1 Billion in 2021 and is set to garner a market size of USD 8.9 Billion by 2030 growing at a CAGR of 9.2% from 2022 to 2030.
Electrical impedance tomography (EIT) is a non-invasive medical imaging method that creates images of a body's interior using electrical currents. Small electrical currents are applied to the body's surface, and the resulting electrical potentials at various locations on the surface are then measured. Images of the distribution of electrical impedance within the body are produced using these measurements, and they can provide details about the composition and operation of internal organs and tissues. Although the heart and breast have also been imaged with EIT, the lungs are the organs for which it is most frequently utilized.

Electrical Impedance Tomography Market Report Statistics
- Global electrical impedance tomography market revenue is estimated to reach USD 8.9 Billion by 2030 with a CAGR of 9.2% from 2022 to 2030
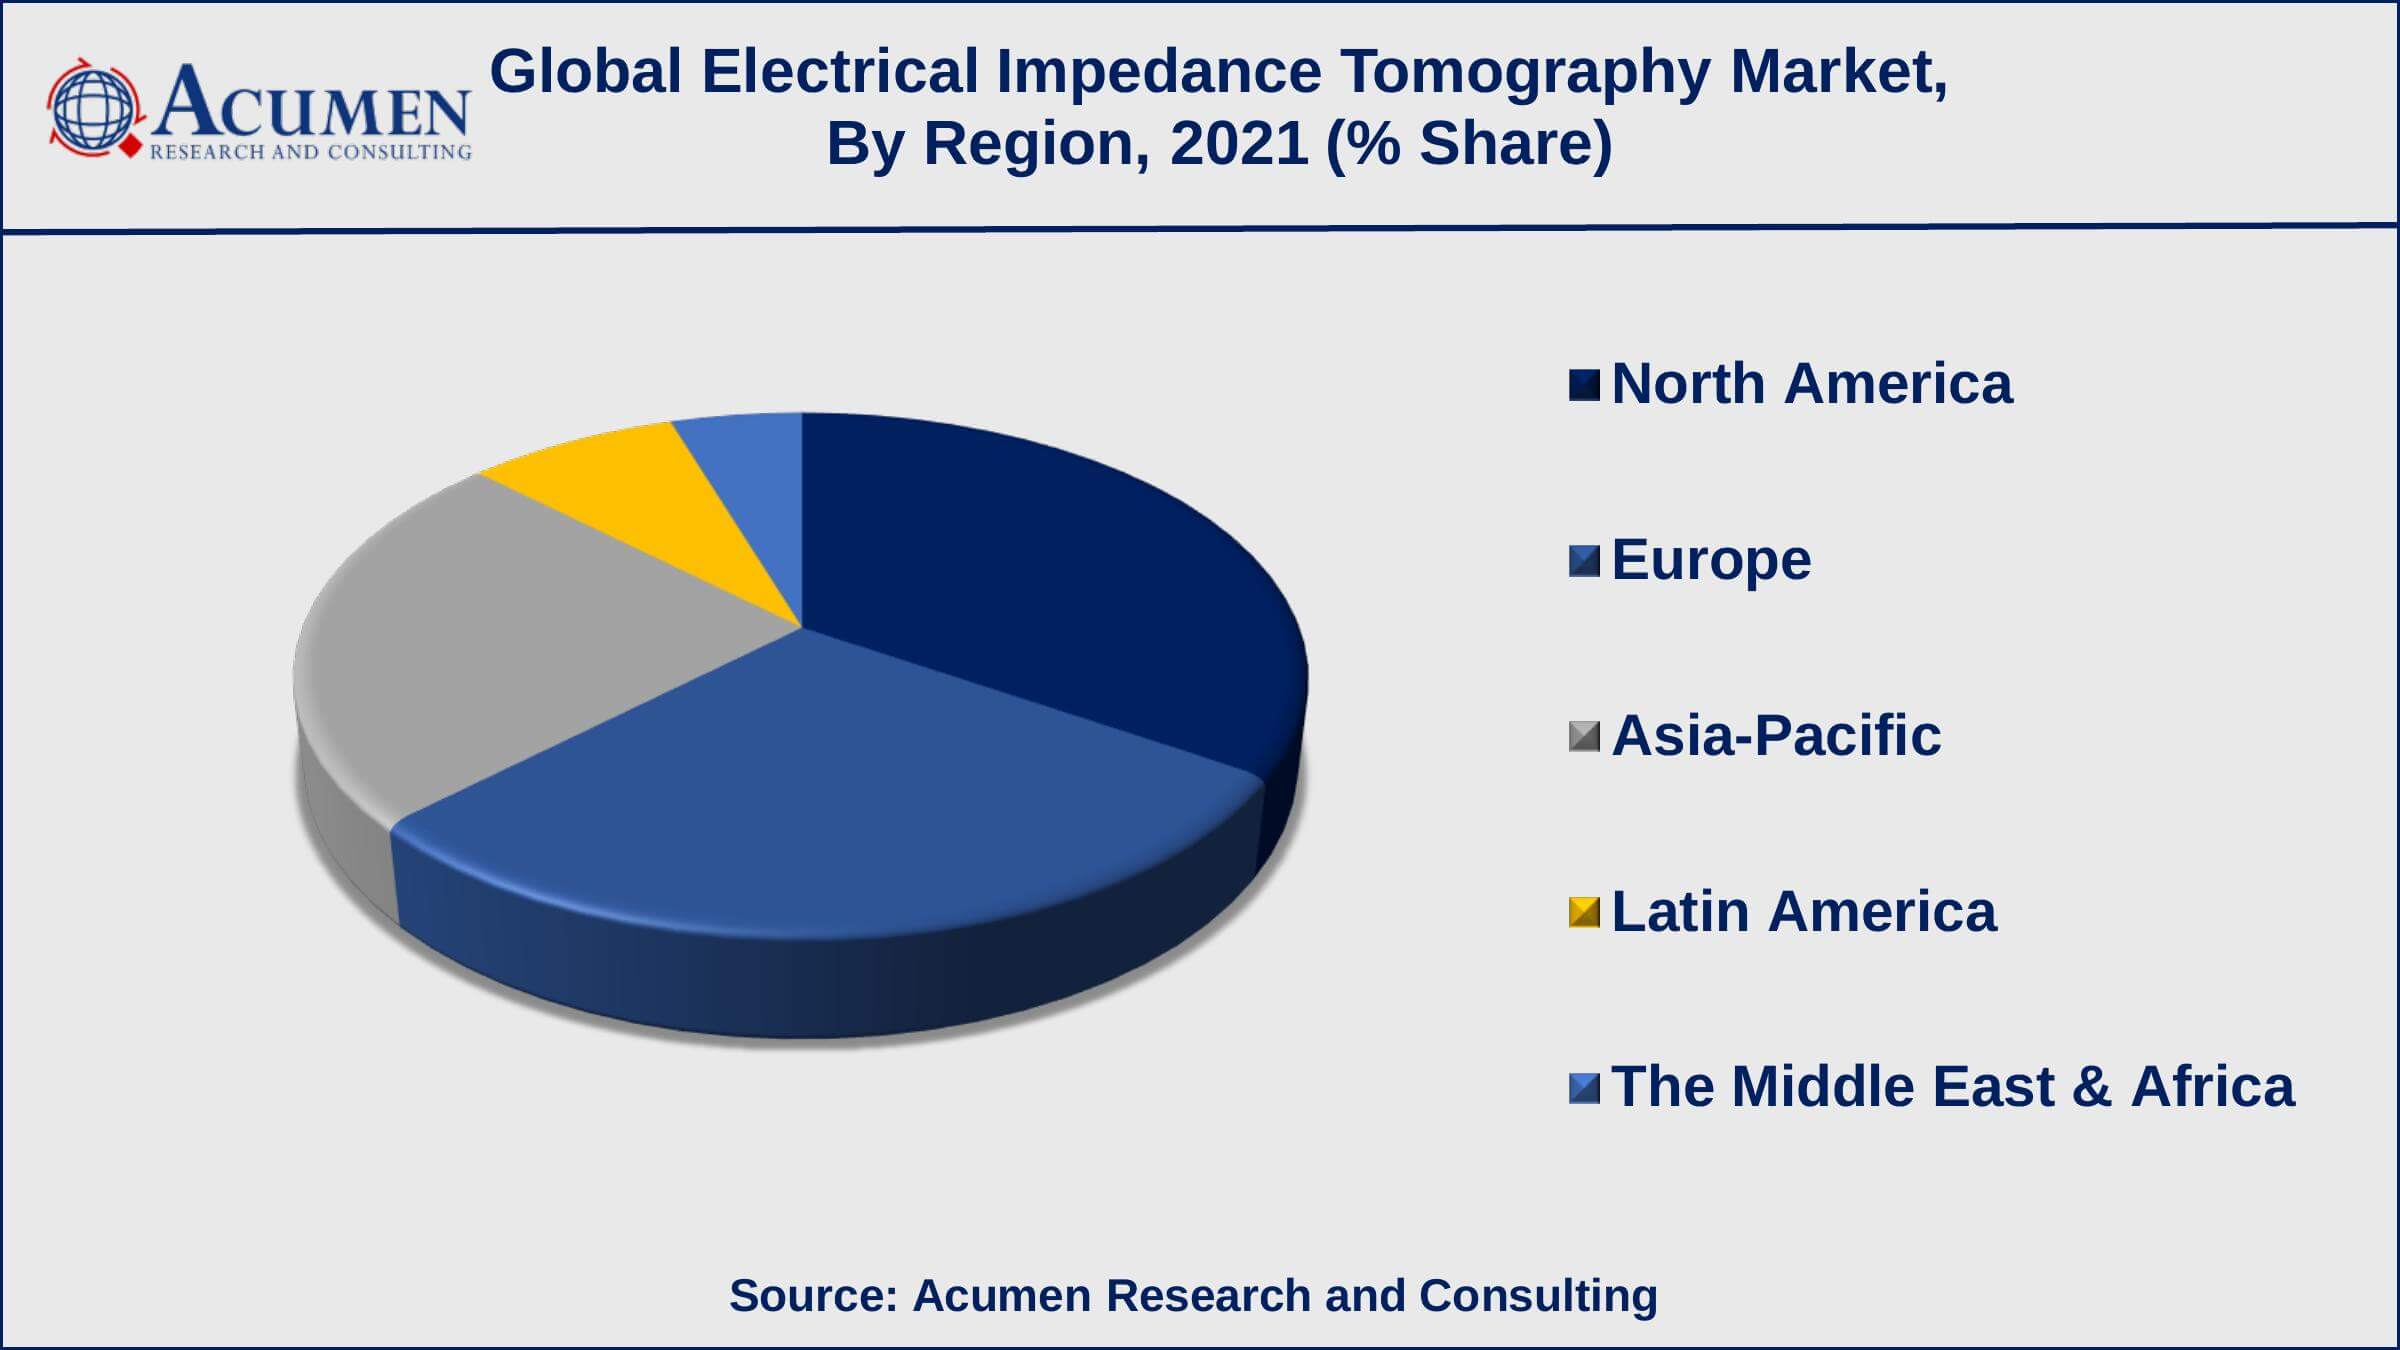
- North America electrical impedance tomography market value gathered more than USD 1.4 billion in 2021
- According to the American Cancer Society statistics (2022), more than 287,850 new cases of invasive breast cancer were diagnosed in women in the U.S.
- Additionally, as per the same statistics, there were more than 51,400 new cases of non-invasive (in situ) breast cancer in 2022
- Asia-Pacific electrical impedance tomography (EIT) market growth will record a CAGR of more than 9.5% from 2022 to 2030
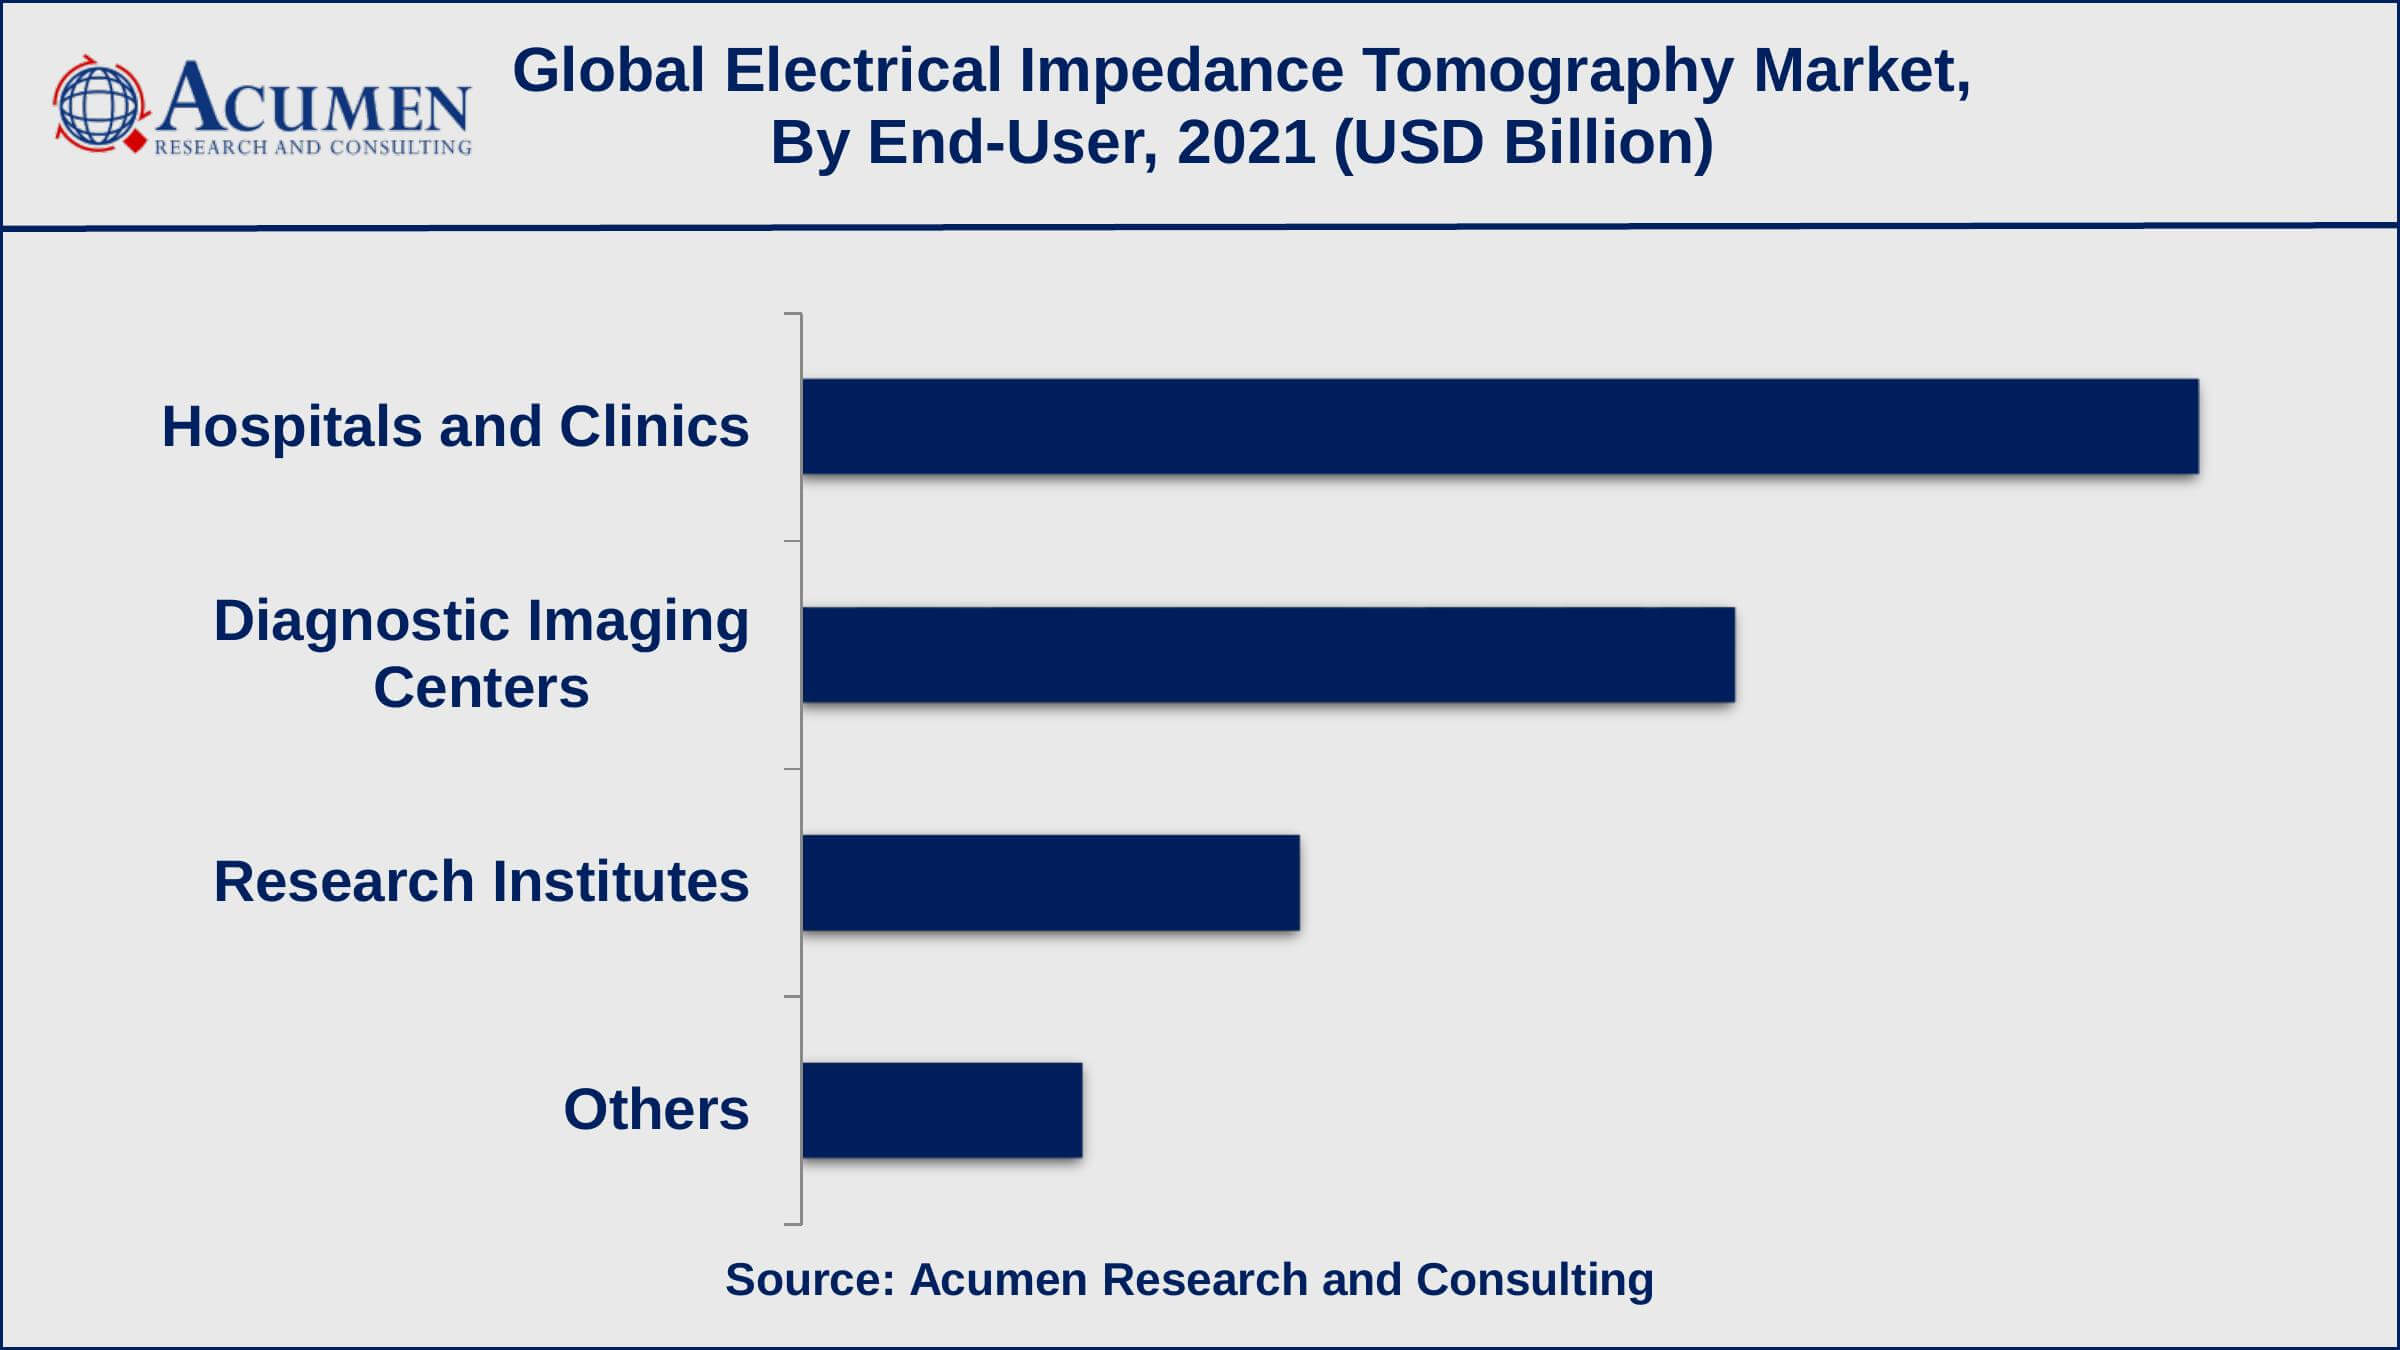
- Based on end-user, the hospitals and clinics sub-segment achieved over 45% of the share in 2021
- The growing advancement in imaging technology is a popular electrical impedance tomography market trend that drives the industry demand

Global Electrical Impedance Tomography Market Dynamics
Market Drivers
- Growing occurrence of lung diseases
- Increasing incidences of breast cancer
- Rising base of elderly patients
- Rapid technological advancements in imaging technology
Market Restraints
- Limited availability of trained professionals
- Limited clinical evidence
Market Opportunities
- Favorable government support
- Increasing adoption in emerging economies
Electrical Impedance Tomography Market Report Coverage
| Market | Electrical Impedance Tomography Market |
| Electrical Impedance Tomography Market Size 2021 | USD 4.1 Billion |
| Electrical Impedance Tomography Market Forecast 2030 | USD 8.9 Billion |
| Electrical Impedance Tomography Market CAGR During 2022 - 2030 | 9.2% |
| Electrical Impedance Tomography Market Analysis Period | 2018 - 2030 |
| Electrical Impedance Tomography Market Base Year | 2021 |
| Electrical Impedance Tomography Market Forecast Data | 2022 - 2030 |
| Segments Covered | By Product, By Application, By End-User, And By Geography |
| Regional Scope | North America, Europe, Asia Pacific, Latin America, and Middle East & Africa |
| Key Companies Profiled | Aurora Healthcare US Corp., Carestream Health, Canon Inc., Delphinus Medical Technologies, Inc, Fujifilm Holdings Corporation, GE Healthcare, Hologic, Inc., Koninklijke Philips N.V., PLANMED OY, Siemens Healthcare GmbH, and SuperSonic Imagine. |
| Report Coverage |
Market Trends, Drivers, Restraints, Competitive Analysis, Player Profiling, Covid-19 Analysis, Regulation Analysis |
Electrical Impedance Tomography EIT Market Growth Factors
Electrical impedance tomography is expected to grow in popularity because it can be used to diagnose and monitor lung diseases such as chronic obstructive pulmonary disease (COPD) and lung cancer. The growing preference for EIT over traditional imaging methods is driving the market demand. Electrical impedance tomography (EIT) is a non-invasive imaging modality that does not use ionizing radiation, which makes it safer for patients. It is also less expensive and handier than other imaging techniques such as computed tomography (CT) and magnetic resonance imaging (MRI). These factors are also supporting the electrical impedance tomography (EIT) market value. In addition to that, technological advancements in imaging systems are another factor driving the EIT market growth. The advancement of new electrical impedance tomography systems that are more accurate and user-friendly is expected to increase EIT adoption in hospitals and clinics.
The narrow availability of trained personnel may limit electrical impedance tomography adoption in some regions, limiting the market growth. EIT is a highly specialized imaging technique that necessitates the use of trained personnel to perform the equipment and interpret the images. Furthermore, while EIT has shown promise in detecting and monitoring lung diseases, clinical evidence to support its use in other indications is limited. This factor may also limit the market's growth.
Furthermore, favorable government support for the adoption of cutting-edge medical imaging technologies is expected to propel the EIT market forward in the coming years. Besides that, the growing adoption of EIT in emerging economies such as China and India is expected to create numerous growth opportunities for the market in the coming future.
Electrical Impedance Tomography (EIT) Market Segmentation
The worldwide electrical impedance tomography market is categorized based on product type, application, end-user, and geography.
Electrical Impedance Tomography Market By Product Type
- Hardware
- Software
- Services
According to our industry analysis of electrical impedance tomography, the hardware sub-segment will contribute to a sizable market share in 2021. The EIT systems and equipment used to perform EIT imaging are referred to as hardware. Electrical current generators, electrodes, amplifiers, and signal processing equipment, as well as computer systems used to analyse and display the images, are all included. EIT hardware is an essential component of the EIT imaging process, and it must be designed and manufactured to exacting standards to ensure accurate and dependable imaging results. The hardware components must be capable of producing and measuring low-frequency electrical currents, as well as processing and displaying the resulting images.
Electrical Impedance Tomography Market By Application
- Lung Imaging
- Heart Imaging
- Brain Imaging
- Breast Imaging
- Others
Based on application, the lung imaging and breast imaging sub-segments accounted for the greatest share in 2021 and are expected to continue to do so in the coming years. EIT has primarily been used to image the lungs, specifically to monitor lung ventilation, perfusion, and aeration in critically ill and chronic lung disease patients. Because it is non-invasive and does not use ionising radiation, EIT has been investigated as a potential alternative to mammography for breast imaging. EIT has the ability to be used as a parallel technique to mammography for breast imaging, according to studies, but more research is needed to fully assess its safety and effectiveness for this purpose.
Electrical Impedance Tomography Market By End-User
- Hospitals and Clinics
- Diagnostic Imaging Centers
- Research Institutes
- Others

According to the electrical impedance tomography market forecast, the hospitals and clinics end-user sub-segment will account for a sizable market share between 2022 and 2030. Because EIT is non-invasive and does not use ionizing radiation, it is a more secure option for patients. Its primary application has been to image the lungs, but it has also been used to image the heart, brain, and other organs. It has the potential to be used to aid in the diagnosis and treatment of a variety of conditions in the future. Furthermore, in diagnostic imaging centers, electrical impedance tomography (EIT) is not yet extensively used as a diagnostic tool. It is, however, being researched and developed as a potential replacement for other imaging techniques such as X-rays and CT scans.
Electrical Impedance Tomography Market Regional Outlook
North America
- U.S.
- Canada
Europe
- U.K.
- Germany
- France
- Spain
- Rest of Europe
Asia-Pacific
- India
- Japan
- China
- Australia
- South Korea
- Rest of Asia-Pacific
Latin America
- Brazil
- Mexico
- Rest of Latin America
The Middle East & Africa
- South Africa
- GCC Countries
- Rest of the Middle East & Africa (ME&A)

Electrical Impedance Tomography Market Regional Analysis
North America gathered significant revenue in 2021, according to our regional analysis, and is expected to lead the regional market in the years ahead, from 2022 to 2030. The existence of a large number of leading players in the region, as well as the increasing adoption of EIT in the monitoring and detection of lung diseases, are expected to drive significant growth in the North American electrical impedance tomography market. The electrical impedance tomography (EIT) market in Asia Pacific, on the other hand, is expected to grow at a rapid pace due to the region's increasing adoption of EIT and the region's growing geriatric population.
Electrical Impedance Tomography Market Players
Some of the leading electrical impedance tomography companies include Aurora Healthcare US Corp., Carestream Health, Canon Inc., Fujifilm Holdings Corporation, Delphinus Medical Technologies, Inc, Hologic, Inc., Koninklijke Philips N.V., GE Healthcare, PLANMED OY, Siemens Healthcare GmbH, and SuperSonic Imagine.
Frequently Asked Questions
What was the market size of the global electrical impedance tomography in 2021?
The market size of electrical impedance tomography was USD 4.1 Billion in 2021.
What is the CAGR of the global electrical impedance tomography market during forecast period of 2022 to 2030?
The CAGR of electrical impedance tomography market is 9.2% during the analysis period of 2022 to 2030.
Which are the key players operating in the market?
The key players operating in the global electrical impedance tomography market are Aurora Healthcare US Corp., Carestream Health, Canon Inc., Delphinus Medical Technologies, Inc, Fujifilm Holdings Corporation, GE Healthcare, Hologic, Inc., Koninklijke Philips N.V., PLANMED OY, Siemens Healthcare GmbH, and SuperSonic Imagine.
Which region held the dominating position in the global electrical impedance tomography market?
North America held the dominating position in electrical impedance tomography market during the analysis period of 2022 to 2030.
Which region registered the fastest growing CAGR for the forecast period of 2022 to 2030?
Asia-Pacific region exhibited fastest growing CAGR for electrical impedance tomography market during the analysis period of 2022 to 2030.
What are the current trends and dynamics in the global electrical impedance tomography market?
The current trends and dynamics in the electrical impedance tomography industry include growing occurrence of lung diseases, increasing incidences of breast cancer, and rising base of elderly patients.
Which product type held the maximum share in 2021?
The hardware product type held the maximum share of the electrical impedance tomography market.


