Electric Bus Market Size - Global Industry, Share, Analysis, Trends and Forecast 2023 - 2032
Published :
Report ID:
Pages :
Format :
Electric Bus Market Size - Global Industry, Share, Analysis, Trends and Forecast 2023 - 2032
Report Coverage
- Industry Dynamics
- Market Size and Forecast Data
- Segment Analysis
- Competitive Landscape
- Regional Analysis with a Niche Focus on Country-Level Data
- High Level Analysis - Porter's, PESTEL, Value Chain, etc.
- Company Profiles of Key Players
- Option to Customize the Report As Per Your Specific Need
Request Sample Report
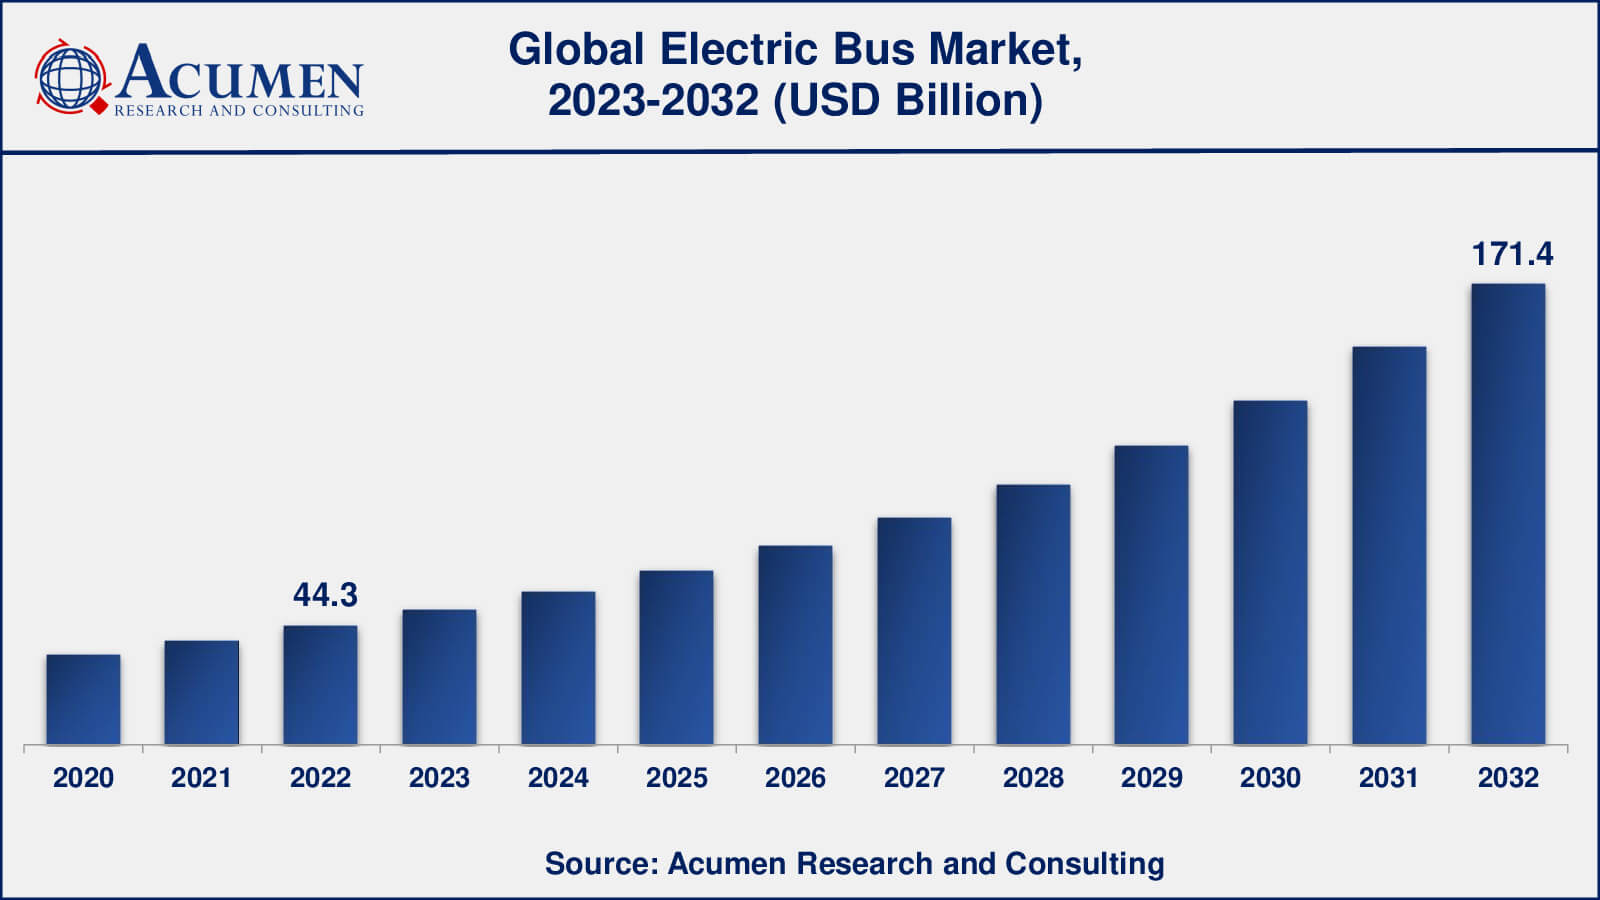
The Global Electric Bus Market Size accounted for USD 44.3 Billion in 2022 and is estimated to achieve a market size of USD 171.4 Billion by 2032 growing at a CAGR of 14.6% from 2023 to 2032.
Electric Bus Market Highlights
- Global electric bus market revenue is poised to garner USD 171.4 billion by 2032 with a CAGR of 14.6% from 2023 to 2032
- Asia-Pacific electric bus market value occupied around USD 35.4 billion in 2022
- Europe electric bus market growth will record a CAGR of more than 15% from 2023 to 2032
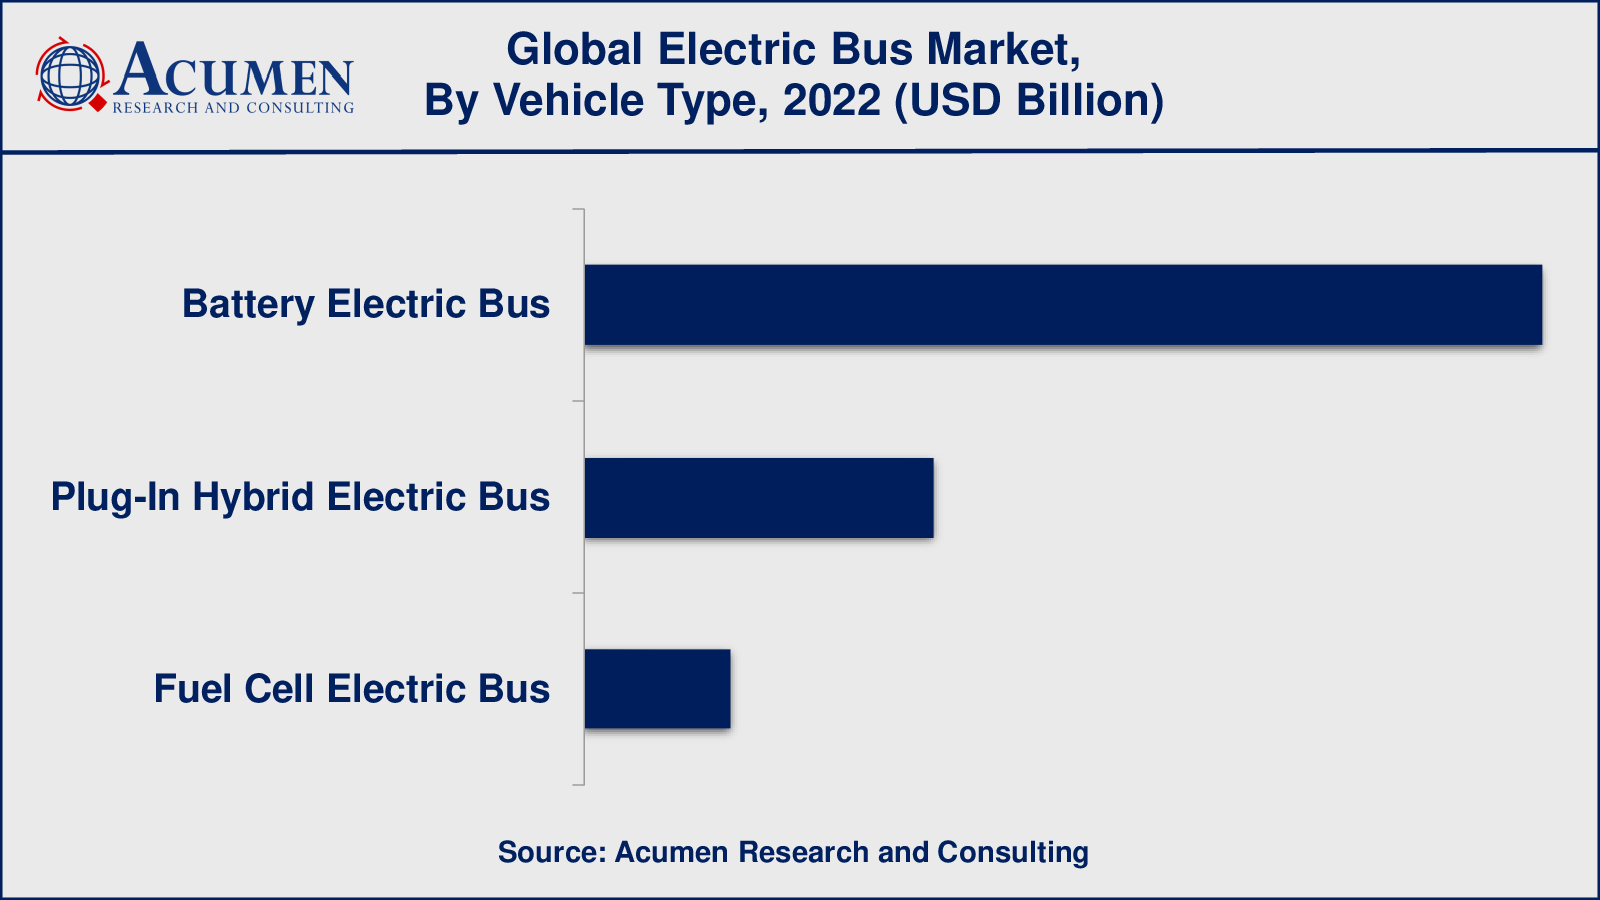
- Among vehicle type, the battery electric bus sub-segment generated over US$ 29.2 billion revenue in 2022
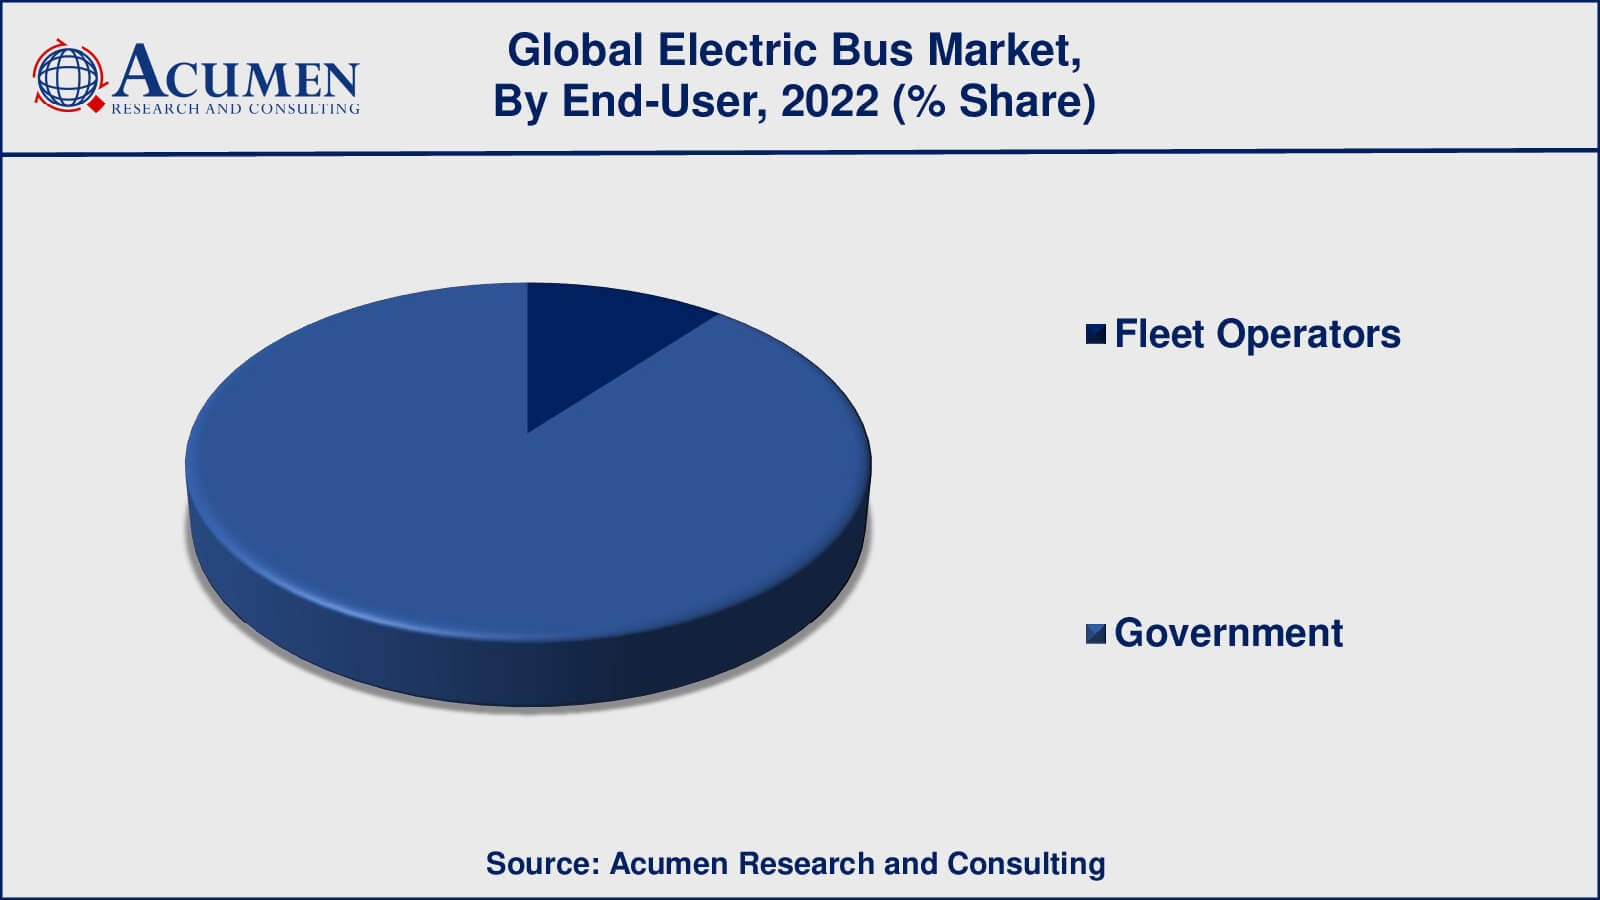
- Based on end-user, the government sub-segment generated around 89% share in 2022
- Increasing fuel-efficient and high-performance is a popular electric bus market trend that fuels the industry demand

In recent years, there has been a significant increase in the number of commercial vehicles, including cars, buses, and taxis, which has resulted in a concerning rise in air pollution. According to the World Health Organization (WHO), air pollution is responsible for approximately 100,000 deaths annually in Europe. To combat this issue, electric buses have emerged as a promising solution. These vehicles rely on electricity to operate and offer a cost-effective method for reducing emissions from traditional fuel-driven cars and buses. As a result, the global market for electric buses has been experiencing notable growth.
The demand for electric buses has been bolstered by advancements in research and technology, government support, and initiatives from the private sector. Various factors such as the increasing preference for environmentally friendly and low-emission vehicles, along with the proactive adoption of electric buses by governments, are contributing to the expansion of the electric bus market. Additionally, the growing awareness and concern for the environment are expected to drive further adoption of electric buses.

Global Electric Bus Market Dynamics
Market Drivers
- Rising in demand for fuel-efficient, high-performance, and low emission buses
- Low cost of electric vehicle batteries
- Grow in government initiatives for the promotion of e-mobility
Market Restraints
- The high installation cost of electric bus
- Lack of charging infrastructure
Market Opportunities
- Technological advancements
- Greater availability of credit and financing options
Electric Bus Market Report Coverage
| Market | Electric Bus Market |
| Electric Bus Market Size 2022 | USD 44.3 Billion |
| Electric Bus Market Forecast 2032 | USD 171.4 Billion |
| Electric Bus Market CAGR During 2023 - 2032 | 14.6% |
| Electric Bus Market Analysis Period | 2020 - 2032 |
| Electric Bus Market Base Year | 2022 |
| Electric Bus Market Forecast Data | 2023 - 2032 |
| Segments Covered | By Vehicle Type, By End-User, By Battery Capacity, By Range, And By Geography |
| Regional Scope | North America, Europe, Asia Pacific, Latin America, and Middle East & Africa |
| Key Companies Profiled | AB Volvo, Ashok Leyland Limited, Daimler Truck AG, Hyundai Motor Company, Man SE, Nissan Motor Corporation, Proterra, TATA Motors Limited, and Zhengzhou Yutong Bus Co., Ltd. |
| Report Coverage |
Market Trends, Drivers, Restraints, Competitive Analysis, Player Profiling, Covid-19 Analysis, Regulation Analysis |
Electric Bus Market Insights
Air pollution has been a major cause of death, according to the World Health Organization (WHO). Seeing that the impacts on public health and the environment of vehicle emissions are negative, governments in big economies invest heavily in infrastructure development to reduce greenhouse gasses and air pollution. Those regulations fuel the expansion of the demand for electric buses. The electric bus is free of soot, as no harmful substances are released. Electric buses also provide a smart public transit system that offers communities the road to clean air sustainability.
Decreased electric battery prices are just as critical as support from the government for the development of electric bus markets. Battery production, particularly in China, has increased significantly, contributing to a significant decline in battery quality. Since its battery accounts for almost 40 percent of bus costs, a further drop in battery prices is projected to have a positive impact on the market. Battery companies work relentlessly to increase the output power to provide more value for money to bus customers.
Electric Bus Market Segmentation
The worldwide market for electric bus is split based on vehicle type, end-user, battery capacity, range, and geography.
Electric Bus Vehicle Types
- Plug-In Hybrid Electric Bus
- Battery Electric Bus
- Fuel Cell Electric Bus

The electric bus market can be categorized into three vehicle types: plug-in hybrid electric buses, battery electric buses, and fuel cell electric buses. According to the electric bus industry analysis, battery electric buses (BEVs) have dominated the market in 2022. These buses, with a capacity of up to 400 kWh, offer superior efficiency and emit fewer pollutants compared to other vehicle types. Moreover, they provide fast acceleration, surpassing traditional fuel or gas vehicles.
Battery electric buses, on the other hand, offer affordability and reduced maintenance costs, making them an attractive option for buyers. These vehicles have gained popularity due to their economic advantages. Owing to these various benefits, the electric bus market is expected to witness significant growth in the coming years.
Electric Bus End-Users
- Fleet Operators
- Government

In the end-user segment of the electric bus market, two primary categories can be identified: fleet operators or public transport and government agencies. Among these, government have been the dominant revenue generator in previous years. This is primarily due to the substantial market share held by this segment, driven by increasing transportation needs. The sub-segment of government is expected to experience significant growth during the forecast period.
Furthermore, the adoption of electric buses by various countries within their transportation systems is a key contributing factor to the growth of the electric bus market. Governments around the world are recognizing the importance of transitioning to cleaner and more sustainable public transportation options, which has led to increased support and initiatives for electric buses. These factors collectively indicate a positive outlook for the electric bus market in the foreseeable future.
Electric Bus Battery Capacities
- Up to 400 KWh
- Above 400 kWh
Based on the battery capacity segment electric bus market is categorized into Up to 400 KWh, and above 400 kWh. According to the electric bus market forecast, up to 400 kWh battery capacity has been more prevalent and has held a significant market share in the electric bus industry. This capacity range offers a balance between energy storage capabilities and cost-effectiveness, making it suitable for many urban and suburban transit operations. It provides sufficient range for daily bus routes while being relatively more affordable and easier to implement.
On the other hand, above 400 kWh battery capacity is gaining momentum in the electric bus market. With larger energy storage, these buses can offer extended driving ranges, making them suitable for long-haul or intercity routes. They are capable of carrying heavier passenger loads and can be utilized in areas with limited charging infrastructure, reducing the need for frequent recharging.
Electric Bus Range
- Less than 200 miles
- More than 200 miles
In the electric bus market, the range of buses is categorized into two segments: less than 200 miles and more than 200 miles. Among these segments, the less than 200 miles sub-segment has held the largest market share. This can be attributed to several factors. Firstly, buses with a range of less than 200 miles are typically available at a lower cost compared to those with a range exceeding 200 miles. This affordability makes them more accessible to fleet operators and government agencies with budget constraints.
Additionally, buses with a range of less than 200 miles have the advantage of shorter charging times. Since these buses require less battery capacity, the charging process is generally quicker, allowing for more efficient operations and reducing downtime. Considering these factors, the less than 200-mile range sub-segment is experiencing significant growth and is projected to have the largest compound annual growth rate (CAGR) during the forecast period.
Electric Bus Market Regional Outlook
North America
- U.S.
- Canada
Europe
- U.K.
- Germany
- France
- Spain
- Rest of Europe
Asia-Pacific
- India
- Japan
- China
- Australia
- South Korea
- Rest of Asia-Pacific
Latin America
- Brazil
- Mexico
- Rest of Latin America
The Middle East & Africa
- South Africa
- GCC Countries
- Rest of the Middle East & Africa (ME&A)
Electric Bus Market Regional Analysis
The Chinese demand for electric buses relies heavily on the state, which in 2022 accounted for over 50% of revenue. Buses are used for mass transportation, freight, military, and other activities of the government sector. The bulk of the decisions on electric bus purchases are made by officials and other public bodies at the local or state level. The reduction in the subsidy for electric cars will have a small impact on the selling of electric buses because the public sector is less prone to prices than private ones. The Chinese government is now strongly committed to raising the share of electric buses in the country's transport network
Europe is the second largest market and over the forecast period, this market is expected to expand well. In this area, the tight vehicle emission regulations of the Government promote the growth of the electric bus industry. Many municipalities have launched projects to ensure that clean and efficient transport in this area makes urban public transport affordable. There is also increasing demand for fuel cell buses in this area.
The growing demand for electricity transit systems, the growth of renowned OEMs, and government support is driving the electric bus industry in Middle East & Africa. The first smart electric bus in the world was launched in November 2019, with the assistance of the Shanghai Wanxiang Company, China. Futon Motor has planned to produce more than 2,000 electric buses in the country in the next four years with the Egypt Military Development Ministry in May 2019.
Electric Bus Market Players
Some of the top electric bus companies offered in our report include AB Volvo, Ashok Leyland Limited, Daimler Truck AG, Hyundai Motor Company, Man SE, Nissan Motor Corporation, Proterra, TATA Motors Limited, and Zhengzhou Yutong Bus Co., Ltd.
Frequently Asked Questions
What was the market size of the global electric bus in 2022?
The market size of electric bus was USD 44.3 billion in 2022.
What is the CAGR of the global electric bus market from 2023 to 2032?
The CAGR of electric bus is 14.6% during the analysis period of 2023 to 2032.
Which are the key players in the electric bus market?
The key players operating in the global market are including AB Volvo, Ashok Leyland Limited, Daimler Truck AG, Hyundai Motor Company, Man SE, Nissan Motor Corporation, Proterra, TATA Motors Limited, and Zhengzhou Yutong Bus Co., Ltd.
Which region dominated the global electric bus market share?
North America held the dominating position in electric bus industry during the analysis period of 2023 to 2032.
Which region registered fastest CAGR from 2023 to 2032?
Asia-Pacific region exhibited fastest growing CAGR for market of electric bus during the analysis period of 2023 to 2032.
What are the current trends and dynamics in the global electric bus industry?
The current trends and dynamics in the electric bus industry include rising in demand for fuel-efficient, high-performance, and low emission buses, low cost of electric vehicle batteries, and grow in government initiatives for the promotion of e-mobility.
Which vehicle type held the maximum share in 2022?
The battery electric buses vehicle type held the maximum share of the electric bus industry.


