The Global Elderly and Disabled Assistive Devices Market Size is valued at USD 22,439 Million in 2021 and is projected to reach a market size of USD 37,263 Million by 2030; growing at a CAGR of 5.9%.
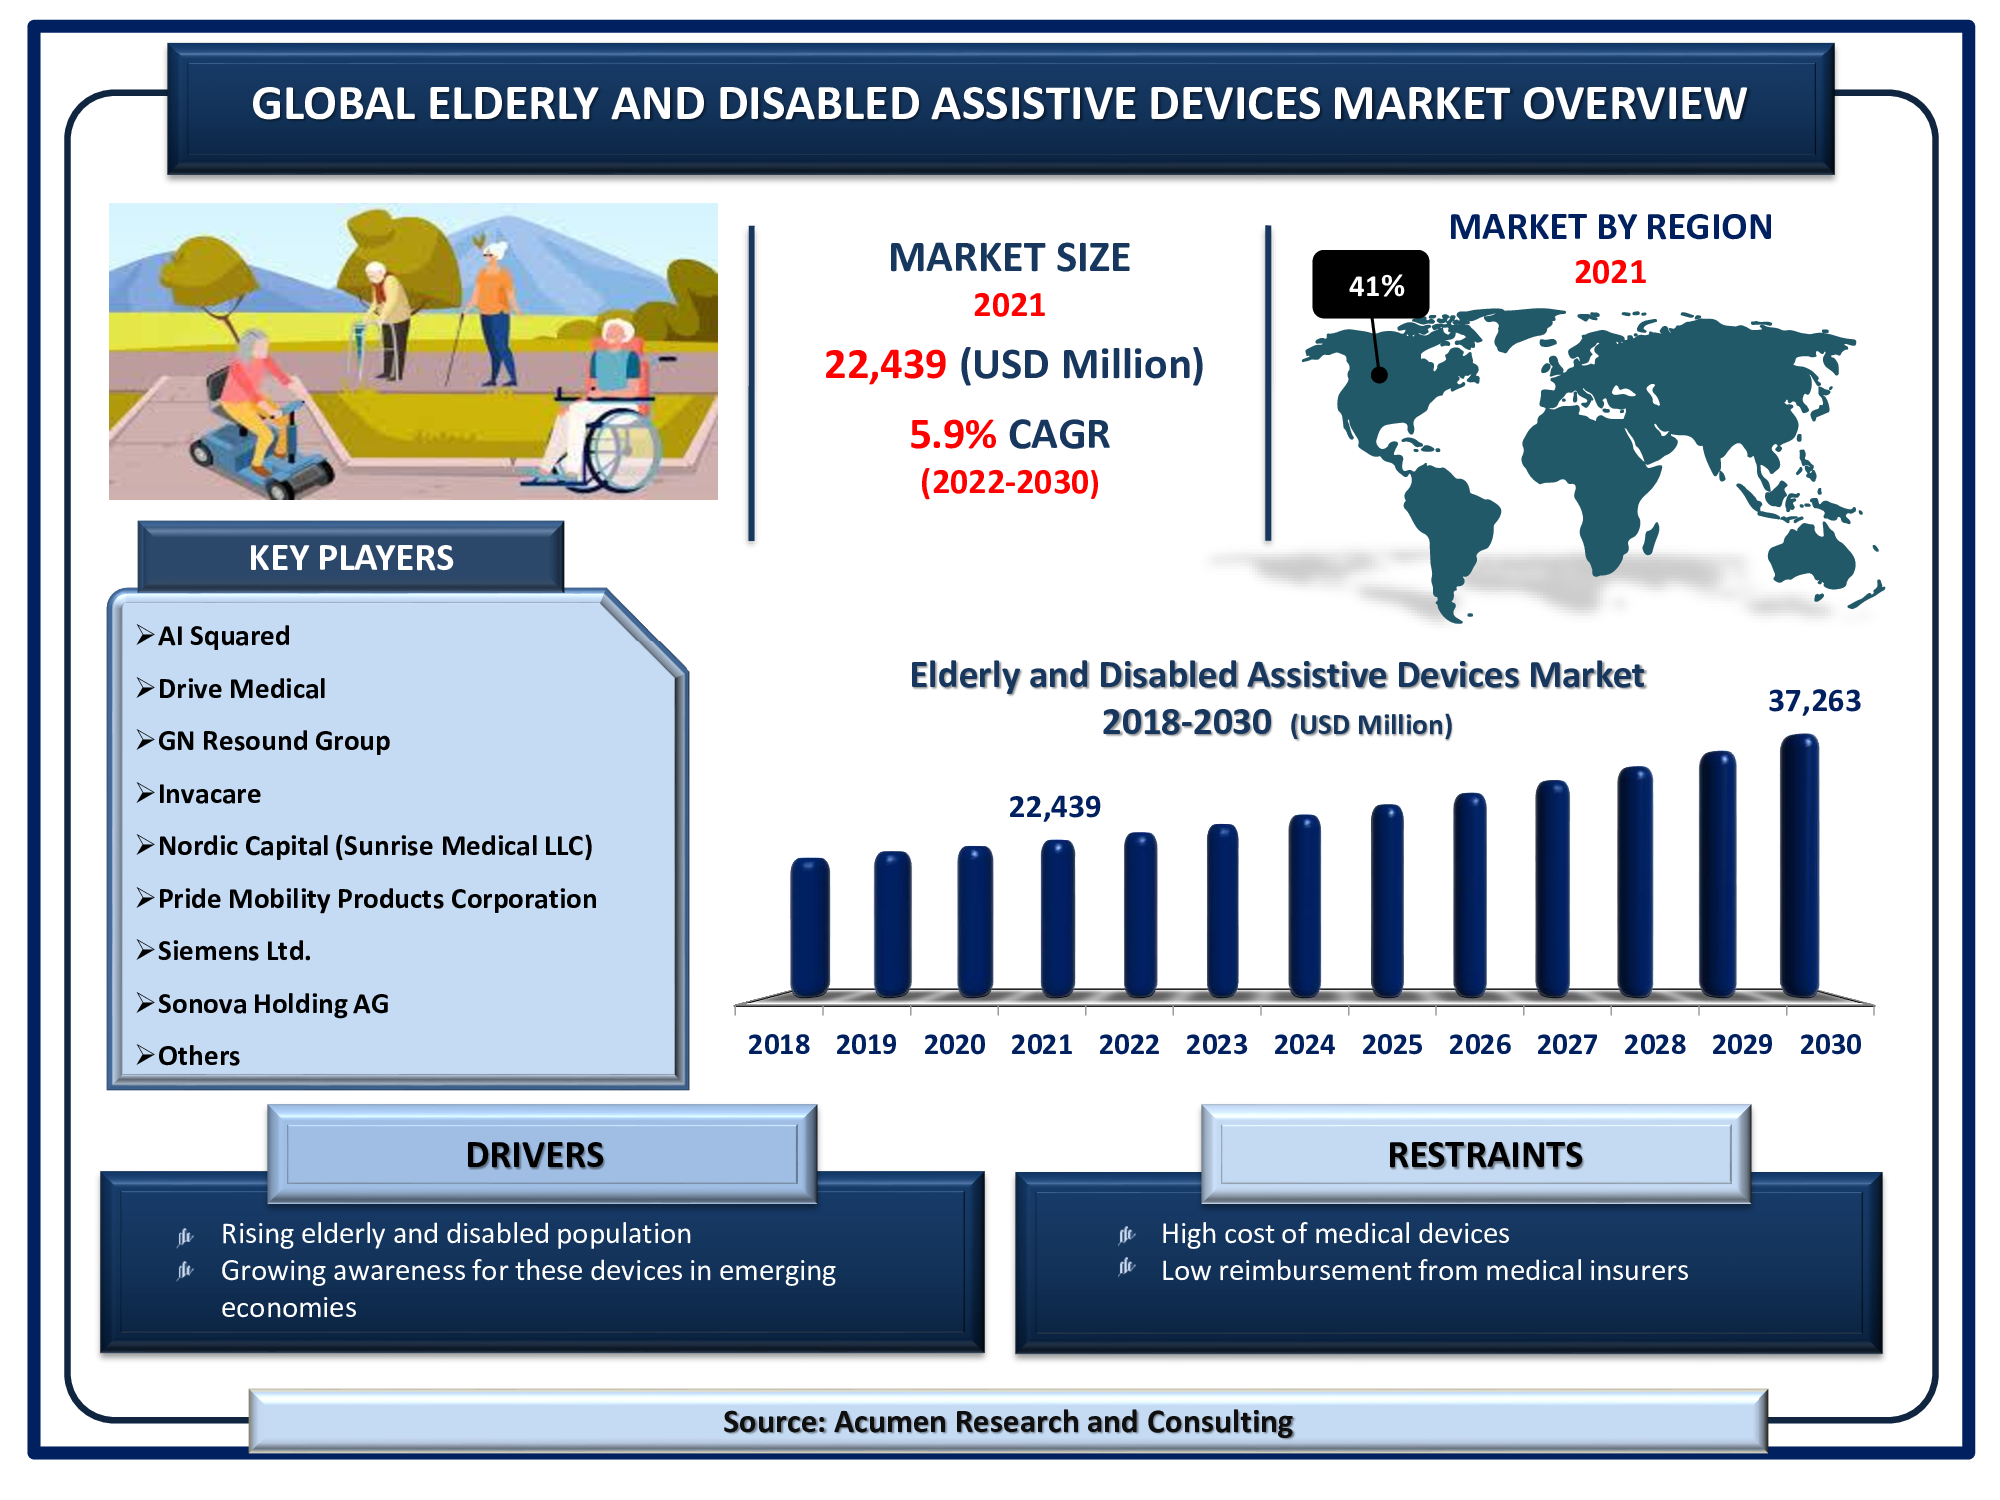
Technological advancement in assistive devices is one of the trends in the elderly and disabled assistive devices market that is fueling industry demand from 2022 to 2030. The growing awareness of these devices is expected to boost the elderly and disabled assistive devices market value. According to the World Health Organization (WHO), assistive devices are those that help people maintain or improve their functioning and independence in order to improve their overall well-being. Assistive devices can greatly improve an elderly or disabled person’s lifestyle by making daily tasks easier. This factor will significantly fuel the demand for this technology.
Global Elderly and Disabled Assistive Devices Market DRO’s:
Market Drivers:
- Rising elderly and disabled population
- Growing awareness for these devices in emerging economies
- Increasing disposable income of baby boomers
Market Restraints:
- High cost of medical devices
- Lack of reimbursement policies from medical insurers
Market Opportunities:
- Technological advancements in these devices
- Extensive demand from emerging markets
Report Coverage
Market |
Elderly and Disabled Assistive Devices Market |
Market Size 2021 |
USD 22,439 Million |
Market Forecast 2030 |
USD 37,263 Million |
CAGR During 2022 - 2030 |
5.9% |
Analysis Period |
2018 - 2030 |
Base Year |
2021 |
Forecast Data |
2022 - 2030 |
Segments Covered |
By Type, By End-User, And By Geography
|
Regional Scope |
North America, Europe, Asia Pacific, Latin America, and Middle East & Africa |
Key Companies Profiled |
Sonova Holding AG, Invacare, AI Squared, Pride Mobility Products Corporation, Drive Medical, Starkey hearing technologies, GN Resound Group, Siemens Ltd., Nordic Capital (Sunrise Medical LLC), William Demant Holding A/S. |
Report Coverage
|
Market Trends, Drivers, Restraints, Competitive Analysis, Player Profiling, Regulation Analysis |
Customization Scope |
10 hrs of free customization and expert consultation
|
Elderly and Disabled Assistive Devices Market Dynamics
The growing number of elderly people who need help walking, standing, and performing a variety of tasks is the primary driver of the global elderly assistive devices market. As people age, their ability to live independently may deteriorate. Although the vast majority of the elderly prefer to age in place, many will struggle with daily activities and tasks. To care for themselves, maintain mobility, communicate, and stay safe, older adults require assistance. This assistance helps to improve or restore confidence, self-esteem, and independence.
Assistive devices are primarily required by people with disabilities, fueling the growth of the disabled assistive devices market. People with disabilities may require mobility assistance. Walkers, wheelchairs, prosthetic devices, canes, and crutches are examples of mobility aids. This industry's research and development has also resulted in communication aids for people who are unable to speak. Speech recognition software and speech-generating devices are greatly assisting these people in expressing themselves.
The increasing presence of disabled people in workplaces has prompted industry leaders to develop advanced equipment that allows any type of disabled person to learn and work in a stressful environment. Screen readers, adaptive keyboards, augmentative and alternative communication (AAC) tools, braille display, dictation software, electronic magnifiers, and optical character recognition software (OCR), among other advanced assistive technologies, have helped students and professionals perform daily activities.
The increasing disposable income of baby boomers allows them to acquire the latest and best-fitting devices for their disabilities. Some of the most recent assistive devices are costly, making them out of reach for some elderly or disabled people. However, many baby boomers (aged 57 to 75) have enough disposable income to afford them. Many international and national governments are assisting the elderly and disabled who have limited income and cannot afford an assistive device. For example, the Assistive Devices Program (ADP) pays up to 75% of the cost of a device such as a wheelchair, orthopedic brace, or breathing aid. ADP also contributes a set amount to devices such as hearing aids. In this way, many government organizations are assisting the elderly and disabled, thereby fueling the industry of assistive devices for the elderly and physically disabled.
Elderly and Disabled Assistive Devices Market Segmentation
The worldwide elderly and disabled assistive devices market is split based on type, end-user, and geography.
Market by Type
Living Aids Devices
- Hearing Aids
- BAHA (Bone Anchored Hearing Aids)
- BTE (Behind-the-ear) Aids
- Canal Hearing Aids
- Cochlear Implants
- ITE (In-the-Ear) Aids
- RITE (Receiver-in-the-Ear) Aids
- Reading and Vision Aids
- Braille Translators
- Reading Machines
- Video Magnifiers
- Others
Mobility Aids Devices
- Wheelchairs
- Manual Wheelchairs
- Powered Wheelchairs
- Mobility Scooters
- Crutches and Cranes
- Patient Mechanical Lift Handling
- Walkers and Rollators
- Others
Medical Furniture
- Door Openers
- Medical Beds
- Riser Reclining Chairs
- Others
Bathroom Safety Equipment
- Bars, Grips, and Rails
- Commode Chairs
- Ostomy Equipment
- Shower Chairs
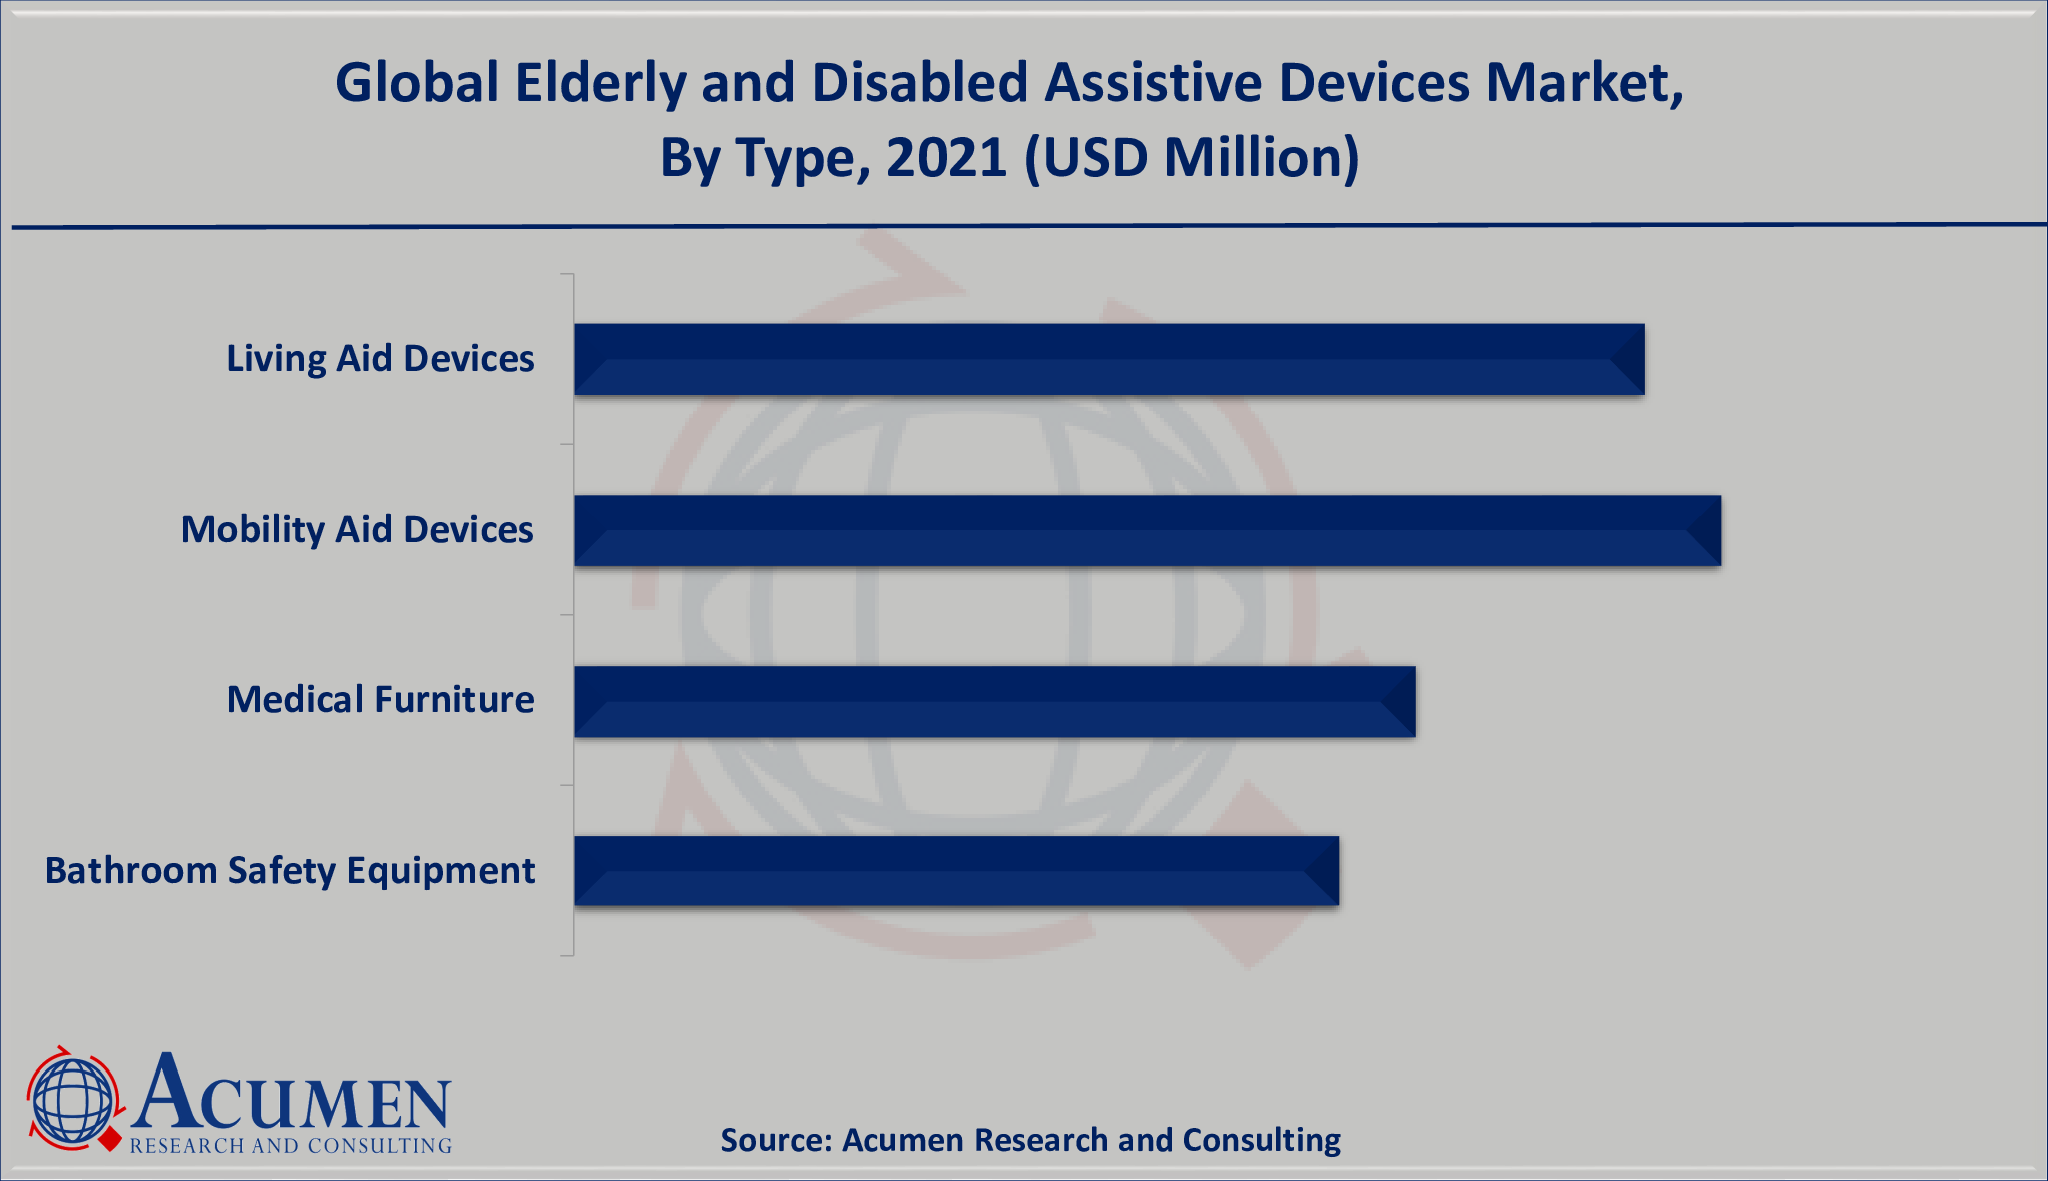
According to our elderly and disabled assistive devices market forecast, mobility aids will have a significant market share from 2022 to 2030. According to WHO statistics, more than 7 million community-dwelling Americans use mobility devices such as canes, walkers, and crutches, with two-thirds of those people being over the age of 65. With an increasing number of older adults in the community and an increasing number of those adults suffering from multiple chronic disorders, disability, and the resulting mobility issues are expected to become more common. According to the American Academy of Family Physicians data, over 1.8 million people use wheelchairs or scooters, with another 6.2 million using walkers, cranes, or crutches.
Market by End-User
- Hospitals
- Homecare
- Nursing Homes
- Assisted Living Facilities
Among all end-users, hospitals had the highest market share for elderly and disabled assistive devices. Hospitalized assistive technology devices, such as therapeutic intervention equipment and diagnostic equipment, are modified to be used only in the hospital setting. The hospital assistive devices are intended to assist the patient with everyday routines in the hospital. Furthermore, these hospitalized devices are used by healthcare professionals to detect and diagnose diseases. The homecare elderly and disabled assistive devices sub-segment, on the other hand, is expected to grow at the fastest rate during the forecast timeframe of 2022 to 2030.
Elderly and Disabled Assistive Devices Market Regional Outlook
North America
Europe
- U.K.
- Germany
- France
- Spain
- Rest of Europe
Latin America
- Mexico
- Brazil
- Rest of Latin America
Asia-Pacific
- India
- Japan
- China
- Australia
- South Korea
- Rest of Asia-Pacific
The Middle East & Africa (MEA)
- Gulf Cooperation Council (GCC)
- South Africa
- Rest of the Middle East & Africa
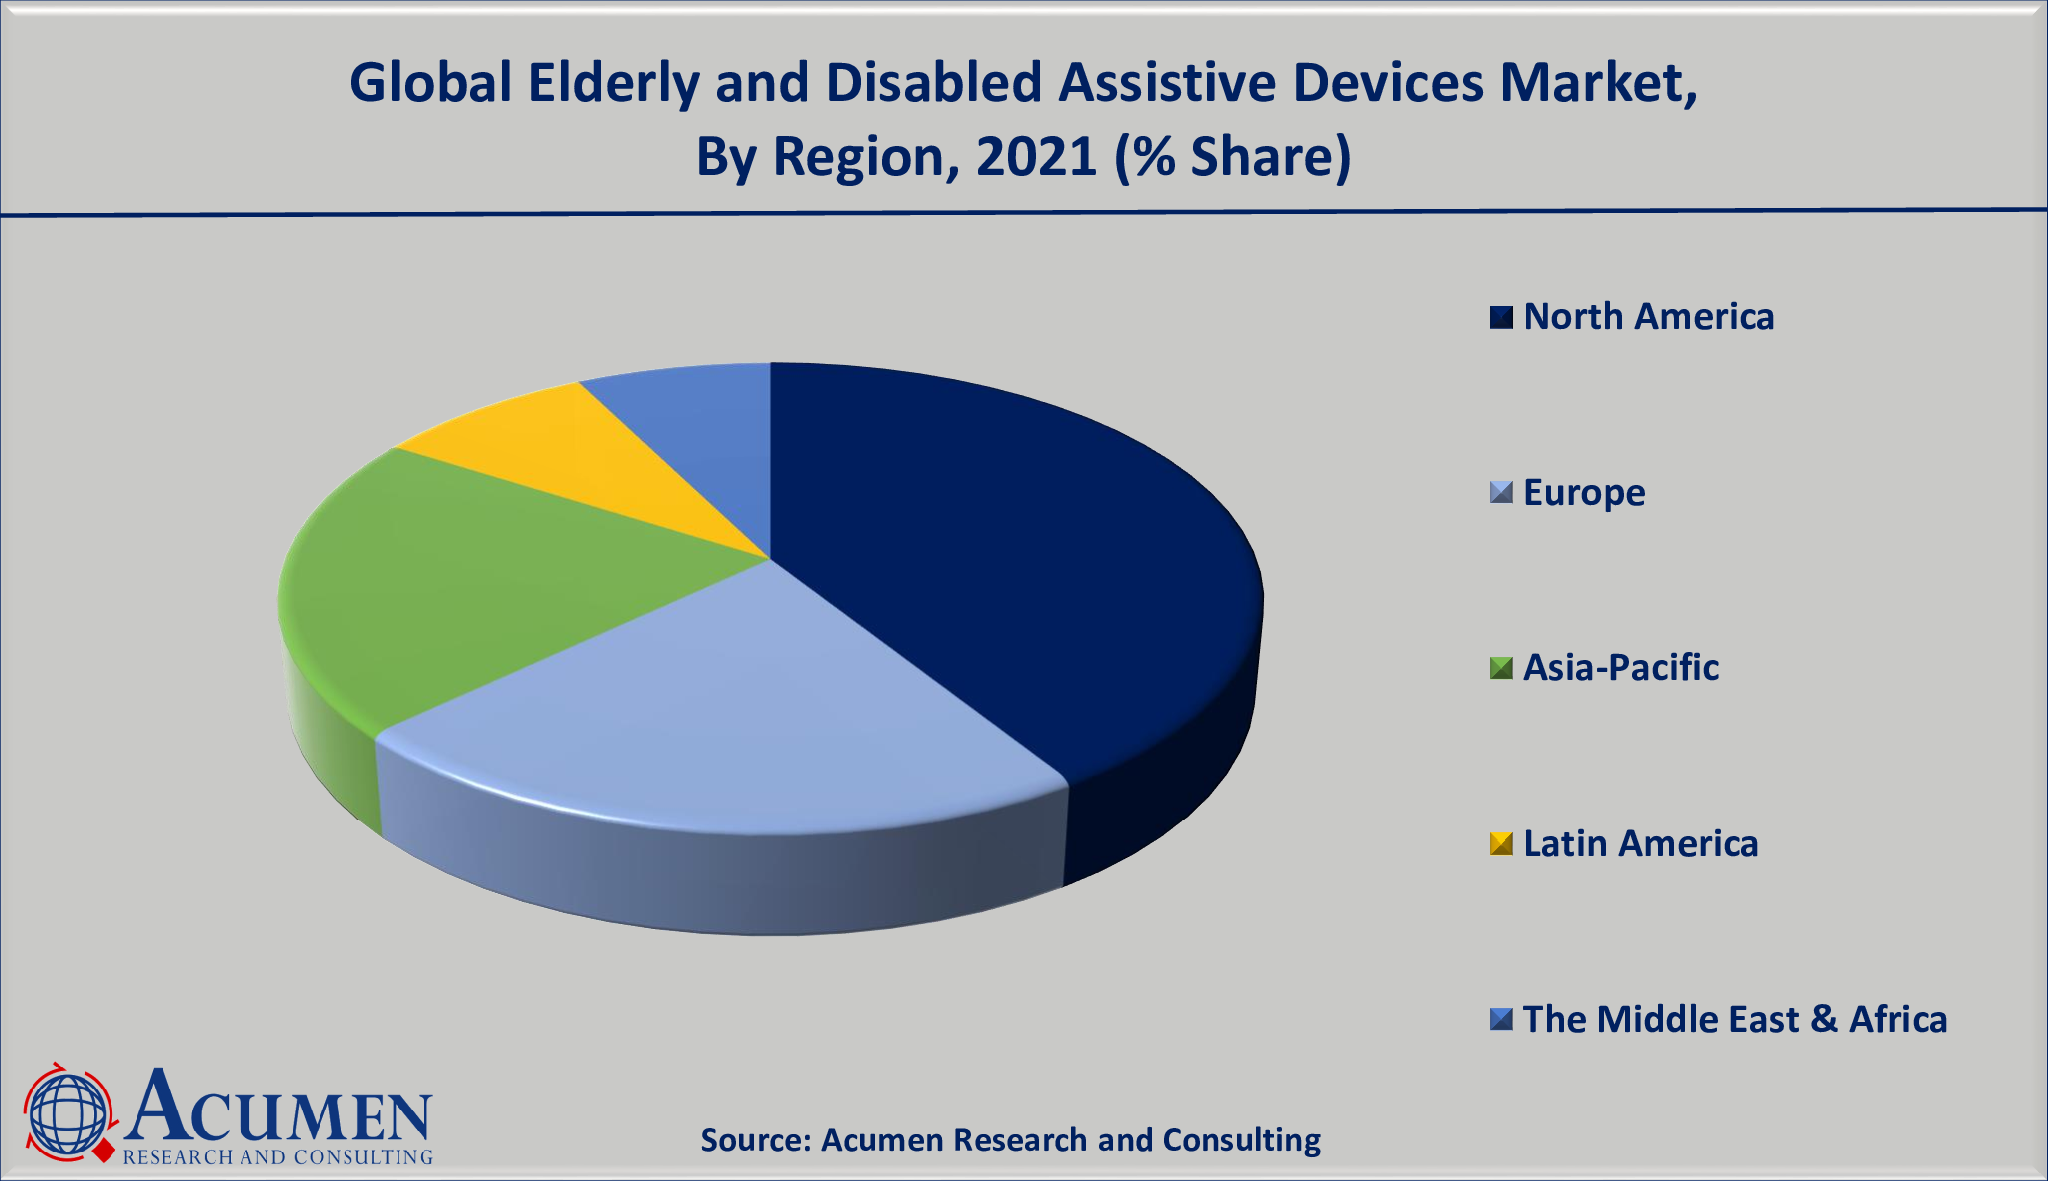
The presence of a large number of elderly as well as the disabled population in North America fuels the elderly and disabled assistive devices market growth
According to our regional analysis of the elderly and disabled assistive devices market, North America generated the largest market share in 2021 and is expected to continue to do so through the forecasted years of 2022 to 2030. The region's dominance is attributed to the presence of a large geriatric and disabled population. Furthermore, the presence of a large number of patients suffering from chronic disorders such as diabetes, arthritis, Parkinson's disease, and heart disease is supporting the North American elderly and disabled assistive devices market.
The Asia-Pacific region, on the other hand, is expected to experience the fastest growth rate between 2022 and 2030. The region's rapid growth can be attributed to increased healthcare spending, rising disposable income, and favorable government policies and support. Furthermore, improving healthcare infrastructure and increasing awareness in countries such as China, India, Indonesia, Thailand, and South Korea, among others, are fueling the Asia-Pacific elderly and disabled population.
Elderly and Disabled Assistive Devices Market Players
Some of the top elderly and disabled assistive devices companies offered in the professional report include Sonova Holding AG, Invacare, AI Squared, Pride Mobility Products Corporation, Drive Medical, Starkey hearing technologies, GN Resound Group, Siemens Ltd., Nordic Capital (Sunrise Medical LLC), William Demant Holding A/S.
CHAPTER 1. Industry Overview of Elderly and Disabled Assistive Devices Market
1.1. Definition and Scope
1.1.1. Definition of Elderly and Disabled Assistive Devices
1.1.2. Market Segmentation
1.1.3. Years Considered for the Study
1.1.4. Assumptions and Acronyms Used
1.1.4.1. Market Assumptions and Market Forecast
1.1.4.2. Acronyms Used in Global Elderly and Disabled Assistive Devices Market
1.2. Summary
1.2.1. Executive Summary
1.2.2. Elderly and Disabled Assistive Devices Market By Type
1.2.3. Elderly and Disabled Assistive Devices Market By End-User
1.2.4. Elderly and Disabled Assistive Devices Market By Region
CHAPTER 2. Research Approach
2.1. Methodology
2.1.1. Research Programs
2.1.2. Market Size Estimation
2.1.3. Market Breakdown and Data Triangulation
2.2. Data Source
2.2.1. Secondary Sources
2.2.2. Primary Sources
CHAPTER 3. Market Dynamics And Competition Analysis
3.1. Market Drivers
3.1.1. Driver 1
3.1.2. Driver 2
3.2. Restraints and Challenges
3.2.1. Restraint 1
3.2.2. Restraint 2
3.3. Growth Opportunities
3.3.1. Opportunity 1
3.3.2. Opportunity 2
3.4. Porter’s Five Forces Analysis
3.4.1. Bargaining Power of Suppliers
3.4.2. Bargaining Power of Buyers
3.4.3. Threat of Substitute
3.4.4. Threat of New Entrants
3.4.5. Degree of Competition
3.5. Market Concentration Ratio and Market Maturity Analysis of Elderly and Disabled Assistive Devices Market
3.5.1. Go To Market Strategy
3.5.1.1. Introduction
3.5.1.2. Growth
3.5.1.3. Maturity
3.5.1.4. Saturation
3.5.1.5. Possible Development
3.6. Technological Roadmap for Elderly and Disabled Assistive Devices Market
3.7. Value Chain Analysis
3.7.1. List of Key Manufacturers
3.7.2. List of Customers
3.7.3. Level of Integration
3.8. Cost Structure Analysis
3.8.1. Price Trend of Key Raw Materials
3.8.2. Raw Material Suppliers
3.8.3. Proportion of Manufacturing Cost Structure
3.8.3.1. Raw Material
3.8.3.2. Labor Cost
3.8.3.3. Manufacturing Expense
3.9. Regulatory Compliance
3.10. Competitive Landscape, 2021
3.10.1. Player Positioning Analysis
3.10.2. Key Strategies Adopted By Leading Players
CHAPTER 4. Manufacturing Plant Analysis
4.1. Manufacturing Plant Location and Establish Date of Major Manufacturers in 2021
4.2. R&D Status of Major Manufacturers in 2021
CHAPTER 5. Elderly and Disabled Assistive Devices Market By Type
5.1. Introduction
5.2. Elderly and Disabled Assistive Devices Revenue By Type
5.2.1. Elderly and Disabled Assistive Devices Revenue (USD Million) and Forecast, By Type, 2018-2030
5.2.2. Mobility Aids Devices
5.2.2.1. Mobility Aids Devices Market Revenue (USD Million) and Growth Rate (%), 2018-2030
5.2.2.2. Wheelchairs
5.2.2.2.1. Wheelchairs Market Revenue (USD Million) and Growth Rate (%), 2018-2030
5.2.2.2.2. Manual Wheelchairs
5.2.2.2.2.1. Manual Wheelchairs Market Revenue (USD Million) and Growth Rate (%), 2018-2030
5.2.2.2.3. Powered Wheelchairs
5.2.2.2.3.1. Powered Wheelchairs Market Revenue (USD Million) and Growth Rate (%), 2018-2030
5.2.2.3. Mobility Scooters
5.2.2.3.1. Mobility Scooters Market Revenue (USD Million) and Growth Rate (%), 2018-2030
5.2.2.3.2. Crutches and Cranes
5.2.2.3.2.1. Crutches and Cranes Market Revenue (USD Million) and Growth Rate (%), 2018-2030
5.2.2.3.3. Patient Mechanical Lift Handling
5.2.2.3.3.1. Patient Mechanical Lift Handling Market Revenue (USD Million) and Growth Rate (%), 2018-2030
5.2.2.3.4. Walkers and Rollators
5.2.2.3.4.1. Walkers and Rollators Market Revenue (USD Million) and Growth Rate (%), 2018-2030
5.2.2.3.5. Others
5.2.2.3.5.1. Others Market Revenue (USD Million) and Growth Rate (%), 2018-2030
5.2.3. Living Aids Devices
5.2.3.1. Living Aids Devices Market Revenue (USD Million) and Growth Rate (%), 2018-2030
5.2.3.2. Hearing Aids
5.2.3.2.1. Hearing Aids Market Revenue (USD Million) and Growth Rate (%), 2018-2030
5.2.3.2.2. BAHA (Bone Anchored Hearing Aids)
5.2.3.2.2.1. BAHA (Bone Anchored Hearing Aids) Market Revenue (USD Million) and Growth Rate (%), 2018-2030
5.2.3.2.3. BTE (Behind-the-ear) Aids
5.2.3.2.3.1. BTE (Behind-the-ear) Aids Market Revenue (USD Million) and Growth Rate (%), 2018-2030
5.2.3.2.4. Canal Hearing Aids
5.2.3.2.4.1. Canal Hearing Aids Market Revenue (USD Million) and Growth Rate (%), 2018-2030
5.2.3.2.5. Cochlear Implants
5.2.3.2.5.1. Cochlear Implants Market Revenue (USD Million) and Growth Rate (%), 2018-2030
5.2.3.2.6. ITE (In-the-Ear) Aids
5.2.3.2.6.1. ITE (In-the-Ear) Aids Market Revenue (USD Million) and Growth Rate (%), 2018-2030
5.2.3.2.7. RITE (Receiver-in-the-Ear) Aids
5.2.3.2.7.1. RITE (Receiver-in-the-Ear) Aids Market Revenue (USD Million) and Growth Rate (%), 2018-2030
5.2.3.3. Reading and Vision Aids
5.2.3.3.1. Reading and Vision Aids Market Revenue (USD Million) and Growth Rate (%), 2018-2030
5.2.3.3.2. Braille Translators
5.2.3.3.2.1. Braille Translators Market Revenue (USD Million) and Growth Rate (%), 2018-2030
5.2.3.3.3. Reading Machines
5.2.3.3.3.1. Reading Machines Market Revenue (USD Million) and Growth Rate (%), 2018-2030
5.2.3.3.4. Video Magnifiers
5.2.3.3.4.1. Video Magnifiers Market Revenue (USD Million) and Growth Rate (%), 2018-2030
5.2.3.3.5. Others
5.2.3.3.5.1. Others Market Revenue (USD Million) and Growth Rate (%), 2018-2030
5.2.4. Medical Furniture
5.2.4.1. Medical Furniture Market Revenue (USD Million) and Growth Rate (%), 2018-2030
5.2.4.2. Door Openers
5.2.4.2.1. Door Openers Market Revenue (USD Million) and Growth Rate (%), 2018-2030
5.2.4.3. Medical Beds
5.2.4.3.1. Medical Beds Market Revenue (USD Million) and Growth Rate (%), 2018-2030
5.2.4.4. Riser Reclining Chairs
5.2.4.4.1. Riser Reclining Chairs Market Revenue (USD Million) and Growth Rate (%), 2018-2030
5.2.4.5. Others
5.2.4.5.1. Others Market Revenue (USD Million) and Growth Rate (%), 2018-2030
5.2.5. Bathroom Safety Equipment
5.2.5.1. Bathroom Safety Equipment Market Revenue (USD Million) and Growth Rate (%), 2018-2030
5.2.5.2. Bars, Grips, and Rails
5.2.5.2.1. Bars, Grips, and Rails Market Revenue (USD Million) and Growth Rate (%), 2018-2030
5.2.5.3. Commode Chairs
5.2.5.3.1. Commode Chairs Market Revenue (USD Million) and Growth Rate (%), 2018-2030
5.2.5.4. Ostomy Equipment
5.2.5.4.1. Ostomy Equipment Market Revenue (USD Million) and Growth Rate (%), 2018-2030
5.2.5.5. Shower Chairs
5.2.5.5.1. Shower Chairs Market Revenue (USD Million) and Growth Rate (%), 2018-2030
CHAPTER 6. Elderly and Disabled Assistive Devices Market By End-User
6.1. Introduction
6.2. Elderly and Disabled Assistive Devices Revenue (USD Million) By End-User
6.2.1. Elderly and Disabled Assistive Devices Revenue (USD Million) and Forecast By End-User, 2018-2030
6.2.2. Hospitals
6.2.2.1. Hospitals Market Revenue (USD Million) and Growth Rate (%), 2018-2030
6.2.3. Homecare
6.2.3.1. Homecare Market Revenue (USD Million) and Growth Rate (%), 2018-2030
6.2.4. Nursing Home
6.2.4.1. Nursing Home Market Revenue (USD Million) and Growth Rate (%), 2018-2030
6.2.5. Assistive Living Facilities
6.2.5.1. Assistive Living Facilities Market Revenue (USD Million) and Growth Rate (%), 2018-2030
CHAPTER 7. North America Elderly and Disabled Assistive Devices Market By Country
7.1. North America Elderly and Disabled Assistive Devices Market Overview
7.2. U.S.
7.2.1. U.S. Elderly and Disabled Assistive Devices Revenue (USD Million) and Forecast By Type, 2018-2030
7.2.2. U.S. Elderly and Disabled Assistive Devices Revenue (USD Million) and Forecast By End-User, 2018-2030
7.3. Canada
7.3.1. Canada Elderly and Disabled Assistive Devices Revenue (USD Million) and Forecast By Type, 2018-2030
7.3.2. Canada Elderly and Disabled Assistive Devices Revenue (USD Million) and Forecast By End-User, 2018-2030
7.4. North America PEST Analysis
CHAPTER 8. Europe Elderly and Disabled Assistive Devices Market By Country
8.1. Europe Elderly and Disabled Assistive Devices Market Overview
8.2. U.K.
8.2.1. U.K. Elderly and Disabled Assistive Devices Revenue (USD Million) and Forecast By Type, 2018-2030
8.2.2. U.K. Elderly and Disabled Assistive Devices Revenue (USD Million) and Forecast By End-User, 2018-2030
8.3. Germany
8.3.1. Germany Elderly and Disabled Assistive Devices Revenue (USD Million) and Forecast By Type, 2018-2030
8.3.2. Germany Elderly and Disabled Assistive Devices Revenue (USD Million) and Forecast By End-User, 2018-2030
8.4. France
8.4.1. France Elderly and Disabled Assistive Devices Revenue (USD Million) and Forecast By Type, 2018-2030
8.4.2. France Elderly and Disabled Assistive Devices Revenue (USD Million) and Forecast By End-User, 2018-2030
8.5. Spain
8.5.1. Spain Elderly and Disabled Assistive Devices Revenue (USD Million) and Forecast By Type, 2018-2030
8.5.2. Spain Elderly and Disabled Assistive Devices Revenue (USD Million) and Forecast By End-User, 2018-2030
8.6. Rest of Europe
8.6.1. Rest of Europe Elderly and Disabled Assistive Devices Revenue (USD Million) and Forecast By Type, 2018-2030
8.6.2. Rest of Europe Elderly and Disabled Assistive Devices Revenue (USD Million) and Forecast By End-User, 2018-2030
8.7. Europe PEST Analysis
CHAPTER 9. Asia Pacific Elderly and Disabled Assistive Devices Market By Country
9.1. Asia Pacific Elderly and Disabled Assistive Devices Market Overview
9.2. China
9.2.1. China Elderly and Disabled Assistive Devices Revenue (USD Million) and Forecast By Type, 2018-2030
9.2.2. China Elderly and Disabled Assistive Devices Revenue (USD Million) and Forecast By End-User, 2018-2030
9.3. Japan
9.3.1. Japan Elderly and Disabled Assistive Devices Revenue (USD Million) and Forecast By Type, 2018-2030
9.3.2. Japan Elderly and Disabled Assistive Devices Revenue (USD Million) and Forecast By End-User, 2018-2030
9.4. India
9.4.1. India Elderly and Disabled Assistive Devices Revenue (USD Million) and Forecast By Type, 2018-2030
9.4.2. India Elderly and Disabled Assistive Devices Revenue (USD Million) and Forecast By End-User, 2018-2030
9.5. Australia
9.5.1. Australia Elderly and Disabled Assistive Devices Revenue (USD Million) and Forecast By Type, 2018-2030
9.5.2. Australia Elderly and Disabled Assistive Devices Revenue (USD Million) and Forecast By End-User, 2018-2030
9.6. South Korea
9.6.1. South Korea Elderly and Disabled Assistive Devices Revenue (USD Million) and Forecast By Type, 2018-2030
9.6.2. South Korea Elderly and Disabled Assistive Devices Revenue (USD Million) and Forecast By End-User, 2018-2030
9.7. Rest of Asia-Pacific
9.7.1. Rest of Asia-Pacific Elderly and Disabled Assistive Devices Revenue (USD Million) and Forecast By Type, 2018-2030
9.7.2. Rest of Asia-Pacific Elderly and Disabled Assistive Devices Revenue (USD Million) and Forecast By End-User, 2018-2030
9.8. Asia Pacific PEST Analysis
CHAPTER 10. Latin America Elderly and Disabled Assistive Devices Market By Country
10.1. Latin America Elderly and Disabled Assistive Devices Market Overview
10.2. Brazil
10.2.1. Brazil Elderly and Disabled Assistive Devices Revenue (USD Million) and Forecast By Type, 2018-2030
10.2.2. Brazil Elderly and Disabled Assistive Devices Revenue (USD Million) and Forecast By End-User, 2018-2030
10.3. Mexico
10.3.1. Mexico Elderly and Disabled Assistive Devices Revenue (USD Million) and Forecast By Type, 2018-2030
10.3.2. Mexico Elderly and Disabled Assistive Devices Revenue (USD Million) and Forecast By End-User, 2018-2030
10.4. Rest of Latin America
10.4.1. Rest of Latin America Elderly and Disabled Assistive Devices Revenue (USD Million) and Forecast By Type, 2018-2030
10.4.2. Rest of Latin America Elderly and Disabled Assistive Devices Revenue (USD Million) and Forecast By End-User, 2018-2030
10.5. Latin America PEST Analysis
CHAPTER 11. Middle East & Africa Elderly and Disabled Assistive Devices Market By Country
11.1. Middle East & Africa Elderly and Disabled Assistive Devices Market Overview
11.2. GCC
11.2.1. GCC Elderly and Disabled Assistive Devices Revenue (USD Million) and Forecast By Type, 2018-2030
11.2.2. GCC Elderly and Disabled Assistive Devices Revenue (USD Million) and Forecast By End-User, 2018-2030
11.3. South Africa
11.3.1. South Africa Elderly and Disabled Assistive Devices Revenue (USD Million) and Forecast By Type, 2018-2030
11.3.2. South Africa Elderly and Disabled Assistive Devices Revenue (USD Million) and Forecast By End-User, 2018-2030
11.4. Rest of Middle East & Africa
11.4.1. Rest of Middle East & Africa Elderly and Disabled Assistive Devices Revenue (USD Million) and Forecast By Type, 2018-2030
11.4.2. Rest of Middle East & Africa Elderly and Disabled Assistive Devices Revenue (USD Million) and Forecast By End-User, 2018-2030
11.5. Middle East & Africa PEST Analysis
CHAPTER 12. Player Analysis Of Elderly and Disabled Assistive Devices Market
12.1. Elderly and Disabled Assistive Devices Market Company Share Analysis
12.2. Competition Matrix
12.2.1. Competitive Benchmarking of key players by price, presence, market share, and R&D investment
12.2.2. New Product Launches and Product Enhancements
12.2.3. Mergers And Acquisition In Global Elderly and Disabled Assistive Devices Market
12.2.4. Partnership, Joint Ventures and Strategic Alliances/ Sales Agreements
CHAPTER 13. Company Profile
13.1. AI Squared
13.1.1. Company Snapshot
13.1.2. Business Overview
13.1.3. Financial Overview
13.1.3.1. Revenue (USD Million), 2021
13.1.3.2. AI Squared 2021 Elderly and Disabled Assistive Devices Business Regional Distribution
13.1.4. Type/Service and Specification
13.1.5. Recent Developments & Business Strategy
13.1.6. Manufacturing Plant Footprint Analysis
13.2. Drive Medical
13.3. GN Resound Group
13.4. Invacare
13.5. Nordic Capital (Sunrise Medical LLC)
13.6. Pride Mobility Products Corporation
13.7. Siemens Ltd.
13.8. Sonova Holding AG
13.9. Starkey hearing technologies
13.10. William Demant Holding A/S