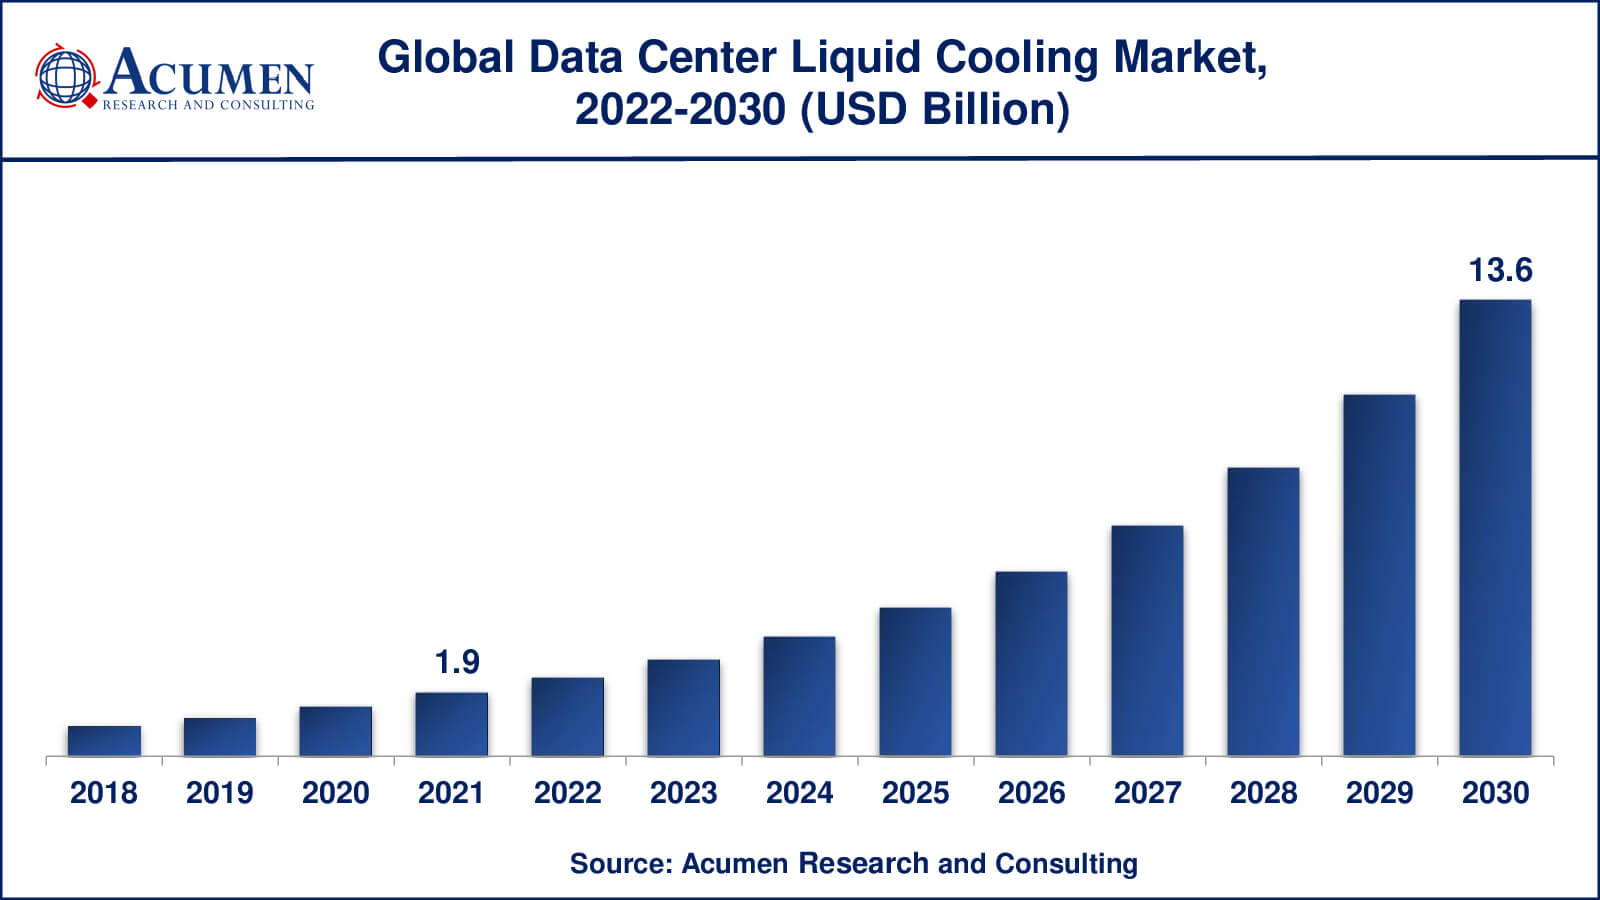
The Global Data Center Liquid Cooling Market Size accounted for USD 1.9 Billion in 2021 and is projected to occupy a market size of USD 13.6 Billion by 2030 growing at a CAGR of 24.6% from 2022 to 2030. Data centers are sophisticated, specialized structures that house critical server equipment that allows businesses to access and transfer critical data. Data centers are in charge of performing search queries, transferring data, and providing computing services to millions of users all over the world at any given time. Data centers are essential for storing information and are critical for businesses to maintain. Servers are at risk of overheating and failing if data centers are not built properly. With an increasing number of industries dependent on digitally stored information, this risk has only increased in recent decades. The more servers there are in a given area, the higher the temperature can rise. If temperatures rise above a critical level, the processor may fail to function properly, or it may even burn out. This is why data centre cooling is critical.
Data Center Liquid Cooling Market Report Statistics
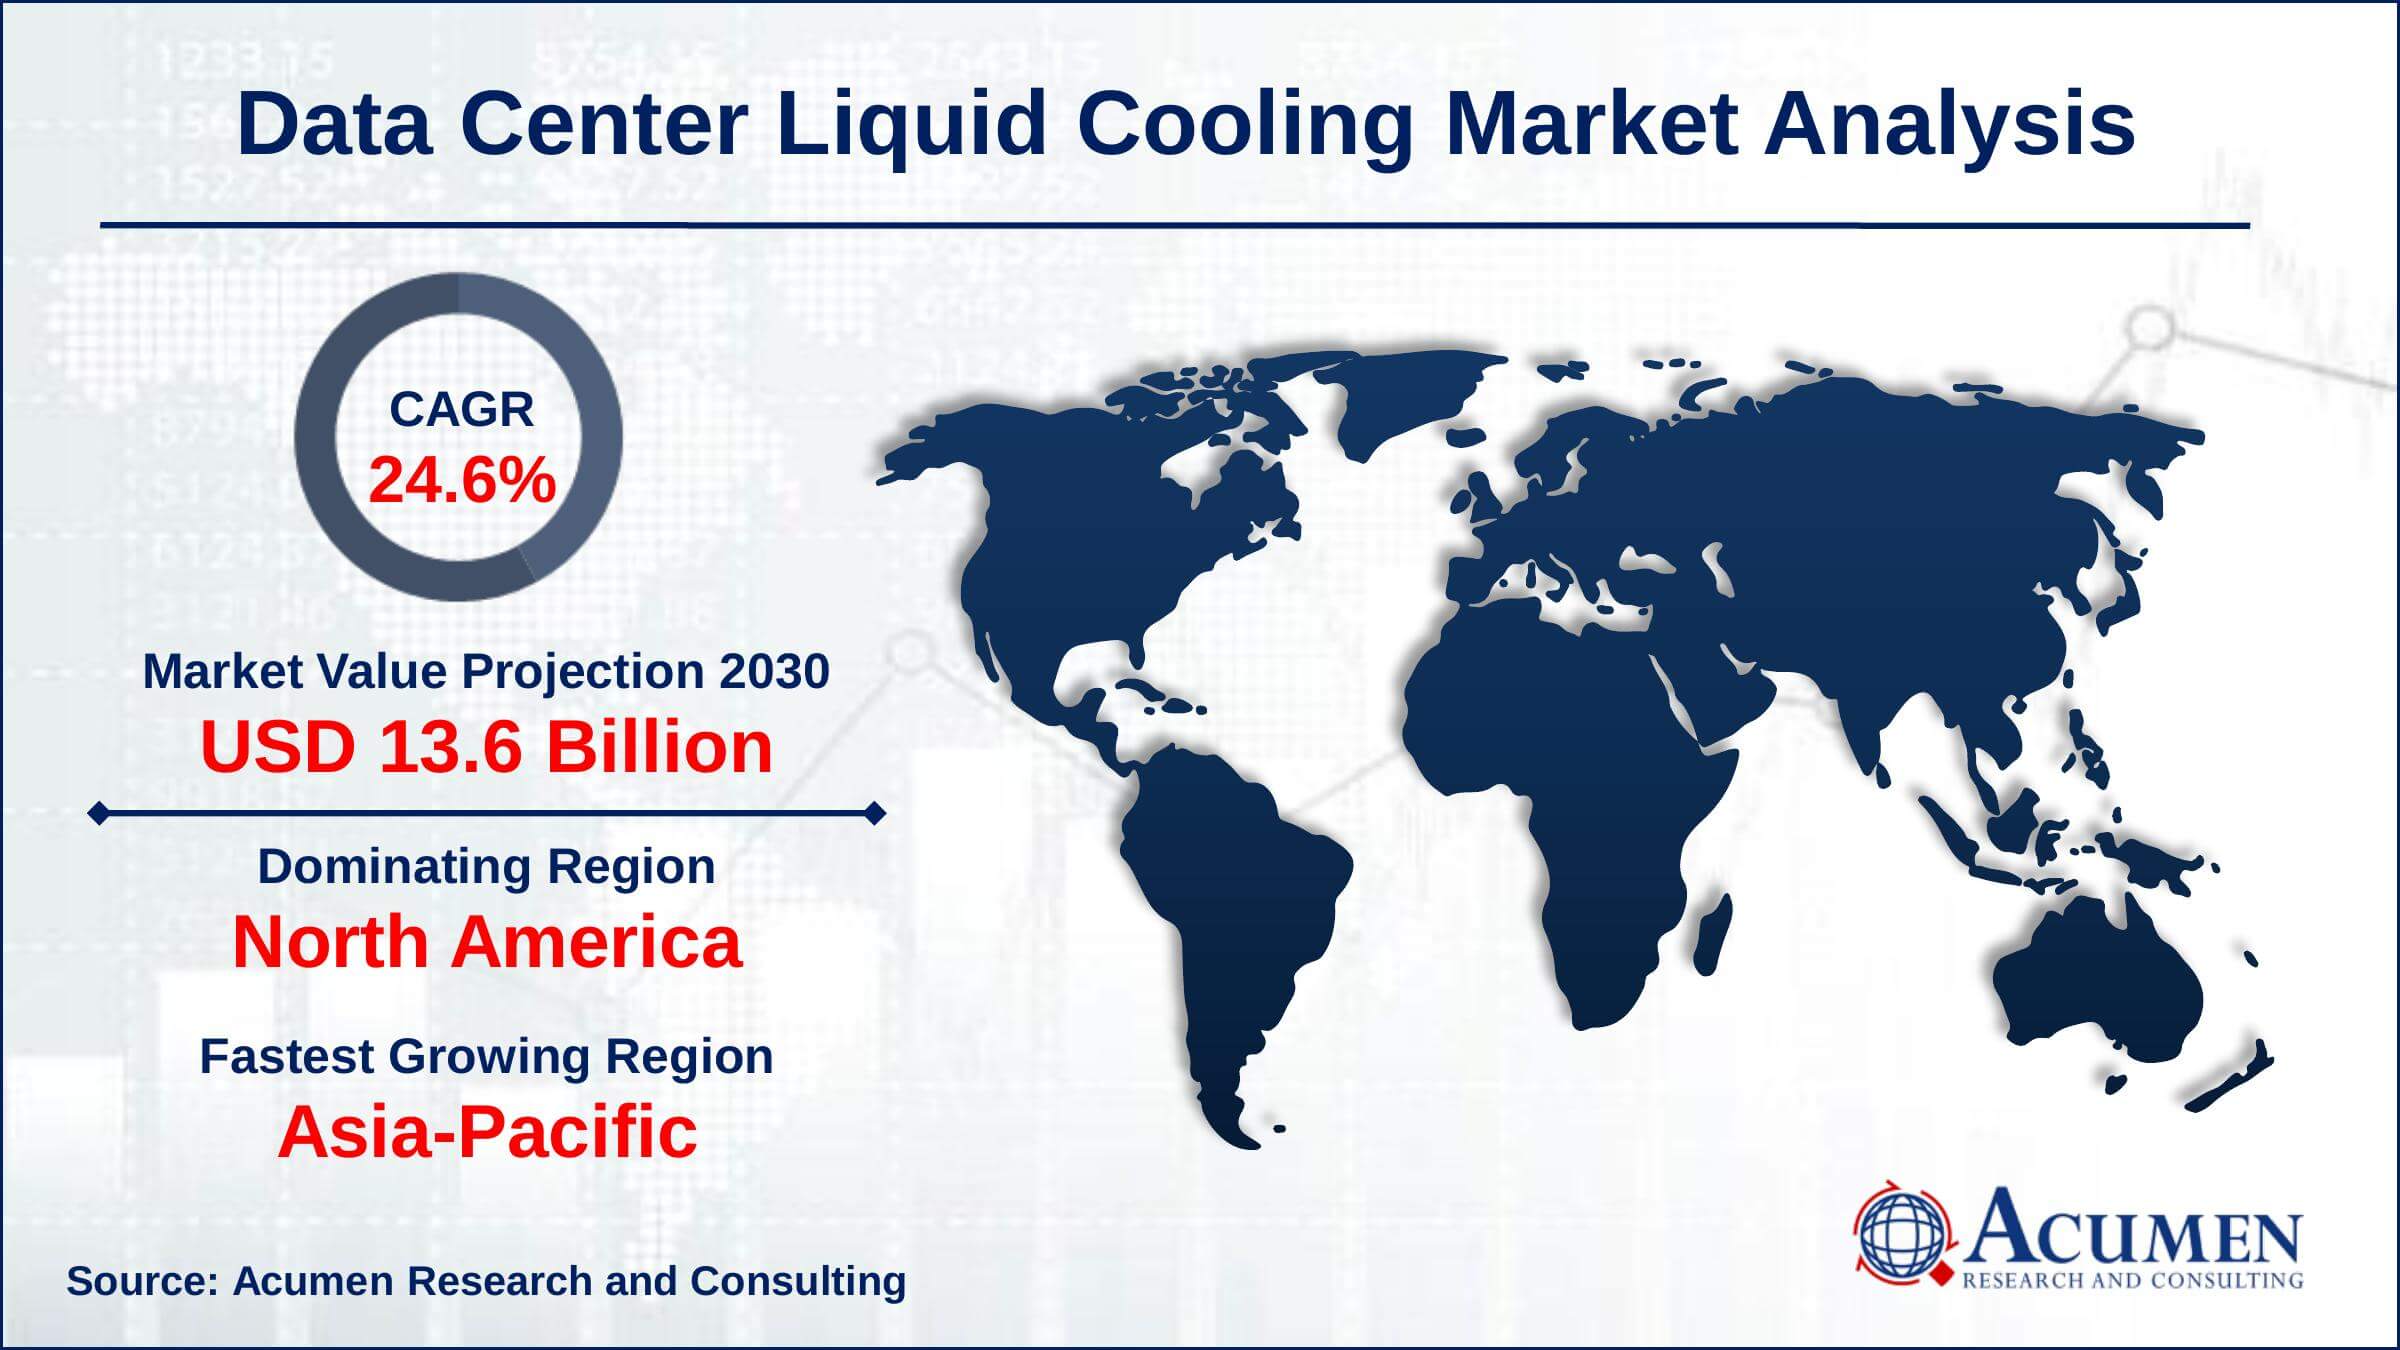
- Global data center liquid cooling market revenue is estimated to reach USD 13.6 Billion by 2030 with a CAGR of 24.6% from 2022 to 2030
- According to our analysis, there will be over 7.2 million data centers by 2022 across the world
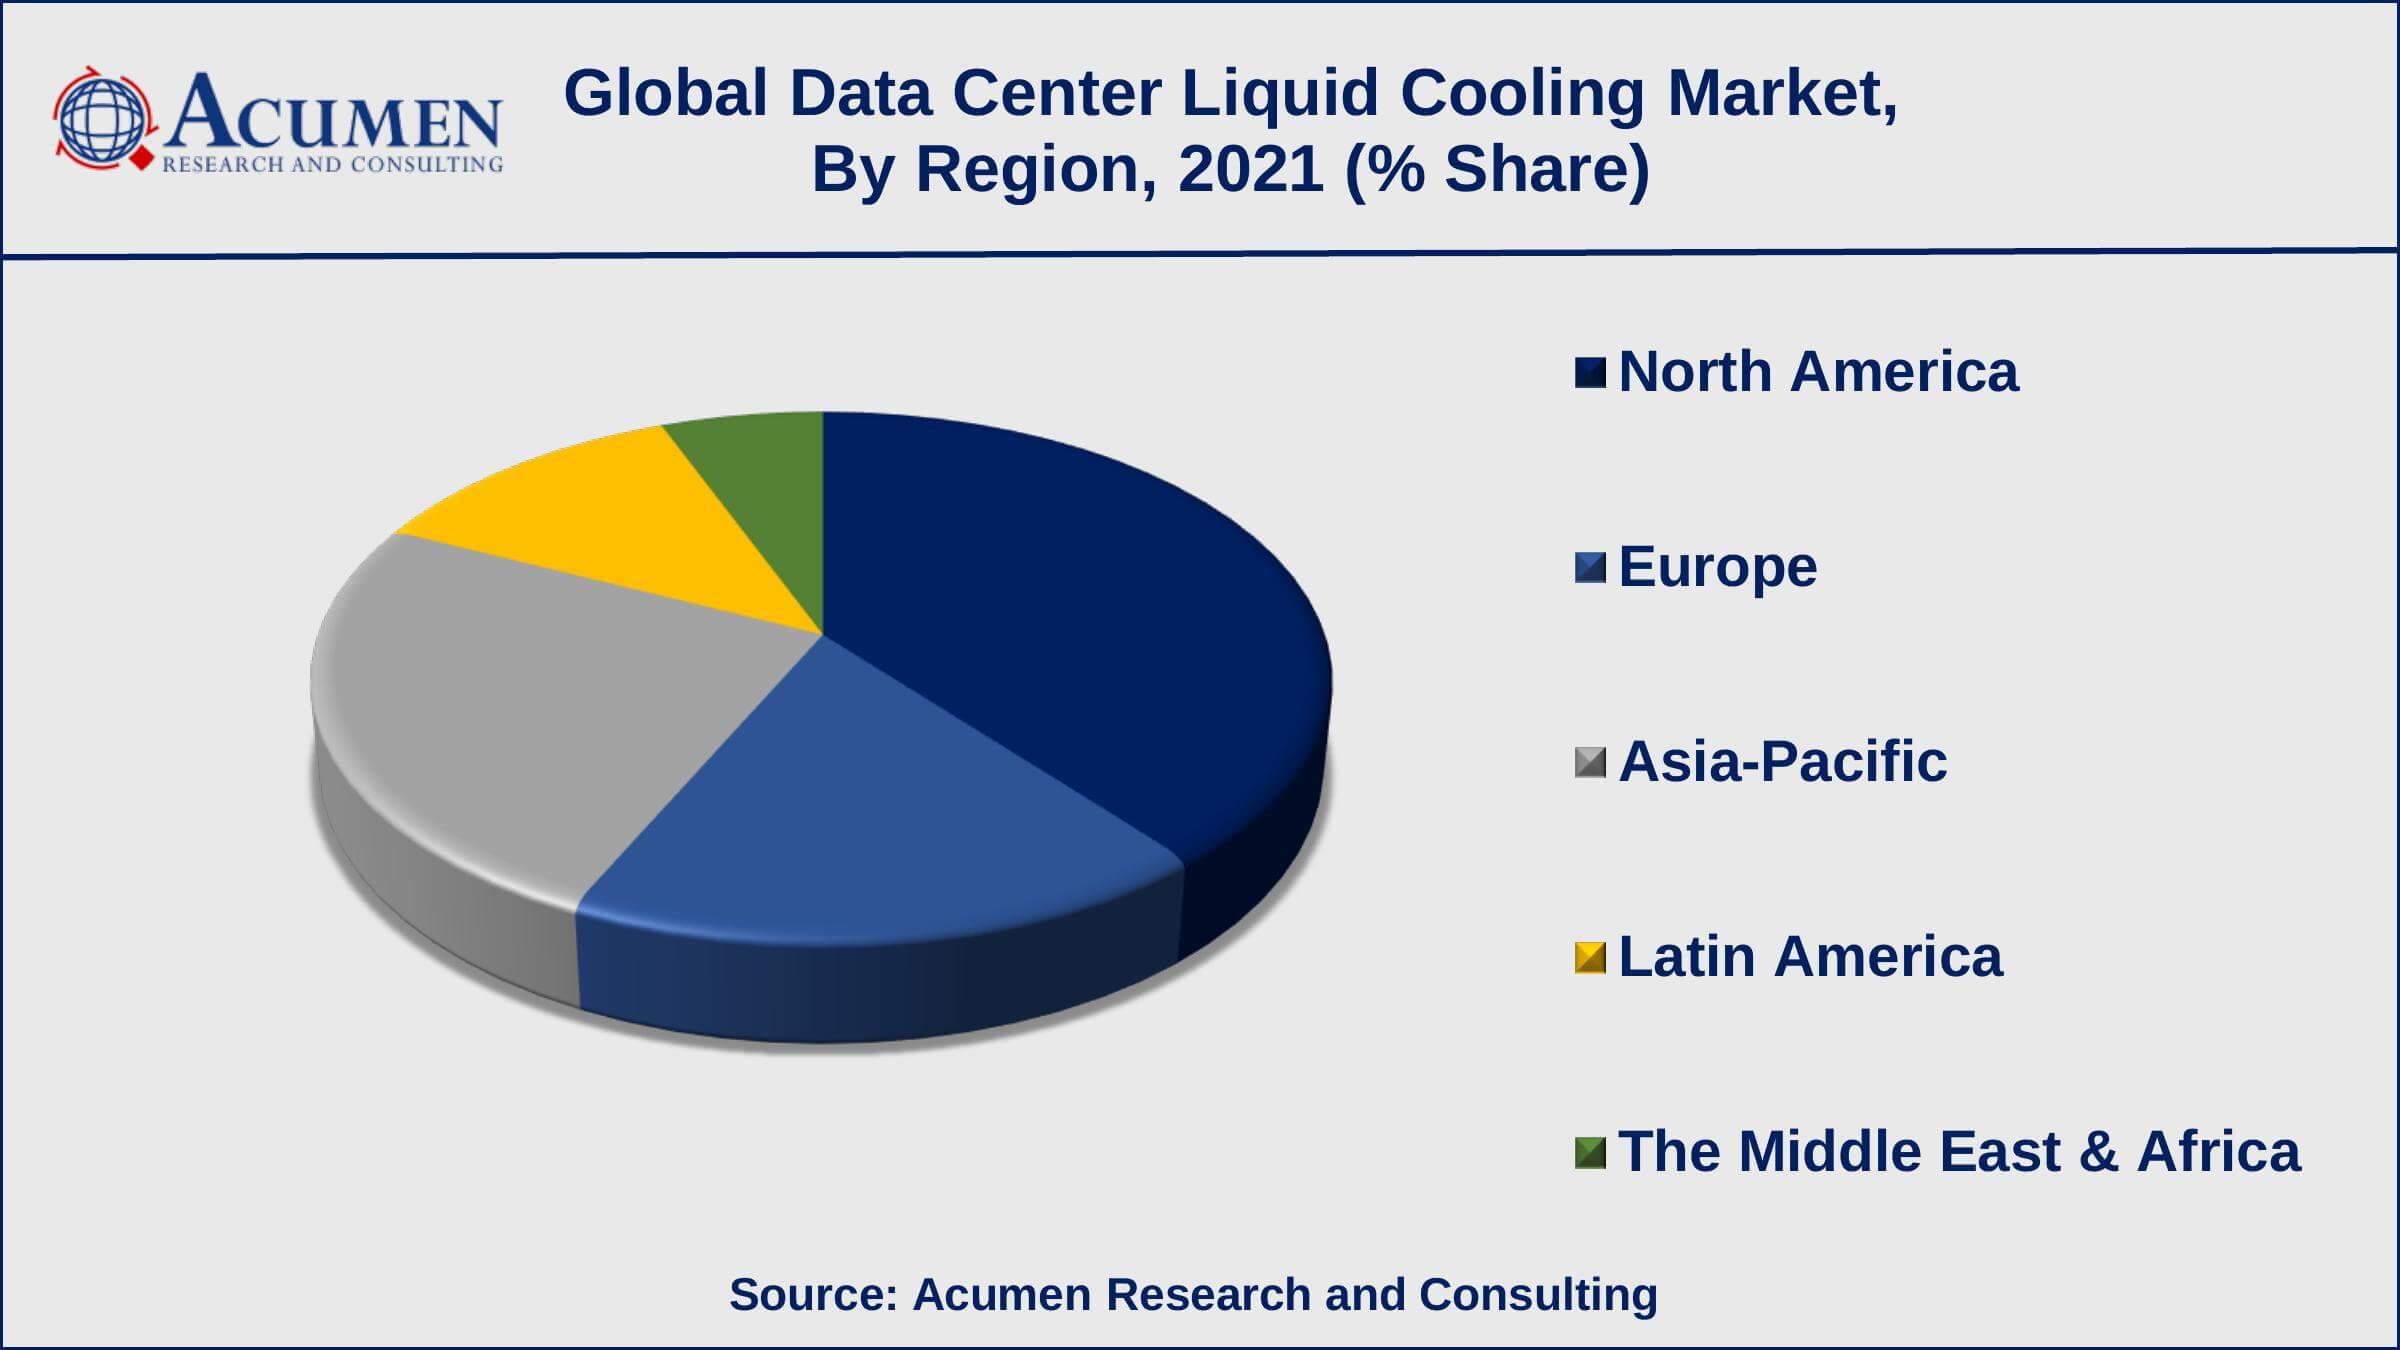
- North America data center liquid cooling market share generated over 37% shares in 2021
- Asia-Pacific data center liquid cooling market growth will record substantial CAGR of over 25% from 2022 to 2030
- Based on component, solution captured around 62% of the overall market share in 2021
- Surging need for cloud-based services is a popular data center liquid cooling market trend that is fueling the industry demand
Global Data Center Liquid Cooling Market Dynamics
Market Drivers
- Growing number of data centers and server density
- Increasing trend of energy-efficient cooling solutions
- Rising need for sub-merged data centers
- Surging demand for compact and noise-free solutions
Market Restraints
- High capital spending and maintenance
- Risk associated with data leakage
Market Opportunities
- Growing trend of cloud-computing, AI, crypto, and blockchain
- Upgradation and enhancement and of the existing legacy infrastructure
Data Center Liquid Cooling Market Report Coverage
Market |
Data Center Liquid Cooling Market |
Data Center Liquid Cooling Market Size 2021 |
USD 1.9 Billion |
Data Center Liquid Cooling Market Forecast 2030 |
USD 13.6 Billion |
Data Center Liquid Cooling Market CAGR During 2022 - 2030 |
24.6% |
Data Center Liquid Cooling Market Analysis Period |
2018 - 2030 |
Data Center Liquid Cooling Market Base Year |
2021 |
Data Center Liquid Cooling Market Forecast Data |
2022 - 2030 |
Segments Covered |
By Cooling Technique, By Component, By Application, And By Geography
|
Regional Scope |
North America, Europe, Asia Pacific, Latin America, and Middle East & Africa |
Key Companies Profiled |
Chilldyne Inc., Asetek, Mitsubishi Electric Corporation, CoolIT Systems Inc., Schneider Electric, Vertiv Co., Aecorsis BV, LiquidStack, Rittal GmbH & Co. Kg., and Alfa Laval. |
Report Coverage
|
Market Trends, Drivers, Restraints, Competitive Analysis, Player Profiling, Regulation Analysis |
Data Center Liquid Cooling Market Growth Factors
High quality, reliability and effective cooling advantages of data center liquid cooling market products are basically driving their utilization in a few applications including colocation, BFSI, manufacturing, and so on. A few administrators over the globe are confronting difficulties in keeping up suitable temperatures in their offices.
The key driver for the data center liquid cooling market is the expanding power and cooling need of current types of modern equipment. Another driver driving the data center liquid cooling market is high warmth stack inside numerous data centers is making it hard to oblige buy of new equipment which is confining the extension and constraining the development of the associations.
Need of heat management solutions and successful cooling for high density computer and blade servers is additionally the factor enlarging the demand for data center liquid cooling. The data center liquid cooling market is foreseen to develop in view of the cooling with diminished carbon impression because of the utilization of advanced engineering coolants. As liquids are denser than air, they accommodate an amazing cooling medium and subsequently are better conductors of heat energy. This further enlarges the demand for data center liquid cooling. Anyway Liquid is both conductive and destructive alongside power and any kind of rupture in the data center liquid cooling system can be devastating for the facilities and frameworks. This represents a noteworthy test for the data center liquid cooling market
Data Center Liquid Cooling Market Segmentation
The global data center liquid cooling market is segmented based on cooling technique, component, application, and geography.
Data Center Liquid Cooling Market By Cooling Technique
- Small and Mid-Sized Data Center
- Large Data Center
According to the data centre liquid cooling industry analysis, the large data centre sub-segment held the majority of the market share in 2021 and is expected to continue to do so in the coming years. The rise of digitization, rising business preference for cloud solutions, and robust demand from IoT, AI, and blockchain are all bolstering the large data centre industry. Furthermore, as businesses move toward digitalization, more data centers will be required, resulting in increased demand for liquid cooling in the industry. However, due to the increased number of small and medium-sized businesses, small and medium-sized data centers are expected to grow at a rapid pace.
Data Center Liquid Cooling Market By Component
- Solution
- Direct Immersion Cooling
- Single Phase Cooling
- Two Phase Cooling
- Indirect Cooling
- Rack Based Cooling
- Row Based Cooling
- Services
- Design & Consulting
- Installation & Deployment
- Maintenance & Support
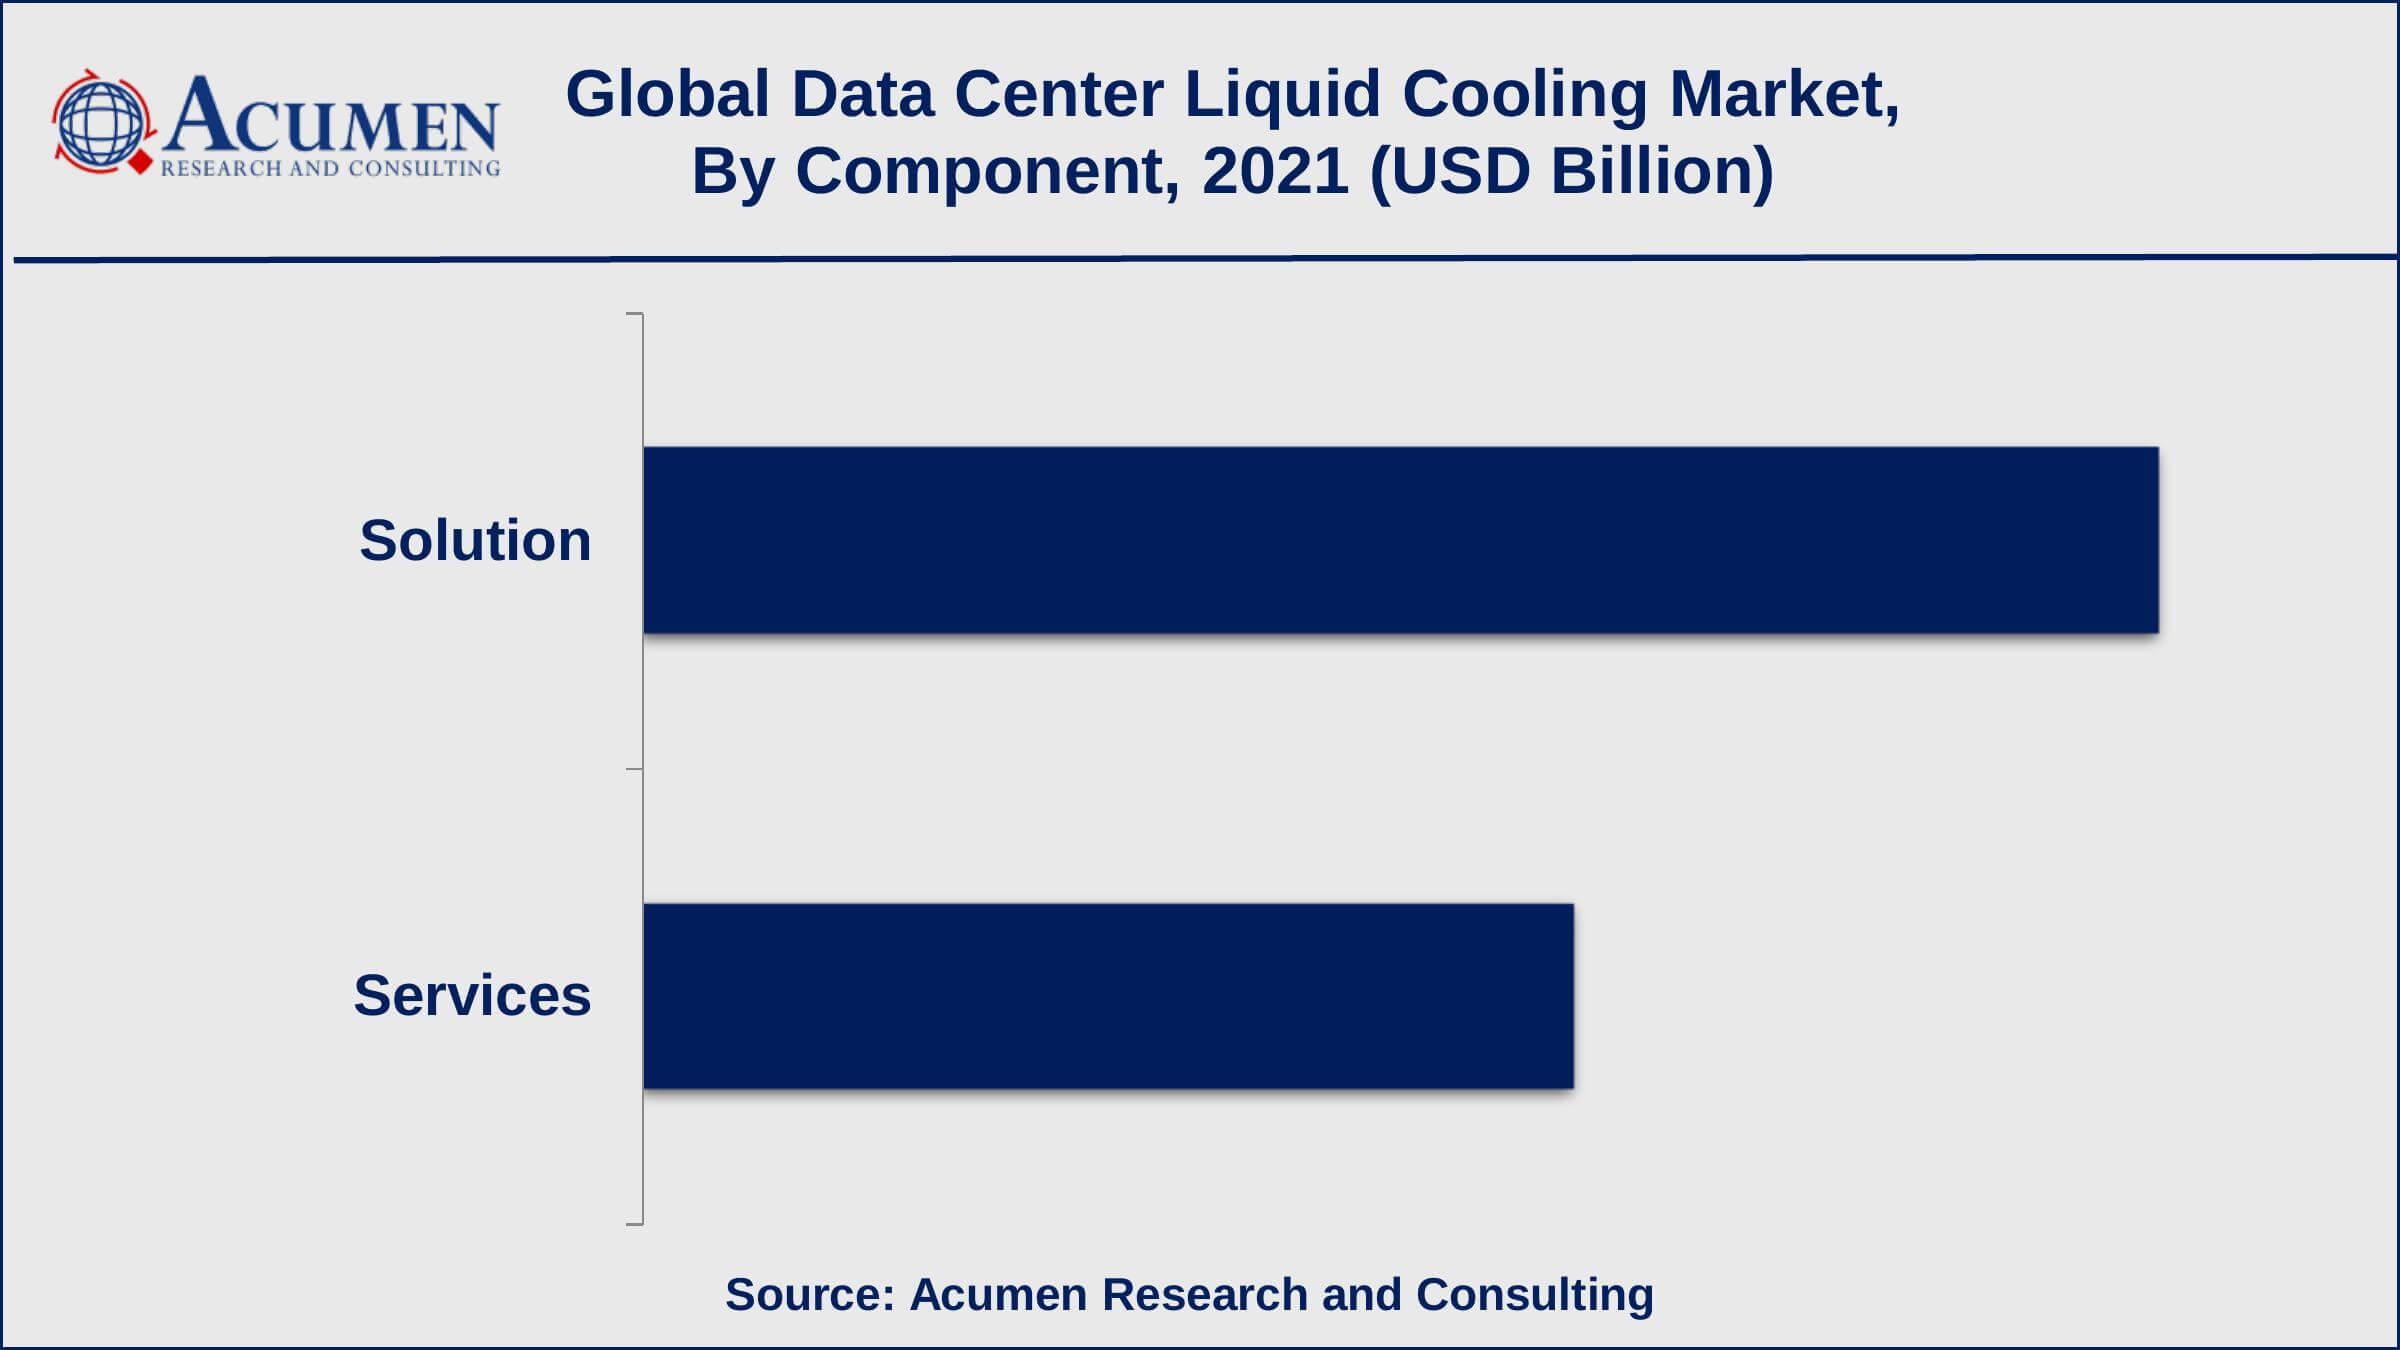
The solution sub-segment will lead the market from 2022 to 2030, according to the data centre liquid cooling market forecast. The services sub-segment, on the other hand, is expected to grow at the fastest CAGR during the forecast period. The segment's rapid growth can be attributed to the fact that data centers require custom-designed liquid cooling services as well as the elimination of heat transfer system overhead costs.
Data Center Liquid Cooling Market By Application
- BFSI
- Colocation
- Energy
- Government
- Healthcare
- Manufacturing
- IT & Telecom
- Others
The BFSI segment in the data center liquid cooling business sector will observer selection because of high remaining tasks at hand and computerized documentation in financial &banking institutions. It likewise incorporates high-recurrence block chain applications and exchanging systems, for example, cryptocurrencies and intelligent contracts. These systems incorporate immense measures of information and require proficient capacity and the executive’s abilities that help the utilization of data center facilities. So as to oversee warm and temperature levels in these offices, suppliers are moving towards liquid cooling options because of the productive execution benefits that further fuel the business development.
Data Center Liquid Cooling Market Regional Outlook
North America
Europe
- U.K.
- Germany
- France
- Spain
- Rest of Europe
Asia-Pacific
- India
- Japan
- China
- Australia
- South Korea
- Rest of Asia-Pacific
Latin America
- Brazil
- Mexico
- Rest of Latin America
The Middle East & Africa
- South Africa
- GCC Countries
- Rest of the Middle East & Africa (ME&A)
Data Center Liquid Cooling Market Regional Analysis
North America is quickly emerging in the data center liquid cooling market attributable to the presence of a few complex offices in the U.S. Heavy utilization use of digitized innovations in the nation and the need to deal with the gigantic information abilities bolster the business extension. In addition, significant enterprises including healthcare, manufacturing, colocation, IT & telecom, etc., and so forth are quickly pushing toward digitized tasks. The presence of a few data center& related component suppliers in the U.S. is a noteworthy driver for the regional development.
Data Center Liquid Cooling Market Players
The key enterprises operating in the world-wide data center liquid cooling market are Chilldyne Inc., Asetek, Mitsubishi Electric Corporation, CoolIT Systems Inc., Schneider Electric, Vertiv Co., Aecorsis BV, LiquidStack, Rittal GmbH & Co. Kg., and Alfa Laval.
CHAPTER 1. Industry Overview of Data Center Liquid Cooling Market
1.1. Definition and Scope
1.1.1. Definition of Data Center Liquid Cooling
1.1.2. Market Segmentation
1.1.3. Years Considered for the Study
1.1.4. Assumptions and Acronyms Used
1.1.4.1. Market Assumptions and Market Forecast
1.1.4.2. Acronyms Used in Global Data Center Liquid Cooling Market
1.2. Summary
1.2.1. Executive Summary
1.2.2. Data Center Liquid Cooling Market By Cooling Technique
1.2.3. Data Center Liquid Cooling Market By Component
1.2.4. Data Center Liquid Cooling Market By Application
1.2.5. Data Center Liquid Cooling Market By Region
CHAPTER 2. Research Approach
2.1. Methodology
2.1.1. Research Programs
2.1.2. Market Size Estimation
2.1.3. Market Breakdown and Data Triangulation
2.2. Data Source
2.2.1. Secondary Sources
2.2.2. Primary Sources
CHAPTER 3. Market Dynamics And Competition Analysis
3.1. Market Drivers
3.1.1. Driver 1
3.1.2. Driver 2
3.2. Restraints and Challenges
3.2.1. Restraint 1
3.2.2. Restraint 2
3.3. Growth Opportunities
3.3.1. Opportunity 1
3.3.2. Opportunity 2
3.4. Porter’s Five Forces Analysis
3.4.1. Bargaining Power of Suppliers
3.4.2. Bargaining Power of Buyers
3.4.3. Threat of Substitute
3.4.4. Threat of New Entrants
3.4.5. Degree of Competition
3.5. Market Concentration Ratio and Market Maturity Analysis of Data Center Liquid Cooling Market
3.5.1. Go To Market Strategy
3.5.1.1. Introduction
3.5.1.2. Growth
3.5.1.3. Maturity
3.5.1.4. Saturation
3.5.1.5. Possible Development
3.6. Technological Roadmap for Data Center Liquid Cooling Market
3.7. Value Chain Analysis
3.7.1. List of Key Manufacturers
3.7.2. List of Customers
3.7.3. Level of Integration
3.8. Regulatory Compliance
3.9. Competitive Landscape, 2021
3.9.1. Player Positioning Analysis
3.9.2. Key Strategies Adopted By Leading Players
CHAPTER 4. Data Center Liquid Cooling Market By Cooling Technique
4.1. Introduction
4.2. Data Center Liquid Cooling Revenue By Cooling Technique
4.2.1. Data Center Liquid Cooling Revenue (USD Billion) and Forecast, By Cooling Technique, 2018-2030
4.2.2. Small and Mid-Sized Data Center
4.2.2.1. Small and Mid-Sized Data Center Market Revenue (USD Billion) and Growth Rate (%), 2018-2030
4.2.3. Large Data Center
4.2.3.1. Large Data Center Market Revenue (USD Billion) and Growth Rate (%), 2018-2030
4.2.4. Electronic Manufacturing
4.2.4.1. Electronic Manufacturing Market Revenue (USD Billion) and Growth Rate (%), 2018-2030
4.2.5. Supply Chain Management
4.2.5.1. Supply Chain Management Market Revenue (USD Billion) and Growth Rate (%), 2018-2030
4.2.6. Others
4.2.6.1. Others Market Revenue (USD Billion) and Growth Rate (%), 2018-2030
CHAPTER 5. Data Center Liquid Cooling Market By Component
5.1. Introduction
5.2. Data Center Liquid Cooling Revenue By Component
5.2.1. Data Center Liquid Cooling Revenue (USD Billion) and Forecast, By Component, 2018-2030
5.2.2. Solution
5.2.2.1. Solution Market Revenue (USD Billion) and Growth Rate (%), 2018-2030
5.2.2.2. Direct Immersion Cooling
5.2.2.2.1. Direct Immersion Cooling Market Revenue (USD Billion) and Growth Rate (%), 2018-2030
5.2.2.2.2. Single Phase Cooling
5.2.2.2.2.1. Single Phase Cooling Market Revenue (USD Billion) and Growth Rate (%), 2018-2030
5.2.2.2.3. Two Phase Cooling
5.2.2.2.3.1. Two Phase Cooling Market Revenue (USD Billion) and Growth Rate (%), 2018-2030
5.2.2.3. Indirect Cooling
5.2.2.3.1. Indirect Cooling Market Revenue (USD Billion) and Growth Rate (%), 2018-2030
5.2.2.3.2. Rack Based Cooling
5.2.2.3.2.1. Rack Based Cooling Market Revenue (USD Billion) and Growth Rate (%), 2018-2030
5.2.2.3.3. Row Based Cooling
5.2.2.3.3.1. Row Based Cooling Market Revenue (USD Billion) and Growth Rate (%), 2018-2030
5.2.3. Services
5.2.3.1. Services Market Revenue (USD Billion) and Growth Rate (%), 2018-2030
5.2.3.2. Design & Consulting
5.2.3.2.1. Design & Consulting Market Revenue (USD Billion) and Growth Rate (%), 2018-2030
5.2.3.3. Maintenance & Support
5.2.3.3.1. Maintenance & Support Market Revenue (USD Billion) and Growth Rate (%), 2018-2030
5.2.3.4. Installation & Deployment
5.2.3.4.1. Installation & Deployment Market Revenue (USD Billion) and Growth Rate (%), 2018-2030
CHAPTER 6. Data Center Liquid Cooling Market By Application
6.1. Introduction
6.2. Data Center Liquid Cooling Revenue By Application
6.2.1. Data Center Liquid Cooling Revenue (USD Billion) and Forecast, By Application, 2018-2030
6.2.2. BFSI
6.2.2.1. BFSI Market Revenue (USD Billion) and Growth Rate (%), 2018-2030
6.2.3. Colocation
6.2.3.1. Colocation Market Revenue (USD Billion) and Growth Rate (%), 2018-2030
6.2.4. Energy
6.2.4.1. Energy Market Revenue (USD Billion) and Growth Rate (%), 2018-2030
6.2.5. Government
6.2.5.1. Government Market Revenue (USD Billion) and Growth Rate (%), 2018-2030
6.2.6. Healthcare
6.2.6.1. Healthcare Market Revenue (USD Billion) and Growth Rate (%), 2018-2030
6.2.7. Manufacturing
6.2.7.1. Manufacturing Market Revenue (USD Billion) and Growth Rate (%), 2018-2030
6.2.8. IT & Telecom
6.2.8.1. IT & Telecom Market Revenue (USD Billion) and Growth Rate (%), 2018-2030
6.2.9. Others
6.2.9.1. Others Market Revenue (USD Billion) and Growth Rate (%), 2018-2030
CHAPTER 7. North America Data Center Liquid Cooling Market By Country
7.1. North America Data Center Liquid Cooling Market Overview
7.2. U.S.
7.2.1. U.S. Data Center Liquid Cooling Revenue (USD Billion) and Forecast By Cooling Technique, 2018-2030
7.2.2. U.S. Data Center Liquid Cooling Revenue (USD Billion) and Forecast By Component, 2018-2030
7.2.3. U.S. Data Center Liquid Cooling Revenue (USD Billion) and Forecast By Application, 2018-2030
7.3. Canada
7.3.1. Canada Data Center Liquid Cooling Revenue (USD Billion) and Forecast By Cooling Technique, 2018-2030
7.3.2. Canada Data Center Liquid Cooling Revenue (USD Billion) and Forecast By Component, 2018-2030
7.3.3. Canada Data Center Liquid Cooling Revenue (USD Billion) and Forecast By Application, 2018-2030
7.4. North America PEST Analysis
CHAPTER 8. Europe Data Center Liquid Cooling Market By Country
8.1. Europe Data Center Liquid Cooling Market Overview
8.2. U.K.
8.2.1. U.K. Data Center Liquid Cooling Revenue (USD Billion) and Forecast By Cooling Technique, 2018-2030
8.2.2. U.K. Data Center Liquid Cooling Revenue (USD Billion) and Forecast By Component, 2018-2030
8.2.3. U.K. Data Center Liquid Cooling Revenue (USD Billion) and Forecast By Application, 2018-2030
8.3. Germany
8.3.1. Germany Data Center Liquid Cooling Revenue (USD Billion) and Forecast By Cooling Technique, 2018-2030
8.3.2. Germany Data Center Liquid Cooling Revenue (USD Billion) and Forecast By Component, 2018-2030
8.3.3. Germany Data Center Liquid Cooling Revenue (USD Billion) and Forecast By Application, 2018-2030
8.4. France
8.4.1. France Data Center Liquid Cooling Revenue (USD Billion) and Forecast By Cooling Technique, 2018-2030
8.4.2. France Data Center Liquid Cooling Revenue (USD Billion) and Forecast By Component, 2018-2030
8.4.3. France Data Center Liquid Cooling Revenue (USD Billion) and Forecast By Application, 2018-2030
8.5. Spain
8.5.1. Spain Data Center Liquid Cooling Revenue (USD Billion) and Forecast By Cooling Technique, 2018-2030
8.5.2. Spain Data Center Liquid Cooling Revenue (USD Billion) and Forecast By Component, 2018-2030
8.5.3. Spain Data Center Liquid Cooling Revenue (USD Billion) and Forecast By Application, 2018-2030
8.6. Rest of Europe
8.6.1. Rest of Europe Data Center Liquid Cooling Revenue (USD Billion) and Forecast By Cooling Technique, 2018-2030
8.6.2. Rest of Europe Data Center Liquid Cooling Revenue (USD Billion) and Forecast By Component, 2018-2030
8.6.3. Rest of Europe Data Center Liquid Cooling Revenue (USD Billion) and Forecast By Application, 2018-2030
8.7. Europe PEST Analysis
CHAPTER 9. Asia Pacific Data Center Liquid Cooling Market By Country
9.1. Asia Pacific Data Center Liquid Cooling Market Overview
9.2. China
9.2.1. China Data Center Liquid Cooling Revenue (USD Billion) and Forecast By Cooling Technique, 2018-2030
9.2.2. China Data Center Liquid Cooling Revenue (USD Billion) and Forecast By Component, 2018-2030
9.2.3. China Data Center Liquid Cooling Revenue (USD Billion) and Forecast By Application, 2018-2030
9.3. Japan
9.3.1. Japan Data Center Liquid Cooling Revenue (USD Billion) and Forecast By Cooling Technique, 2018-2030
9.3.2. Japan Data Center Liquid Cooling Revenue (USD Billion) and Forecast By Component, 2018-2030
9.3.3. Japan Data Center Liquid Cooling Revenue (USD Billion) and Forecast By Application, 2018-2030
9.4. India
9.4.1. India Data Center Liquid Cooling Revenue (USD Billion) and Forecast By Cooling Technique, 2018-2030
9.4.2. India Data Center Liquid Cooling Revenue (USD Billion) and Forecast By Component, 2018-2030
9.4.3. India Data Center Liquid Cooling Revenue (USD Billion) and Forecast By Application, 2018-2030
9.5. Australia
9.5.1. Australia Data Center Liquid Cooling Revenue (USD Billion) and Forecast By Cooling Technique, 2018-2030
9.5.2. Australia Data Center Liquid Cooling Revenue (USD Billion) and Forecast By Component, 2018-2030
9.5.3. Australia Data Center Liquid Cooling Revenue (USD Billion) and Forecast By Application, 2018-2030
9.6. South Korea
9.6.1. South Korea Data Center Liquid Cooling Revenue (USD Billion) and Forecast By Cooling Technique, 2018-2030
9.6.2. South Korea Data Center Liquid Cooling Revenue (USD Billion) and Forecast By Component, 2018-2030
9.6.3. South Korea Data Center Liquid Cooling Revenue (USD Billion) and Forecast By Application, 2018-2030
9.7. Rest of Asia-Pacific
9.7.1. Rest of Asia-Pacific Data Center Liquid Cooling Revenue (USD Billion) and Forecast By Cooling Technique, 2018-2030
9.7.2. Rest of Asia-Pacific Data Center Liquid Cooling Revenue (USD Billion) and Forecast By Component, 2018-2030
9.7.3. Rest of Asia-Pacific Data Center Liquid Cooling Revenue (USD Billion) and Forecast By Application, 2018-2030
9.8. Asia Pacific PEST Analysis
CHAPTER 10. Latin America Data Center Liquid Cooling Market By Country
10.1. Latin America Data Center Liquid Cooling Market Overview
10.2. Brazil
10.2.1. Brazil Data Center Liquid Cooling Revenue (USD Billion) and Forecast By Cooling Technique, 2018-2030
10.2.2. Brazil Data Center Liquid Cooling Revenue (USD Billion) and Forecast By Component, 2018-2030
10.2.3. Brazil Data Center Liquid Cooling Revenue (USD Billion) and Forecast By Application, 2018-2030
10.3. Mexico
10.3.1. Mexico Data Center Liquid Cooling Revenue (USD Billion) and Forecast By Cooling Technique, 2018-2030
10.3.2. Mexico Data Center Liquid Cooling Revenue (USD Billion) and Forecast By Component, 2018-2030
10.3.3. Mexico Data Center Liquid Cooling Revenue (USD Billion) and Forecast By Application, 2018-2030
10.4. Rest of Latin America
10.4.1. Rest of Latin America Data Center Liquid Cooling Revenue (USD Billion) and Forecast By Cooling Technique, 2018-2030
10.4.2. Rest of Latin America Data Center Liquid Cooling Revenue (USD Billion) and Forecast By Component, 2018-2030
10.4.3. Rest of Latin America Data Center Liquid Cooling Revenue (USD Billion) and Forecast By Application, 2018-2030
10.5. Latin America PEST Analysis
CHAPTER 11. Middle East & Africa Data Center Liquid Cooling Market By Country
11.1. Middle East & Africa Data Center Liquid Cooling Market Overview
11.2. GCC
11.2.1. GCC Data Center Liquid Cooling Revenue (USD Billion) and Forecast By Cooling Technique, 2018-2030
11.2.2. GCC Data Center Liquid Cooling Revenue (USD Billion) and Forecast By Component, 2018-2030
11.2.3. GCC Data Center Liquid Cooling Revenue (USD Billion) and Forecast By Application, 2018-2030
11.3. South Africa
11.3.1. South Africa Data Center Liquid Cooling Revenue (USD Billion) and Forecast By Cooling Technique, 2018-2030
11.3.2. South Africa Data Center Liquid Cooling Revenue (USD Billion) and Forecast By Component, 2018-2030
11.3.3. South Africa Data Center Liquid Cooling Revenue (USD Billion) and Forecast By Application, 2018-2030
11.4. Rest of Middle East & Africa
11.4.1. Rest of Middle East & Africa Data Center Liquid Cooling Revenue (USD Billion) and Forecast By Cooling Technique, 2018-2030
11.4.2. Rest of Middle East & Africa Data Center Liquid Cooling Revenue (USD Billion) and Forecast By Component, 2018-2030
11.4.3. Rest of Middle East & Africa Data Center Liquid Cooling Revenue (USD Billion) and Forecast By Application, 2018-2030
11.5. Middle East & Africa PEST Analysis
CHAPTER 12. Player Analysis Of Data Center Liquid Cooling Market
12.1. Data Center Liquid Cooling Market Company Share Analysis
12.2. Competition Matrix
12.2.1. Competitive Benchmarking of key players by price, presence, market share, and R&D investment
12.2.2. New Product Launches and Product Enhancements
12.2.3. Mergers And Acquisition In Global Data Center Liquid Cooling Market
12.2.4. Partnership, Joint Ventures and Strategic Alliances/ Sales Agreements
CHAPTER 13. Company Profile
13.1. Chilldyne Inc.
13.1.1. Company Snapshot
13.1.2. Business Overview
13.1.3. Financial Overview
13.1.3.1. Revenue (USD Billion), 2021
13.1.3.2. Chilldyne Inc.2021 Data Center Liquid Cooling Business Regional Distribution
13.1.4. Product /Service and Specification
13.1.5. Recent Developments & Business Strategy
13.2. Asetek
13.3. Mitsubishi Electric Corporation
13.4. CoolIT Systems Inc.
13.5. Schneider Electric
13.6. Vertiv Co.
13.7. Aecorsis BV
13.8. LiquidStack
13.9. Rittal GmbH & Co. Kg.
13.10. Alfa Laval