Controlled Release Drug Delivery Market | Acumen Research and Consulting
Controlled Release Drug Delivery Market Size - Global Industry, Share, Analysis, Trends and Forecast 2024 - 2032
Published :
Report ID:
Pages :
Format :
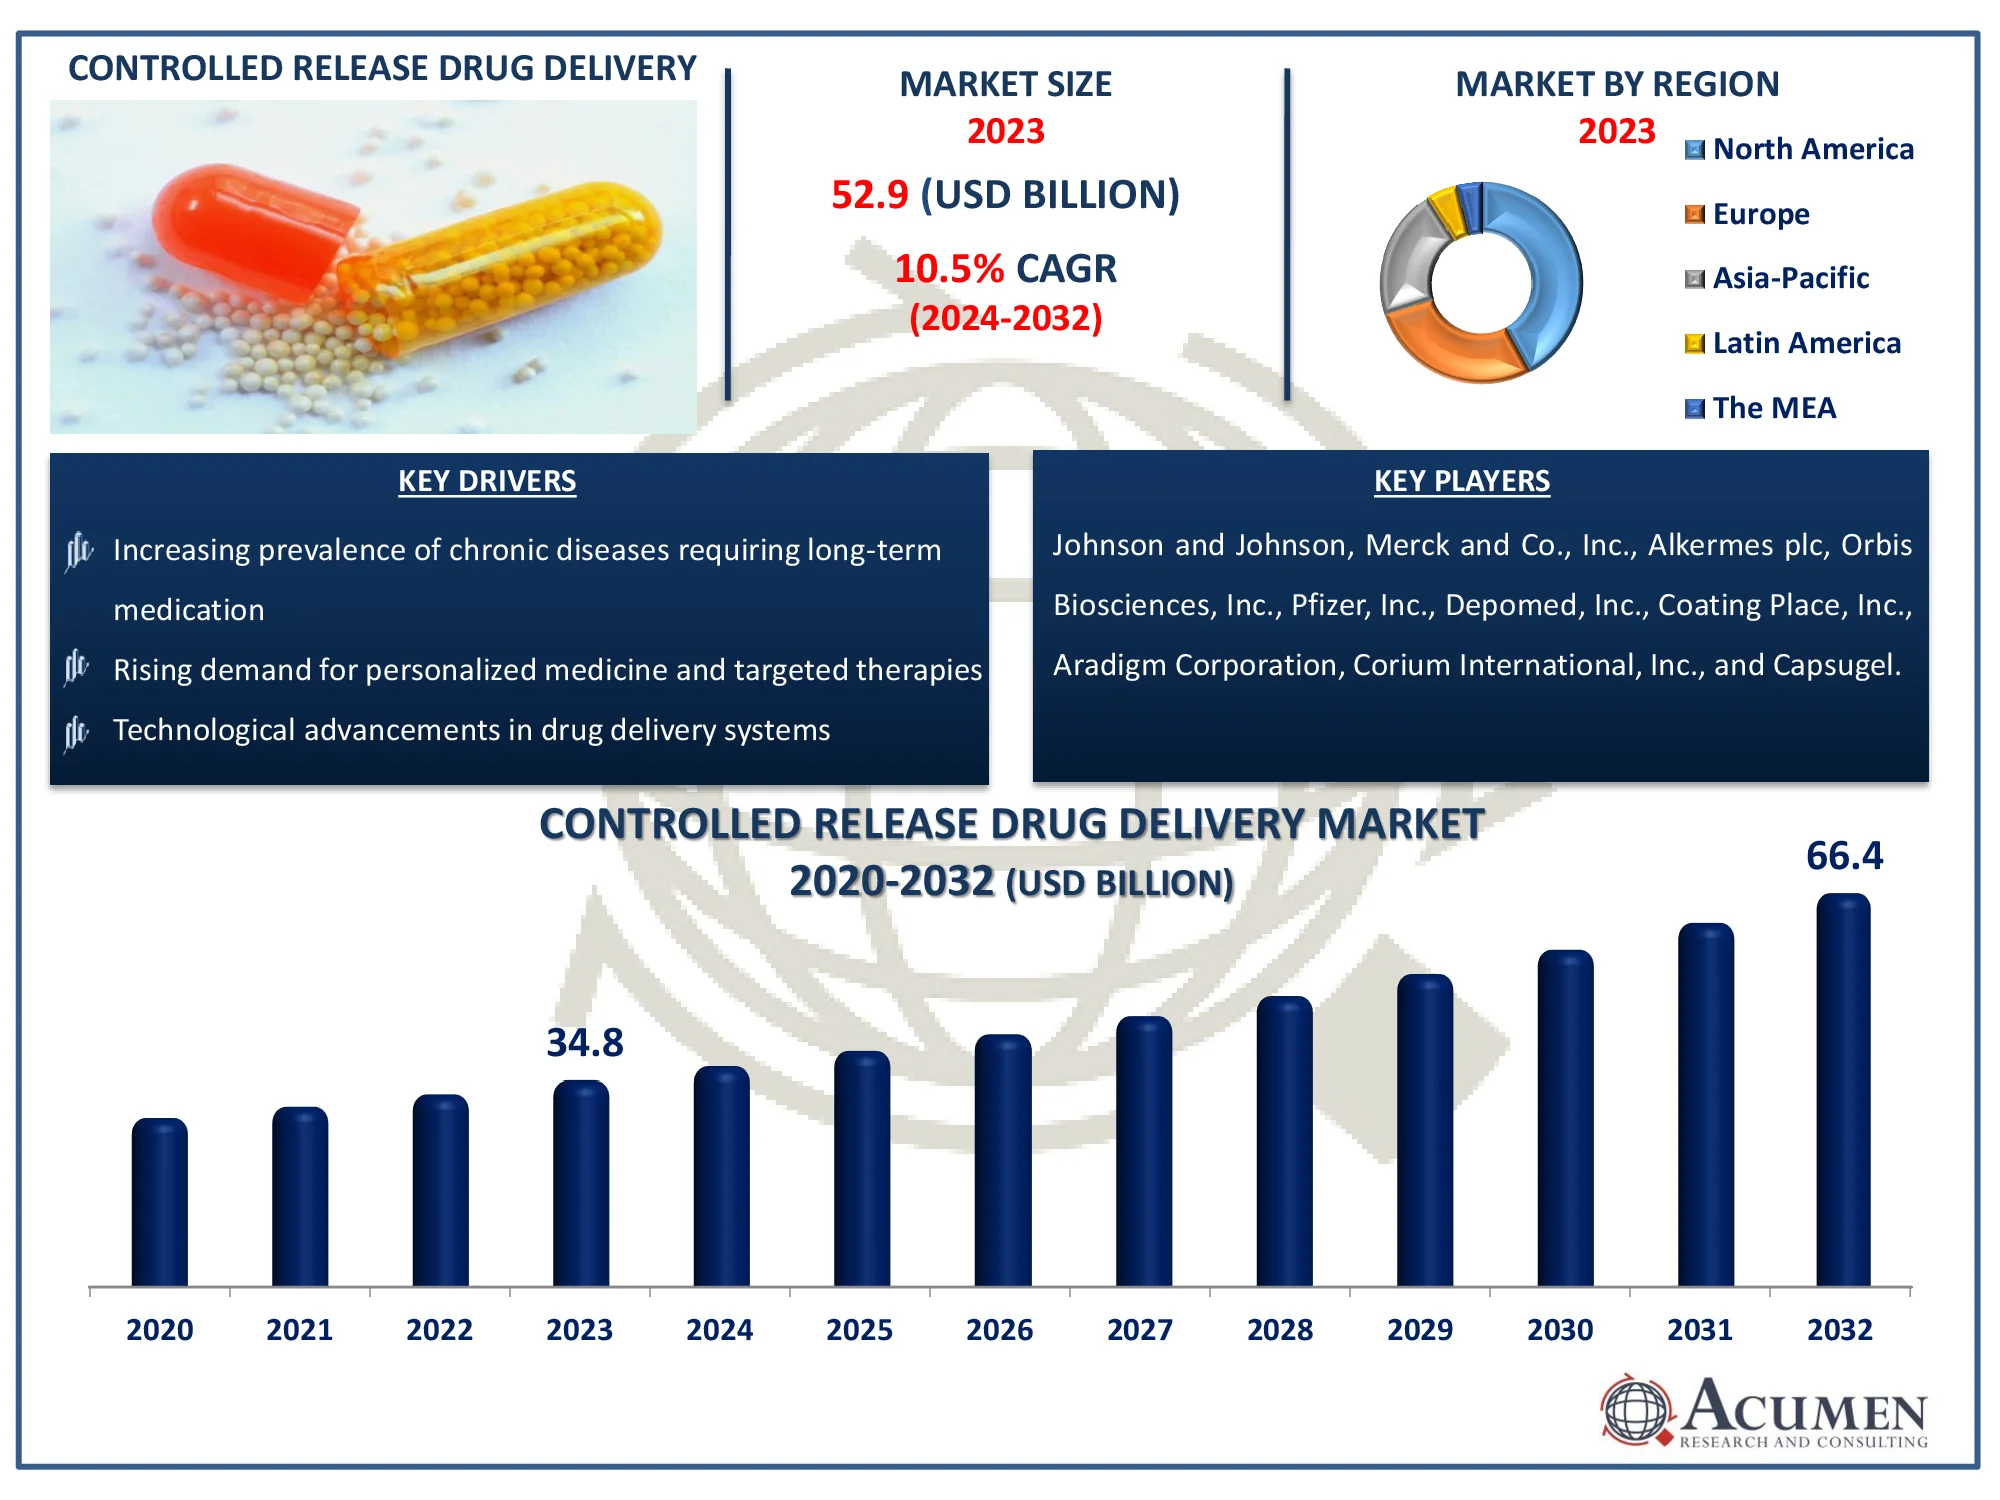
The Global Controlled Release Drug Delivery Market Size accounted for USD 52.9 Billion in 2023 and is estimated to achieve a market size of USD 128.7 Billion by 2032 growing at a CAGR of 10.5% from 2024 to 2032.
Controlled Release Drug Delivery Market Highlights
- Global controlled release drug delivery market revenue is poised to garner USD 128.7 billion by 2032 with a CAGR of 10.5% from 2024 to 2032
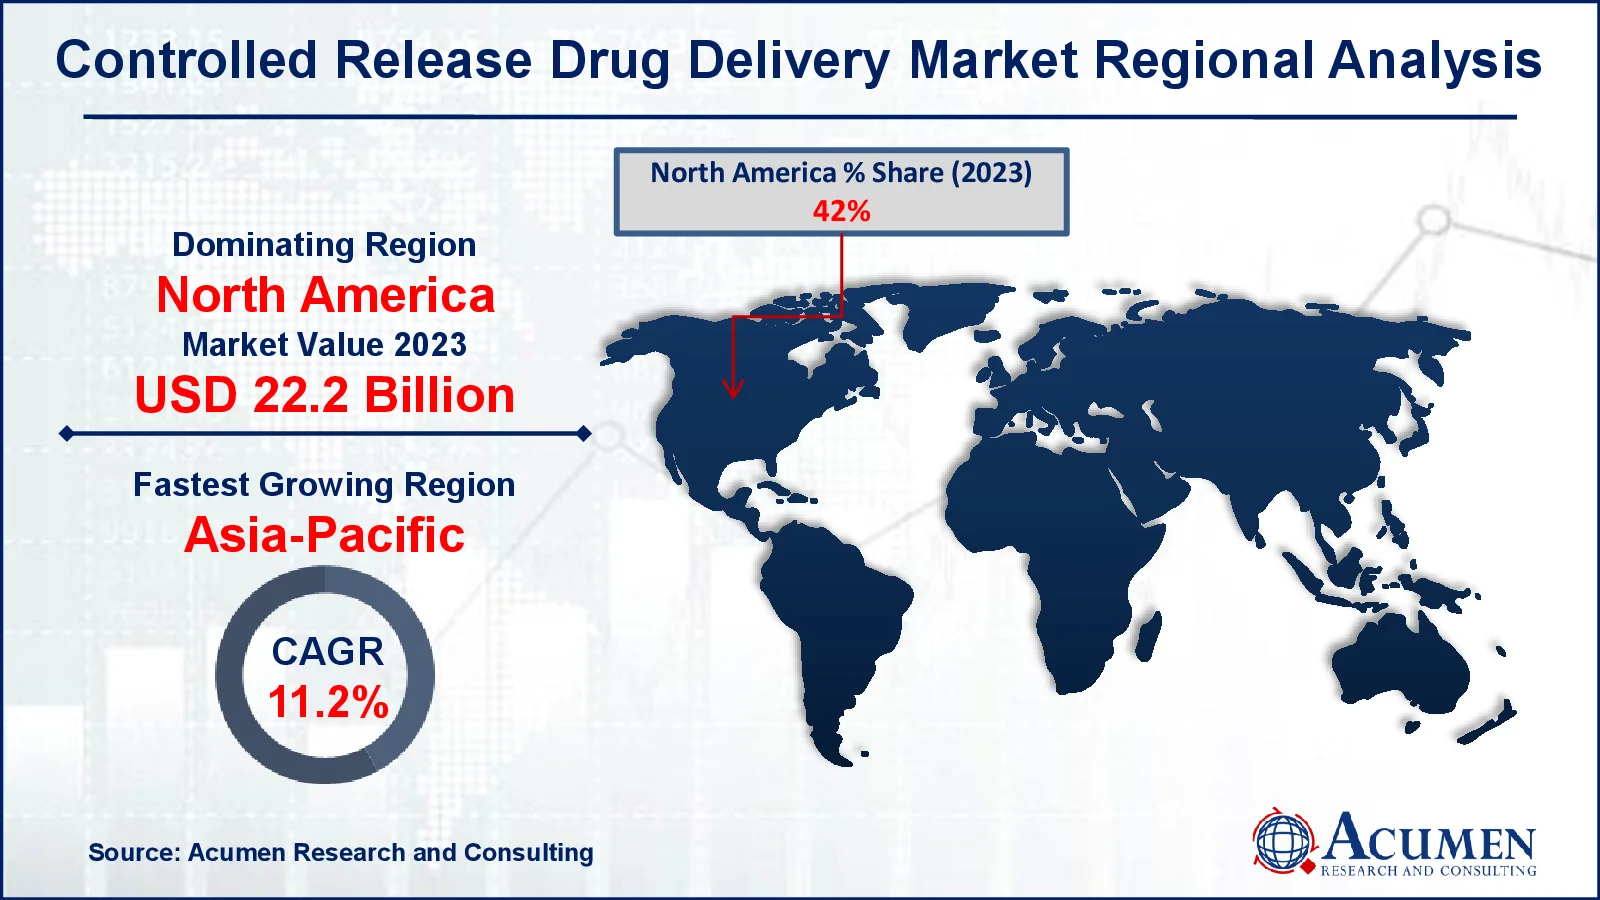
- North America controlled release drug delivery market value occupied around USD 22.2 billion in 2023
- Asia-Pacific controlled release drug delivery market growth will record a CAGR of more than 11.2% from 2024 to 2032
- Among release mechanism, the feedback regulated drug delivery systems generator sub-segment generated more than USD 14.3 billion revenue in 2023
- Based on technology, the targeted delivery sub-segment generated around 24% market share in 2023
- Potential for hybrid systems combining controlled release drug delivery with other renewable sources is a popular controlled release drug delivery market trend that fuels the industry demand

Controlled release drug delivery refers to a method of administering medication in a way that maintains a specific concentration of the drug in the bloodstream over an extended period. This approach aims to enhance the therapeutic effect and reduce side effects by releasing the drug gradually. Controlled release systems can use various technologies, such as polymers, hydrogels, or encapsulation techniques, to regulate the rate and duration of drug release. Unlike immediate-release formulations, which release the drug all at once, controlled release formulations provide a steady and predictable drug release profile. This method improves patient compliance by reducing the frequency of dosing and can be particularly beneficial for chronic conditions requiring stable drug levels.
Global Controlled Release Drug Delivery Market Dynamics
Market Drivers
- Rising demand for personalized medicine and targeted therapies
- Increasing prevalence of chronic diseases requiring long-term medication
- Technological advancements in drug delivery systems
- Growing preference for patient-friendly drug formulations
Market Restraints
- High development and production costs of controlled release systems
- Regulatory challenges and lengthy approval processes
- Complexity in formulation and manufacturing processes
Market Opportunities
- Expansion in emerging markets with increasing healthcare investments
- Innovations in nanotechnology and biomaterials for advanced drug delivery
- Growing market for biologics and complex drugs needing controlled release
Controlled Release Drug Delivery Market Report Coverage
| Market | Controlled Release Drug Delivery Market |
| Controlled Release Drug Delivery Market Size 2022 |
USD 52.9 Million |
| Controlled Release Drug Delivery Market Forecast 2032 | USD 128.7 Billion |
| Controlled Release Drug Delivery Market CAGR During 2023 - 2032 | 10.5% |
| Controlled Release Drug Delivery Market Analysis Period | 2020 - 2032 |
| Controlled Release Drug Delivery Market Base Year |
2022 |
| Controlled Release Drug Delivery Market Forecast Data | 2024 - 2032 |
| Segments Covered | By Release Mechanism, By Technology, By Application, And By Geography |
| Regional Scope | North America, Europe, Asia Pacific, Latin America, and Middle East & Africa |
| Key Companies Profiled | Johnson and Johnson, Merck and Co., Inc., Alkermes plc, Orbis Biosciences, Inc., Pfizer, Inc., Depomed, Inc., Coating Place, Inc., Aradigm Corporation, Corium International, Inc., and Capsugel. |
| Report Coverage |
Market Trends, Drivers, Restraints, Competitive Analysis, Player Profiling, Covid-19 Analysis, Regulation Analysis |
Controlled Release Drug Delivery Market Insights
The controlled release drug delivery market is experiencing significant growth due to the rising demand for pediatric and geriatric delivery methods, as well as substitute therapies. Increased awareness of the benefits of controlled release systems over conventional forms is also driving this market expansion. Controlled release technologies offer numerous advantages compared to traditional drug delivery methods. These include a consistent drug effect, reduced dosage, fewer gastrointestinal side effects, decreased dosage frequency, enhanced patient compliance, improved drug efficacy and safety, and reduced fluctuations in plasma drug levels. These benefits make controlled release systems more desirable for long-term and chronic treatments.
These systems allow for a reduction in the amount and frequency of doses, increasing patient compliance and acceptance. They provide less fluctuation in plasma drug levels, ensure a uniform drug effect, and improve the effectiveness of the administered therapeutic. Unlike traditional delivery methods, controlled release systems achieve a prolonged therapeutic effect, enhance reliability in drug release dynamics, and enable delivery at a predetermined rate, either locally or systemically. Due to these numerous advantages, the adoption of market is expected to grow at an impressive rate in the controlled release drug delivery industry forecast period.
Controlled Release Drug Delivery Market Segmentation
The worldwide market for controlled release drug delivery is split based on release mechanism, technology, application, and geography.
Controlled Release Drug Delivery Market By Release Mechanisms
- Polymer Based Systems
- Micro Reservoir Partition Controlled Drug Delivery Systems
- Feedback Regulated Drug Delivery Systems
- Activation-modulated Drug Delivery Systems
- Osmotic Pressure Activated
- Hydrodynamic Pressure Activated
- Vapor Pressure Activated
- Mechanically Activated
- Magnetically Activated
- Chemically Activated
- pH Activated
- Hydrolysis Activated
- Enzyme Activated
According to controlled release drug delivery industry analysis, the market is segmented by release mechanisms, including polymer-based systems, micro reservoir partition controlled drug delivery systems, feedback regulated drug delivery systems, activation-modulated drug delivery systems, and chemically activated drug delivery systems. Among these, the feedback regulated drug delivery systems segment holds the largest market share.
Chemically activated systems release drugs in response to specific chemical stimuli in the body, ensuring precise and timely drug administration. Feedback regulated systems further enhance this precision by adjusting the drug release based on real-time physiological feedback. This dynamic approach allows for more effective and tailored treatments, reducing the risk of over- or under-dosing. These systems are particularly advantageous for managing chronic conditions that require stable and consistent medication levels. The increasing prevalence of chronic diseases and the demand for personalized medicine contribute to the dominance of this segment, as these technologies offer superior control over drug delivery, improving patient outcomes and compliance.
Controlled Release Drug Delivery Market By Technologies
- Wurster Technique
- Coacervation
- Micro Encapsulation
- Implants
- Transdermal
- Targeted Delivery
- Others
The targeted delivery segment in the controlled release drug delivery market stands out prominently due to its precision and efficiency in delivering medication directly to specific sites within the body. This technology utilizes various mechanisms, such as ligand-based targeting, to direct drug molecules to particular cells, tissues, or organs. By focusing the drug's action on the intended site, targeted delivery minimizes systemic side effects and enhances therapeutic efficacy.
Advancements in nanotechnology have significantly propelled this segment, enabling the development of nanoparticles and other carriers that can navigate the complex biological environment to reach their target. This precise approach is particularly beneficial in treating diseases like cancer, where targeted delivery can concentrate the therapeutic agent at the tumor site, sparing healthy tissues. The increasing incidence of such diseases and the demand for more effective and less invasive treatments drive the growth of this segment. As a result, targeted delivery is gaining traction, offering promising prospects for the future of controlled release drug delivery.
Controlled Release Drug Delivery Market By Applications
- Metered Dose Inhalers
- Injectable
- Transdermal and Ocular Patches
- Infusion Pumps
- Oral Controlled-drug delivery Systems
- Drug Eluting Stents
The oral controlled-drug delivery systems segment is a leading area within the controlled release drug delivery market. This prominence is due to the convenience and patient compliance associated with oral medications. These systems are designed to release drugs at a predetermined rate, ensuring a consistent therapeutic effect over an extended period. This method reduces the frequency of dosing, making it easier for patients to adhere to their treatment regimens.
Technological advancements have led to the development of sophisticated formulations, such as matrix tablets and multi-particulate systems, which enhance the precision and reliability of drug release. These innovations are particularly valuable for managing chronic conditions, such as diabetes and hypertension, where maintaining stable drug levels is crucial. The growing prevalence of such conditions, along with the increasing demand for patient-friendly and effective treatment options, drives the expansion of the oral controlled-drug delivery systems segment. This segment's ability to improve therapeutic outcomes while enhancing patient experience underscores its significance in the market.
Controlled Release Drug Delivery Market Regional Outlook
North America
- U.S.
- Canada
Europe
- U.K.
- Germany
- France
- Spain
- Rest of Europe
Asia-Pacific
- India
- Japan
- China
- Australia
- South Korea
- Rest of Asia-Pacific
Latin America
- Brazil
- Mexico
- Rest of Latin America
The Middle East & Africa
- South Africa
- GCC Countries
- Rest of the Middle East & Africa (ME&A)

Controlled Release Drug Delivery Market Regional Analysis
In terms of controlled release drug delivery market analysis, North America dominates the industry due to advanced healthcare infrastructure, high healthcare expenditure, and significant investment in research and development. The presence of major pharmaceutical companies and a high prevalence of chronic diseases further bolster market growth in this region. Europe Holds a substantial market share, driven by strong regulatory frameworks, extensive research initiatives, and a well-established pharmaceutical sector. Countries like Germany, the UK, and France are prominent contributors to the market. Asia-Pacific expected to witness the highest growth rate during the controlled release drug delivery market forecast period due to the increasing healthcare spending, improving healthcare infrastructure, and rising prevalence of chronic diseases. Rapid economic development in countries like China and India, along with a growing focus on personalized medicine, fuels market expansion.
Controlled Release Drug Delivery Market Players
Some of the top controlled release drug delivery companies offered in our report includes Johnson and Johnson, Merck and Co., Inc., Alkermes plc, Orbis Biosciences, Inc., Pfizer, Inc., Depomed, Inc., Coating Place, Inc., Aradigm Corporation, Corium International, Inc., and Capsugel.
Frequently Asked Questions
How big is the controlled release drug delivery market?
The controlled release drug delivery market size was valued at USD 52.9 Billion in 2023.
What is the CAGR of the global controlled release drug delivery market from 2024 to 2032?
The CAGR of controlled release drug delivery is 10.5% during the analysis period of 2024 to 2032.
Which are the key players in the controlled release drug delivery market?
The key players operating in the global market are including Johnson and Johnson, Merck and Co., Inc., Alkermes plc, Orbis Biosciences, Inc., Pfizer, Inc., Depomed, Inc., Coating Place, Inc., Aradigm Corporation, Corium International, Inc., and Capsugel.
Which region dominated the global controlled release drug delivery market share?
North America held the dominating position in controlled release drug delivery industry during the analysis period of 2024 to 2032.
Which region registered fastest CAGR from 2024 to 2032?
Asia-Pacific region exhibited fastest growing CAGR for market of controlled release drug delivery during the analysis period of 2024 to 2032.
What are the current trends and dynamics in the global controlled release drug delivery industry?
The current trends and dynamics in the controlled release drug delivery industry include rising demand for personalized medicine and targeted therapies, increasing prevalence of chronic diseases requiring long-term medication, technological advancements in drug delivery systems, and growing preference for patient-friendly drug formulations.
Which technology held the maximum share in 2023?
The targeted delivery technology held the maximum share of the controlled release drug delivery industry.


