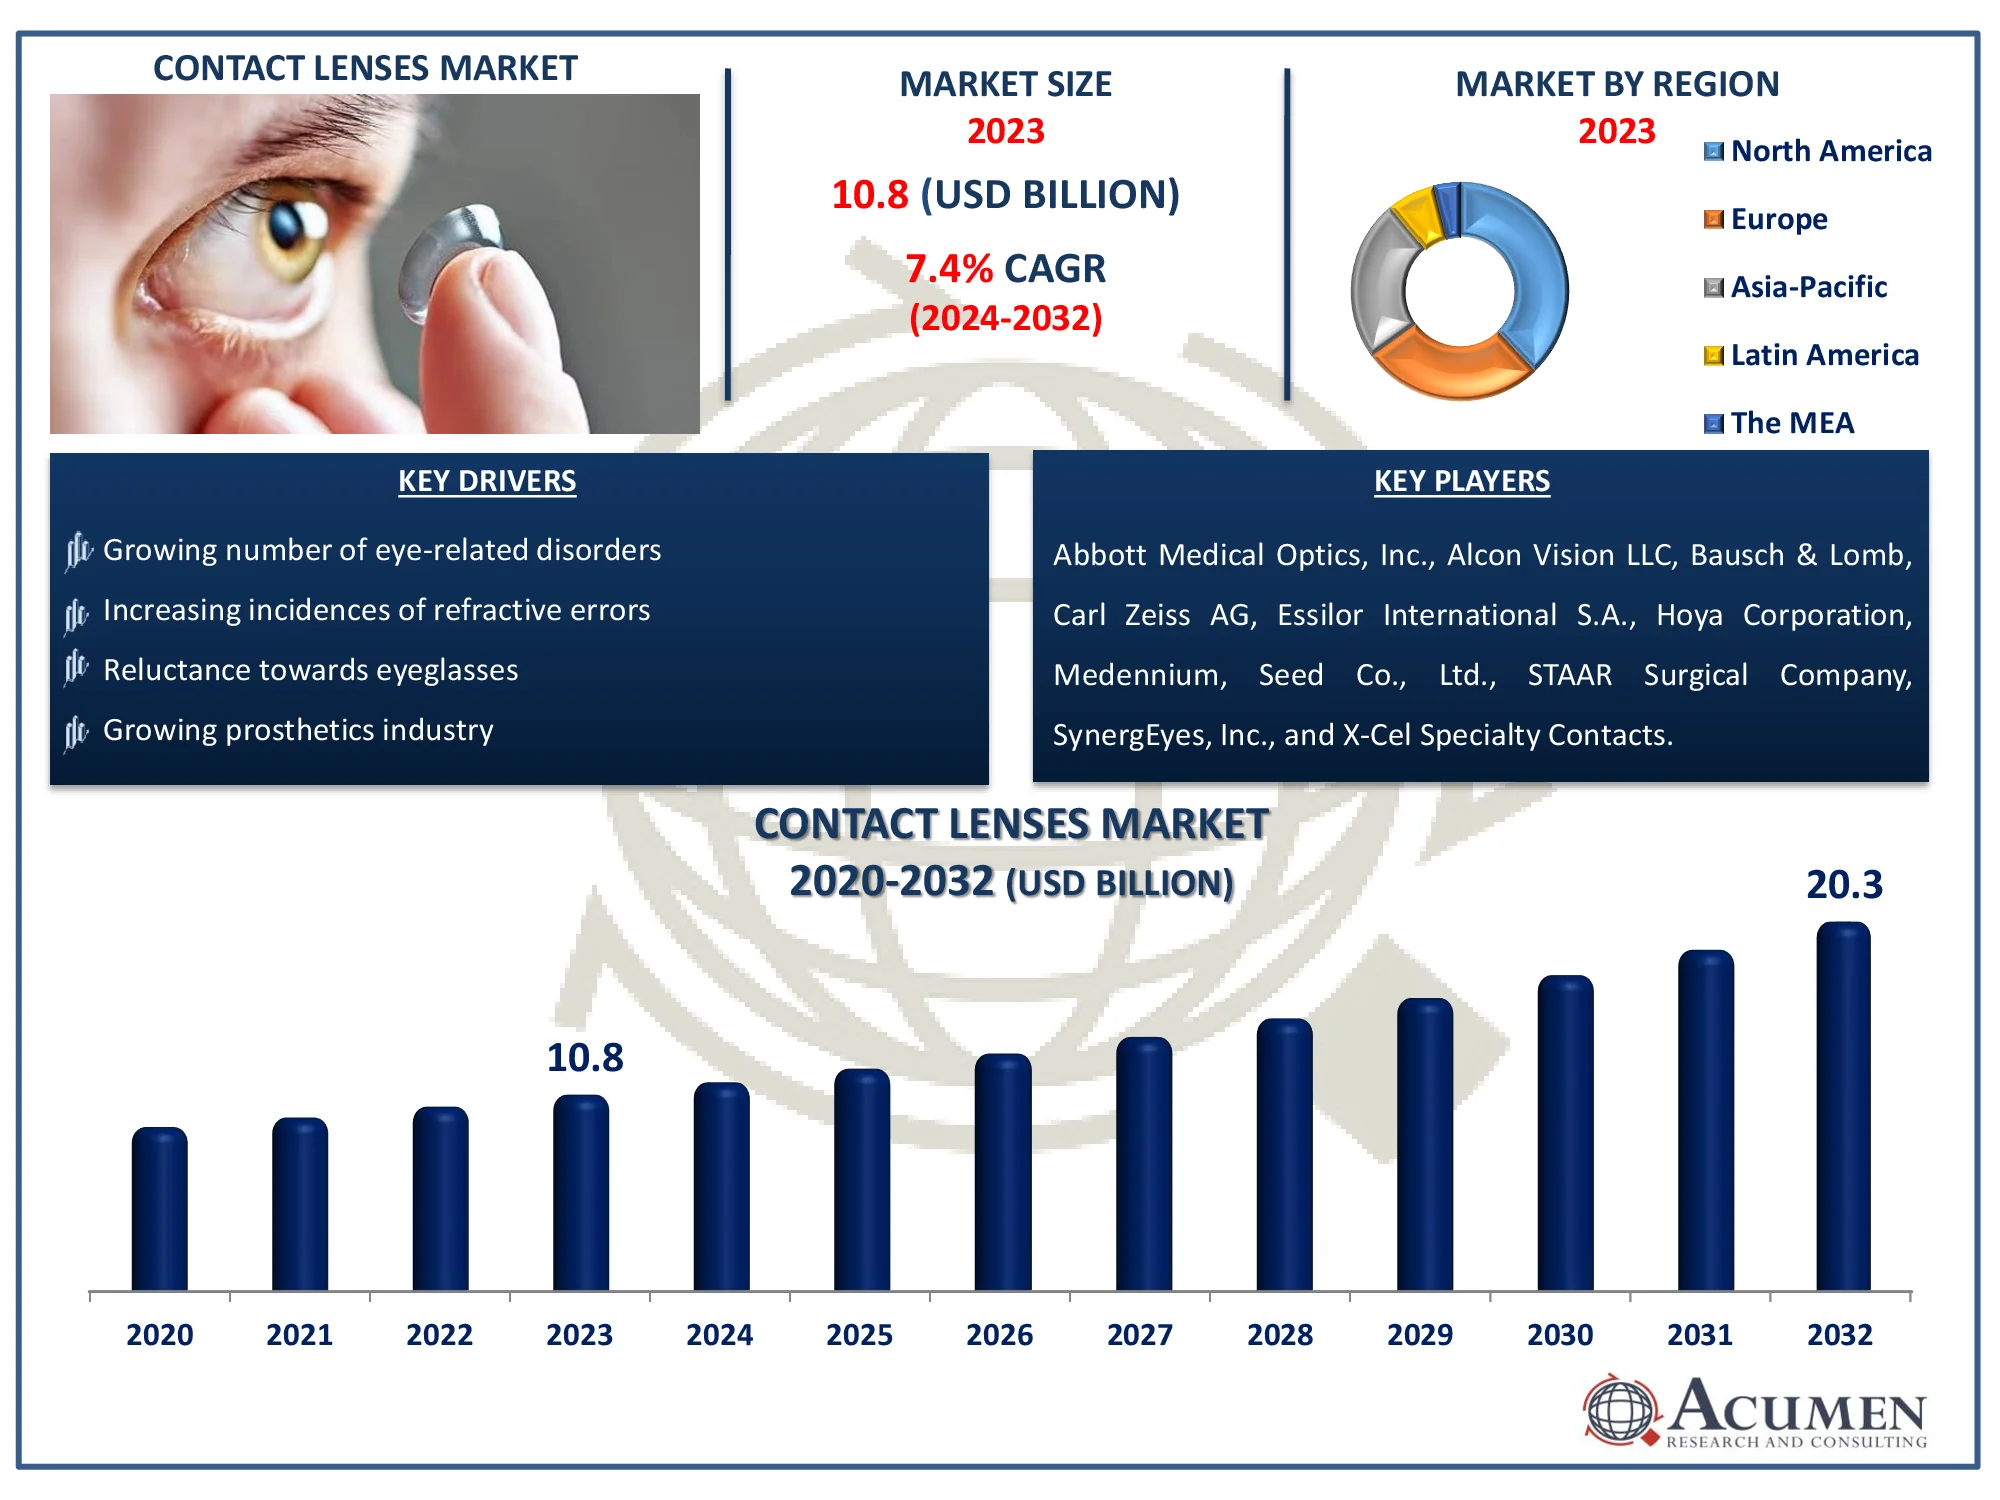
The Global Contact Lenses Market Size accounted for USD 9.6 Billion in 2021 and is estimated to achieve a market size of USD 17.4 Billion by 2030 growing at a CAGR of 6.9% from 2022 to 2030. The increasing number of ophthalmic disorders is the primary reason fueling the contact lenses market value in the coming years. Additionally, growing demand for outdoor activities is another factor that is driving the contact lens market share. Furthermore, introduction to technologically advanced lenses is a prominent contact lenses market trend that is strengthening the industry growth. Contact lenses or contacts are thin lenses designed to place directly on the surface of the eye. These can be worn by the people to correct vision or for therapeutic, or cosmetic, or as a prosthetic.
Contact Lenses Market Report Key Highlights
- Global contact lenses market revenue is poised to garner USD 17.4 Billion by 2030 with a CAGR of 6.9% from 2022 to 2030
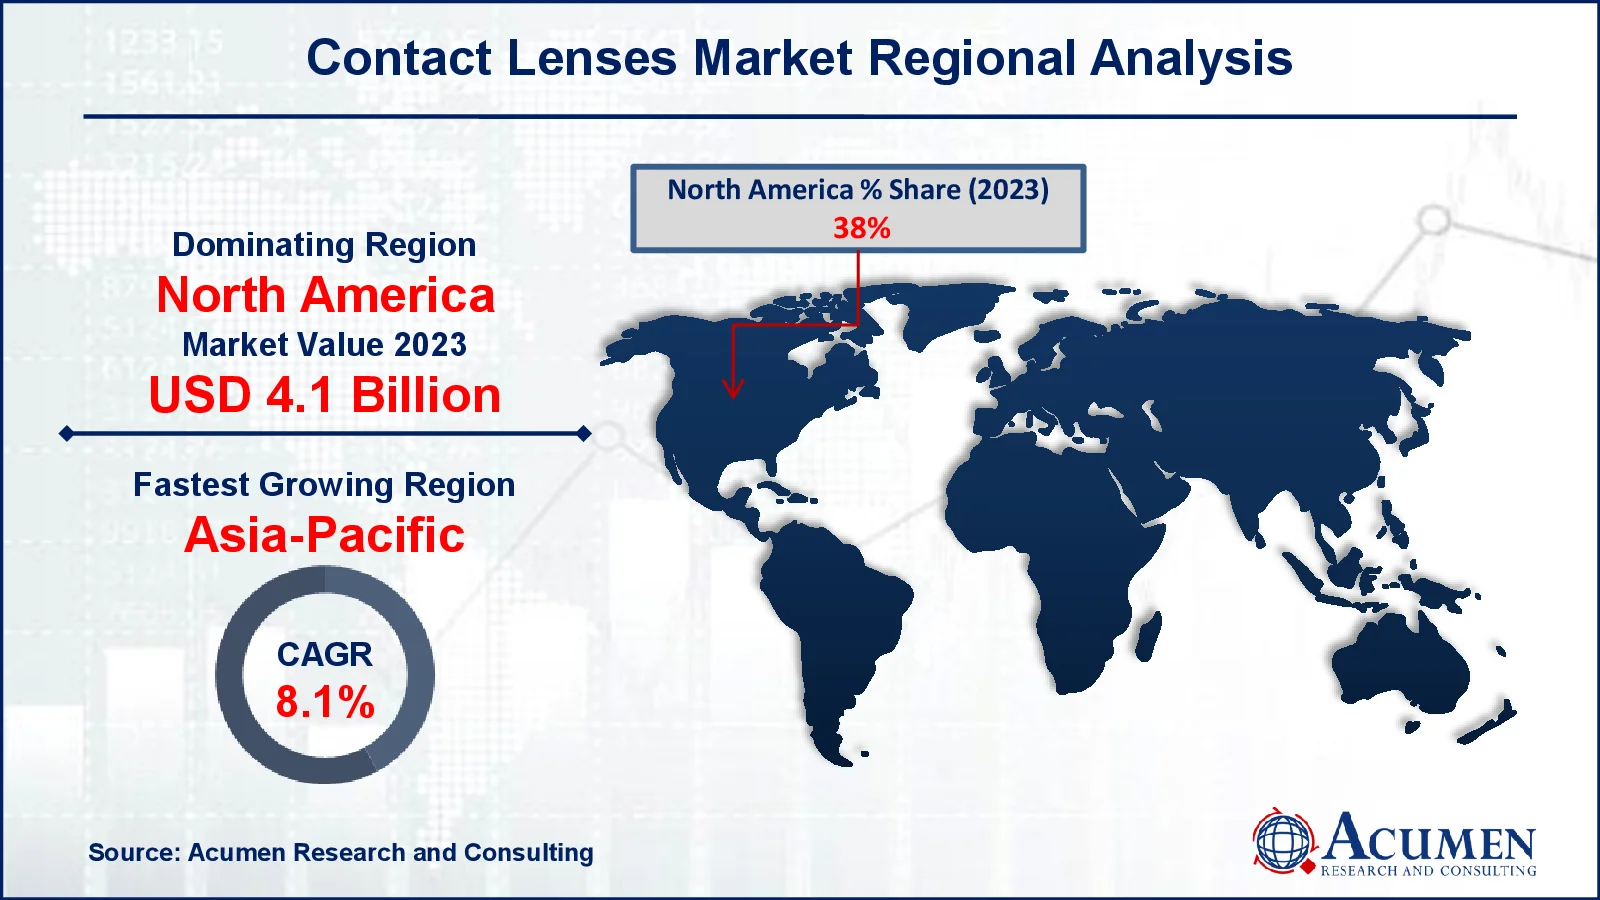
- North America is the leading region with over 38% shares in 2021
- According to the Center for Disease Control and Prevention (CDC), over 45 million Americans wear contact lenses
- Asia-Pacific is likely to attain a considerable CAGR from 2022 to 2030
- Based on design segment, retail store attained more than 35% of the total market share in 2021
- Prevalence of refractive errors boost the contact lenses market growth
Covid-19 Impact on the Contact Lenses Industry
The global pandemic of the corona virus has resulted in nationwide lockdowns that result in the shutdown of retail stores as well as disrupted the supply chain. The major market players have experienced a reduction in sales especially for daily/weekly wear contact lenses which have badly affected the growth of the market across the globe. Additionally, the pandemic has also badly affected the financials of people, as a fact people have delayed the purchase of new pairs of contact lenses for the period
Global Contact Lenses Market Dynamics
Market Drivers
- Growing number of eye-related disorders
- Increasing incidences of refractive errors
- Reluctance towards eyeglasses
- Growing prosthetics industry
Market Restraints
- Rising acceptance of refractive surgeries
- Shortage of ophthalmologists
Market Opportunities
- Rapid growth in myopia
- Increasing elderly population
Contact Lenses Market Report Coverage
Market |
Contact Lenses Market |
Contact Lenses Market Size 2021 |
USD 9.6 Billion |
Contact Lenses Market Forecast 2030 |
USD 17.4 Billion |
Contact Lenses Market CAGR During 2022 - 2030 |
6.9% |
Contact Lenses Market Analysis Period |
2018 - 2030 |
Contact Lenses Market Base Year |
2021 |
Contact Lenses Market Forecast Data |
2022 - 2030 |
Segments Covered |
By Wear Type, By Design, By Material, By Application, By Distribution Channel, And By Geography
|
Contact Lenses Market Regional Scope |
North America, Europe, Asia Pacific, Latin America, and Middle East & Africa |
Key Companies Profiled |
Abbott Medical Optics, Inc., Alcon Vision LLC, Bausch & Lomb, Carl Zeiss AG, Contamac, CooperVision, Inc., Essilor International S.A., Hoya Corporation, Johnson & Johnson Vision Care, Inc., Medennium, Seed Co., Ltd., STAAR Surgical Company, SynergEyes, Inc., and X-Cel Specialty Contacts, and others. |
Report Coverage
|
Market Trends, Drivers, Restraints, Competitive Analysis, Player Profiling, Regulation Analysis |
Contact Lenses Market Insights
The growing prevalence of myopia and other ophthalmic disorders is driving the market growth. The growing geriatric population whose vision gets easily blurred is expected to drive growth over the forecast period from 2022 to 2030. The increasing preference for contact lenses over prescription eyeglasses along with the high preference for cosmetic contact lenses is proliferating the market value. Furthermore, untapped emerging markets and the increasing number of players with advanced lenses like smart contact lenses are projected to create potential opportunities over the forecast period. On the other side, the shortage of ophthalmologists in some regions, growing acceptance of refractive surgeries, and problems associated with contact lenses are anticipated to limit the growth to an extent during the forecast period from 2022 to 2030.
Contact Lenses Market Segmentation
The worldwide contact lenses market is split based on wear type, design, material, application, distribution channel, and geography.
Contact Lenses Market By Wear Type
- Daily Disposable Lenses
- Disposable Lenses
- Frequent Replacement Lenses
- Conventional Lenses
According to our contact lenses industry analysis, the daily disposable lenses wear type gathered a significant amount of share in 2021 and is expected to do so in the coming years. The popularity of daily disposable lenses is growing since a new set of lenses gives the wearer with better comfort. Also, the segment is anticipated to attain a substantial growth rate during the projected timeframe from 2022 to 2030.
Contact Lenses Market By Design
- Spherical
- Toric
- Multifocal
- Others
Based on the design, the spherical sector will account for more than 60% of the overall contact lens market. However, the multifocal design is expected to develop at a moderate CAGR between 2022 and 2030. Furthermore, rising demand for toric lenses is expected to drive market growth in the near future. Toric lenses are used to treat astigmatism caused by variations in the curvature of the cornea.
Contact Lenses Market By Material
- Silicone Hydrogel
- Hydrogel
- Gas Permeable
- Hybrid
- Polymethyl Methacrylate (PMMA)
According to our contact lenses market forecast, the silicone hyrdrogel material dominated the overall market by recording the largest share of the market and will continue the same trend in the forecast period. On the other hand, the hybrid material will grow with the fastest growth rate in the coming years from 2022 to 2030. A hybrid lens combines gas permeable and silicone hydrogel materials. It is made up of an RGP centre zone and a soft peripheral skirt consisting of soft or silicone hydrogel material.
Contact Lenses Market By Application
- Corrective
- Therapeutic
- Cosmetic
- Prosthetic
- Lifestyle-oriented
In 2021, the corrective application generated the largest contact lens market revenue with over 43% share. Multifocal, bifocal, toric, and spherical are majorly recognized corrective lenses. However, cosmetic lens application is gaining traction in the market owing to the incresing need for an improved aesthetic appeal of eyes. Then again, therapeutic contact lenses gatheres a significant market share in 2021.
Contact Lenses Market By Distribution Channel
- Retail Stores
- Silicone Hydrogel & Hydrogel
- E-Commerce
By distribution channel, retail stores are leading the market with major revenue share owing to their easy and convenient availability for the end-users. The availability of a diverse range of branded products in retail stores is boosting its growth in the global market. Furthermore, the segment is followed by hospitals & clinics and E-commerce accounted for the least share in the market. Moreover, the E-commerce segment is anticipated to experience the fastest growth with a major CAGR (%) during the forecast timeframe due to the increasing number of online shoppers and rising competition. The growing competition in the e-commerce market results in price reduction for the end-user which is supporting its fastest growth in the estimated period.
Contact Lenses Market Regional Outlook
North America
Europe
- U.K.
- Germany
- France
- Spain
- Rest of Europe
Latin America
- Mexico
- Brazil
- Rest of Latin America
Asia-Pacific
- India
- Japan
- China
- Australia
- South Korea
- Rest of Asia-Pacific
The Middle East & Africa (MEA)
- Gulf Cooperation Council (GCC)
- South Africa
- Rest of the Middle East & Africa
Asia Pacific is estimated to experience fastest growth during the forecast period
The major economies of the region Japan, China, and India are the major contributors to the fastest growth over the forecast period. The increasing discretionary income, spending power of people, rising number of optical clinics and professions are supporting the regional market growth. The increasing number of contact lens manufacturers in the region is another major factor bolstering the regional market value. Additionally, the changing lifestyle is accelerating the people with ophthalmic disorders that destroy sharp and central vision is additionally bolstering the market growth.
Contact Lenses Market Players
Some of the top contact lenses companies offered in the professional report include Abbott Medical Optics, Inc., Alcon Vision LLC, Bausch & Lomb, Carl Zeiss AG, Contamac, CooperVision, Inc., Essilor International S.A., Hoya Corporation, Johnson & Johnson Vision Care, Inc., Medennium, Seed Co., Ltd., STAAR Surgical Company, SynergEyes, Inc., and X-Cel Specialty Contacts.
CHAPTER 1. Industry Overview of Contact Lenses Market
1.1. Definition and Scope
1.1.1. Definition of Contact Lenses
1.1.2. Market Segmentation
1.1.3. Years Considered for the Study
1.1.4. Assumptions and Acronyms Used
1.1.4.1. Market Assumptions and Market Forecast
1.1.4.2. Acronyms Used in Global Contact Lenses Market
1.2. Summary
1.2.1. Executive Summary
1.2.2. Contact Lenses Market By Wear Type
1.2.3. Contact Lenses Market By Design
1.2.4. Contact Lenses Market By Material
1.2.5. Contact Lenses Market By Application
1.2.6. Contact Lenses Market By Distribution Channel
1.2.7. Contact Lenses Market By Region
CHAPTER 2. Research Approach
2.1. Methodology
2.1.1. Research Programs
2.1.2. Market Size Estimation
2.1.3. Market Breakdown and Data Triangulation
2.2. Data Source
2.2.1. Secondary Sources
2.2.2. Primary Sources
CHAPTER 3. Market Dynamics And Competition Analysis
3.1. Market Drivers
3.1.1. Driver 1
3.1.2. Driver 2
3.2. Restraints and Challenges
3.2.1. Restraint 1
3.2.2. Restraint 2
3.3. Growth Opportunities
3.3.1. Opportunity 1
3.3.2. Opportunity 2
3.4. Porter’s Five Forces Analysis
3.4.1. Bargaining Power of Suppliers
3.4.2. Bargaining Power of Buyers
3.4.3. Threat of Substitute
3.4.4. Threat of New Entrants
3.4.5. Degree of Competition
3.5. Market Concentration Ratio and Market Maturity Analysis of Contact Lenses Market
3.5.1. Go To Market Strategy
3.5.1.1. Introduction
3.5.1.2. Growth
3.5.1.3. Maturity
3.5.1.4. Saturation
3.5.1.5. Possible Development
3.6. Technological Roadmap for Contact Lenses Market
3.7. Value Chain Analysis
3.7.1. List of Key Manufacturers
3.7.2. List of Customers
3.7.3. Level of Integration
3.8. Regulatory Compliance
3.9. Competitive Landscape, 2021
3.9.1. Player Positioning Analysis
3.9.2. Key Strategies Adopted By Leading Players
CHAPTER 4. Contact Lenses Market By Wear Type
4.1. Introduction
4.2. Contact Lenses Revenue By Wear Type
4.2.1. Contact Lenses Revenue (USD Billion) and Forecast, By Wear Type, 2018-2030
4.2.2. Daily Disposable Lenses
4.2.2.1. Daily Disposable Lenses Market Revenue (USD Billion) and Growth Rate (%), 2018-2030
4.2.3. Disposable Lenses
4.2.3.1. Disposable Lenses Market Revenue (USD Billion) and Growth Rate (%), 2018-2030
4.2.4. Frequent Replacement Lenses
4.2.4.1. Frequent Replacement Lenses Market Revenue (USD Billion) and Growth Rate (%), 2018-2030
4.2.5. Conventional Lenses
4.2.5.1. Conventional Lenses Market Revenue (USD Billion) and Growth Rate (%), 2018-2030
CHAPTER 5. Contact Lenses Market By Design
5.1. Introduction
5.2. Contact Lenses Revenue By Design
5.2.1. Contact Lenses Revenue (USD Billion) and Forecast, By Design, 2018-2030
5.2.2. Toric
5.2.2.1. Toric Market Revenue (USD Billion) and Growth Rate (%), 2018-2030
5.2.3. Multifocal
5.2.3.1. Multifocal Market Revenue (USD Billion) and Growth Rate (%), 2018-2030
5.2.4. Spherical
5.2.4.1. Spherical Market Revenue (USD Billion) and Growth Rate (%), 2018-2030
5.2.5. Others
5.2.5.1. Others Market Revenue (USD Billion) and Growth Rate (%), 2018-2030
CHAPTER 6. Contact Lenses Market By Material
6.1. Introduction
6.2. Contact Lenses Revenue By Material
6.2.1. Contact Lenses Revenue (USD Billion) and Forecast, By Material, 2018-2030
6.2.2. Silicone Hydrogel
6.2.2.1. Silicone Hydrogel Market Revenue (USD Billion) and Growth Rate (%), 2018-2030
6.2.3. Hydrogel
6.2.3.1. Hydrogel Market Revenue (USD Billion) and Growth Rate (%), 2018-2030
6.2.4. Gas Permeable
6.2.4.1. Gas Permeable Market Revenue (USD Billion) and Growth Rate (%), 2018-2030
6.2.5. Hybrid
6.2.5.1. Hybrid Market Revenue (USD Billion) and Growth Rate (%), 2018-2030
6.2.6. Polymethyl Methacrylate (PMMA)
6.2.6.1. Polymethyl Methacrylate (PMMA) Market Revenue (USD Billion) and Growth Rate (%), 2018-2030
CHAPTER 7. Contact Lenses Market By Application
7.1. Introduction
7.2. Contact Lenses Revenue By Application
7.2.1. Contact Lenses Revenue (USD Billion) and Forecast, By Application, 2018-2030
7.2.2. Corrective
7.2.2.1. Corrective Market Revenue (USD Billion) and Growth Rate (%), 2018-2030
7.2.3. Therapeutic
7.2.3.1. Therapeutic Market Revenue (USD Billion) and Growth Rate (%), 2018-2030
7.2.4. Cosmetic
7.2.4.1. Cosmetic Market Revenue (USD Billion) and Growth Rate (%), 2018-2030
7.2.5. Prosthetic
7.2.5.1. Prosthetic Market Revenue (USD Billion) and Growth Rate (%), 2018-2030
7.2.6. Lifestyle-oriented
7.2.6.1. Lifestyle-oriented Market Revenue (USD Billion) and Growth Rate (%), 2018-2030
CHAPTER 8. Contact Lenses Market By Distribution Channel
8.1. Introduction
8.2. Contact Lenses Revenue By Distribution Channel
8.2.1. Contact Lenses Revenue (USD Billion) and Forecast, By Distribution Channel, 2018-2030
8.2.2. Retail stores
8.2.2.1. Retail stores Market Revenue (USD Billion) and Growth Rate (%), 2018-2030
8.2.3. Hospitals & clinics
8.2.3.1. Hospitals & clinics Market Revenue (USD Billion) and Growth Rate (%), 2018-2030
8.2.4. E-commerce
8.2.4.1. E-commerce Market Revenue (USD Billion) and Growth Rate (%), 2018-2030
CHAPTER 9. North America Contact Lenses Market By Country
9.1. North America Contact Lenses Market Overview
9.2. U.S.
9.2.1. U.S. Contact Lenses Revenue (USD Billion) and Forecast By Wear Type, 2018-2030
9.2.2. U.S. Contact Lenses Revenue (USD Billion) and Forecast By Design, 2018-2030
9.2.3. U.S. Contact Lenses Revenue (USD Billion) and Forecast By Material, 2018-2030
9.2.4. U.S. Contact Lenses Revenue (USD Billion) and Forecast By Application, 2018-2030
9.2.5. U.S. Contact Lenses Revenue (USD Billion) and Forecast By Distribution Channel, 2018-2030
9.3. Canada
9.3.1. Canada Contact Lenses Revenue (USD Billion) and Forecast By Wear Type, 2018-2030
9.3.2. Canada Contact Lenses Revenue (USD Billion) and Forecast By Design, 2018-2030
9.3.3. Canada Contact Lenses Revenue (USD Billion) and Forecast By Material, 2018-2030
9.3.4. Canada Contact Lenses Revenue (USD Billion) and Forecast By Application, 2018-2030
9.3.5. Canada Contact Lenses Revenue (USD Billion) and Forecast By Distribution Channel, 2018-2030
9.4. North America PEST Analysis
CHAPTER 10. Europe Contact Lenses Market By Country
10.1. Europe Contact Lenses Market Overview
10.2. U.K.
10.2.1. U.K. Contact Lenses Revenue (USD Billion) and Forecast By Wear Type, 2018-2030
10.2.2. U.K. Contact Lenses Revenue (USD Billion) and Forecast By Design, 2018-2030
10.2.3. U.K. Contact Lenses Revenue (USD Billion) and Forecast By Material, 2018-2030
10.2.4. U.K. Contact Lenses Revenue (USD Billion) and Forecast By Application, 2018-2030
10.2.5. U.K. Contact Lenses Revenue (USD Billion) and Forecast By Distribution Channel, 2018-2030
10.3. Germany
10.3.1. Germany Contact Lenses Revenue (USD Billion) and Forecast By Wear Type, 2018-2030
10.3.2. Germany Contact Lenses Revenue (USD Billion) and Forecast By Design, 2018-2030
10.3.3. Germany Contact Lenses Revenue (USD Billion) and Forecast By Material, 2018-2030
10.3.4. Germany Contact Lenses Revenue (USD Billion) and Forecast By Application, 2018-2030
10.3.5. Germany Contact Lenses Revenue (USD Billion) and Forecast By Distribution Channel, 2018-2030
10.4. France
10.4.1. France Contact Lenses Revenue (USD Billion) and Forecast By Wear Type, 2018-2030
10.4.2. France Contact Lenses Revenue (USD Billion) and Forecast By Design, 2018-2030
10.4.3. France Contact Lenses Revenue (USD Billion) and Forecast By Material, 2018-2030
10.4.4. France Contact Lenses Revenue (USD Billion) and Forecast By Application, 2018-2030
10.4.5. France Contact Lenses Revenue (USD Billion) and Forecast By Distribution Channel, 2018-2030
10.5. Spain
10.5.1. Spain Contact Lenses Revenue (USD Billion) and Forecast By Wear Type, 2018-2030
10.5.2. Spain Contact Lenses Revenue (USD Billion) and Forecast By Design, 2018-2030
10.5.3. Spain Contact Lenses Revenue (USD Billion) and Forecast By Material, 2018-2030
10.5.4. Spain Contact Lenses Revenue (USD Billion) and Forecast By Application, 2018-2030
10.5.5. Spain Contact Lenses Revenue (USD Billion) and Forecast By Distribution Channel, 2018-2030
10.6. Rest of Europe
10.6.1. Rest of Europe Contact Lenses Revenue (USD Billion) and Forecast By Wear Type, 2018-2030
10.6.2. Rest of Europe Contact Lenses Revenue (USD Billion) and Forecast By Design, 2018-2030
10.6.3. Rest of Europe Contact Lenses Revenue (USD Billion) and Forecast By Material, 2018-2030
10.6.4. Rest of Europe Contact Lenses Revenue (USD Billion) and Forecast By Application, 2018-2030
10.6.5. Rest of Europe Contact Lenses Revenue (USD Billion) and Forecast By Distribution Channel, 2018-2030
10.7. Europe PEST Analysis
CHAPTER 11. Asia Pacific Contact Lenses Market By Country
11.1. Asia Pacific Contact Lenses Market Overview
11.2. China
11.2.1. China Contact Lenses Revenue (USD Billion) and Forecast By Wear Type, 2018-2030
11.2.2. China Contact Lenses Revenue (USD Billion) and Forecast By Design, 2018-2030
11.2.3. China Contact Lenses Revenue (USD Billion) and Forecast By Material, 2018-2030
11.2.4. China Contact Lenses Revenue (USD Billion) and Forecast By Application, 2018-2030
11.2.5. China Contact Lenses Revenue (USD Billion) and Forecast By Distribution Channel, 2018-2030
11.3. Japan
11.3.1. Japan Contact Lenses Revenue (USD Billion) and Forecast By Wear Type, 2018-2030
11.3.2. Japan Contact Lenses Revenue (USD Billion) and Forecast By Design, 2018-2030
11.3.3. Japan Contact Lenses Revenue (USD Billion) and Forecast By Material, 2018-2030
11.3.4. Japan Contact Lenses Revenue (USD Billion) and Forecast By Application, 2018-2030
11.3.5. Japan Contact Lenses Revenue (USD Billion) and Forecast By Distribution Channel, 2018-2030
11.4. India
11.4.1. India Contact Lenses Revenue (USD Billion) and Forecast By Wear Type, 2018-2030
11.4.2. India Contact Lenses Revenue (USD Billion) and Forecast By Design, 2018-2030
11.4.3. India Contact Lenses Revenue (USD Billion) and Forecast By Material, 2018-2030
11.4.4. India Contact Lenses Revenue (USD Billion) and Forecast By Application, 2018-2030
11.4.5. India Contact Lenses Revenue (USD Billion) and Forecast By Distribution Channel, 2018-2030
11.5. Australia
11.5.1. Australia Contact Lenses Revenue (USD Billion) and Forecast By Wear Type, 2018-2030
11.5.2. Australia Contact Lenses Revenue (USD Billion) and Forecast By Design, 2018-2030
11.5.3. Australia Contact Lenses Revenue (USD Billion) and Forecast By Material, 2018-2030
11.5.4. Australia Contact Lenses Revenue (USD Billion) and Forecast By Application, 2018-2030
11.5.5. Australia Contact Lenses Revenue (USD Billion) and Forecast By Distribution Channel, 2018-2030
11.6. South Korea
11.6.1. South Korea Contact Lenses Revenue (USD Billion) and Forecast By Wear Type, 2018-2030
11.6.2. South Korea Contact Lenses Revenue (USD Billion) and Forecast By Design, 2018-2030
11.6.3. South Korea Contact Lenses Revenue (USD Billion) and Forecast By Material, 2018-2030
11.6.4. South Korea Contact Lenses Revenue (USD Billion) and Forecast By Application, 2018-2030
11.6.5. South Korea Contact Lenses Revenue (USD Billion) and Forecast By Distribution Channel, 2018-2030
11.7. Rest of Asia-Pacific
11.7.1. Rest of Asia-Pacific Contact Lenses Revenue (USD Billion) and Forecast By Wear Type, 2018-2030
11.7.2. Rest of Asia-Pacific Contact Lenses Revenue (USD Billion) and Forecast By Design, 2018-2030
11.7.3. Rest of Asia-Pacific Contact Lenses Revenue (USD Billion) and Forecast By Material, 2018-2030
11.7.4. Rest of Asia-Pacific Contact Lenses Revenue (USD Billion) and Forecast By Application, 2018-2030
11.7.5. Rest of Asia-Pacific Contact Lenses Revenue (USD Billion) and Forecast By Distribution Channel, 2018-2030
11.8. Asia Pacific PEST Analysis
CHAPTER 12. Latin America Contact Lenses Market By Country
12.1. Latin America Contact Lenses Market Overview
12.2. Brazil
12.2.1. Brazil Contact Lenses Revenue (USD Billion) and Forecast By Wear Type, 2018-2030
12.2.2. Brazil Contact Lenses Revenue (USD Billion) and Forecast By Design, 2018-2030
12.2.3. Brazil Contact Lenses Revenue (USD Billion) and Forecast By Material, 2018-2030
12.2.4. Brazil Contact Lenses Revenue (USD Billion) and Forecast By Application, 2018-2030
12.2.5. Brazil Contact Lenses Revenue (USD Billion) and Forecast By Distribution Channel, 2018-2030
12.3. Mexico
12.3.1. Mexico Contact Lenses Revenue (USD Billion) and Forecast By Wear Type, 2018-2030
12.3.2. Mexico Contact Lenses Revenue (USD Billion) and Forecast By Design, 2018-2030
12.3.3. Mexico Contact Lenses Revenue (USD Billion) and Forecast By Material, 2018-2030
12.3.4. Mexico Contact Lenses Revenue (USD Billion) and Forecast By Application, 2018-2030
12.3.5. Mexico Contact Lenses Revenue (USD Billion) and Forecast By Distribution Channel, 2018-2030
12.4. Rest of Latin America
12.4.1. Rest of Latin America Contact Lenses Revenue (USD Billion) and Forecast By Wear Type, 2018-2030
12.4.2. Rest of Latin America Contact Lenses Revenue (USD Billion) and Forecast By Design, 2018-2030
12.4.3. Rest of Latin America Contact Lenses Revenue (USD Billion) and Forecast By Material, 2018-2030
12.4.4. Rest of Latin America Contact Lenses Revenue (USD Billion) and Forecast By Application, 2018-2030
12.4.5. Rest of Latin America Contact Lenses Revenue (USD Billion) and Forecast By Distribution Channel, 2018-2030
12.5. Latin America PEST Analysis
CHAPTER 13. Middle East & Africa Contact Lenses Market By Country
13.1. Middle East & Africa Contact Lenses Market Overview
13.2. GCC
13.2.1. GCC Contact Lenses Revenue (USD Billion) and Forecast By Wear Type, 2018-2030
13.2.2. GCC Contact Lenses Revenue (USD Billion) and Forecast By Design, 2018-2030
13.2.3. GCC Contact Lenses Revenue (USD Billion) and Forecast By Material, 2018-2030
13.2.4. GCC Contact Lenses Revenue (USD Billion) and Forecast By Application, 2018-2030
13.2.5. GCC Contact Lenses Revenue (USD Billion) and Forecast By Distribution Channel, 2018-2030
13.3. South Africa
13.3.1. South Africa Contact Lenses Revenue (USD Billion) and Forecast By Wear Type, 2018-2030
13.3.2. South Africa Contact Lenses Revenue (USD Billion) and Forecast By Design, 2018-2030
13.3.3. South Africa Contact Lenses Revenue (USD Billion) and Forecast By Material, 2018-2030
13.3.4. South Africa Contact Lenses Revenue (USD Billion) and Forecast By Application, 2018-2030
13.3.5. South Africa Contact Lenses Revenue (USD Billion) and Forecast By Distribution Channel, 2018-2030
13.4. Rest of Middle East & Africa
13.4.1. Rest of Middle East & Africa Contact Lenses Revenue (USD Billion) and Forecast By Wear Type, 2018-2030
13.4.2. Rest of Middle East & Africa Contact Lenses Revenue (USD Billion) and Forecast By Design, 2018-2030
13.4.3. Rest of Middle East & Africa Contact Lenses Revenue (USD Billion) and Forecast By Material, 2018-2030
13.4.4. Rest of Middle East & Africa Contact Lenses Revenue (USD Billion) and Forecast By Application, 2018-2030
13.4.5. Rest of Middle East & Africa Contact Lenses Revenue (USD Billion) and Forecast By Distribution Channel, 2018-2030
13.5. Middle East & Africa PEST Analysis
CHAPTER 14. Player Analysis Of Contact Lenses Market
14.1. Contact Lenses Market Company Share Analysis
14.2. Competition Matrix
14.2.1. Competitive Benchmarking of key players by price, presence, market share, and R&D investment
14.2.2. New Product Launches and Product Enhancements
14.2.3. Mergers And Acquisition In Global Contact Lenses Market
14.2.4. Partnership, Joint Ventures and Strategic Alliances/ Sales Agreements
CHAPTER 15. Company Profile
15.1. Abbott Medical Optics, Inc.
15.1.1. Company Snapshot
15.1.2. Business Overview
15.1.3. Financial Overview
15.1.3.1. Revenue (USD Billion), 2021
15.1.3.2. Abbott Medical Optics, Inc. 2021 Contact Lenses Business Regional Distribution
15.1.4. Product /Service and Specification
15.1.5. Recent Developments & Business Strategy
15.2. Alcon Vision LLC
15.3. Bausch & Lomb
15.4. Carl Zeiss AG
15.5. Contamac
15.6. CooperVision, Inc.
15.7. Essilor International S.A.
15.8. Hoya Corporation
15.9. Johnson & Johnson Vision Care, Inc.
15.10. Medennium
15.11. Seed Co., Ltd.
15.12. STAAR Surgical Company
15.13. SynergEyes, Inc.
15.14. X-Cel Specialty Contacts