Companion Diagnostics Market Size - Global Industry, Share, Analysis, Trends and Forecast 2023 - 2032
Published :
Report ID:
Pages :
Format :
Companion Diagnostics Market Size - Global Industry, Share, Analysis, Trends and Forecast 2023 - 2032
Report Coverage
- Industry Dynamics
- Market Size and Forecast Data
- Segment Analysis
- Competitive Landscape
- Regional Analysis with a Niche Focus on Country-Level Data
- High Level Analysis - Porter's, PESTEL, Value Chain, etc.
- Company Profiles of Key Players
- Option to Customize the Report As Per Your Specific Need
Request Sample Report
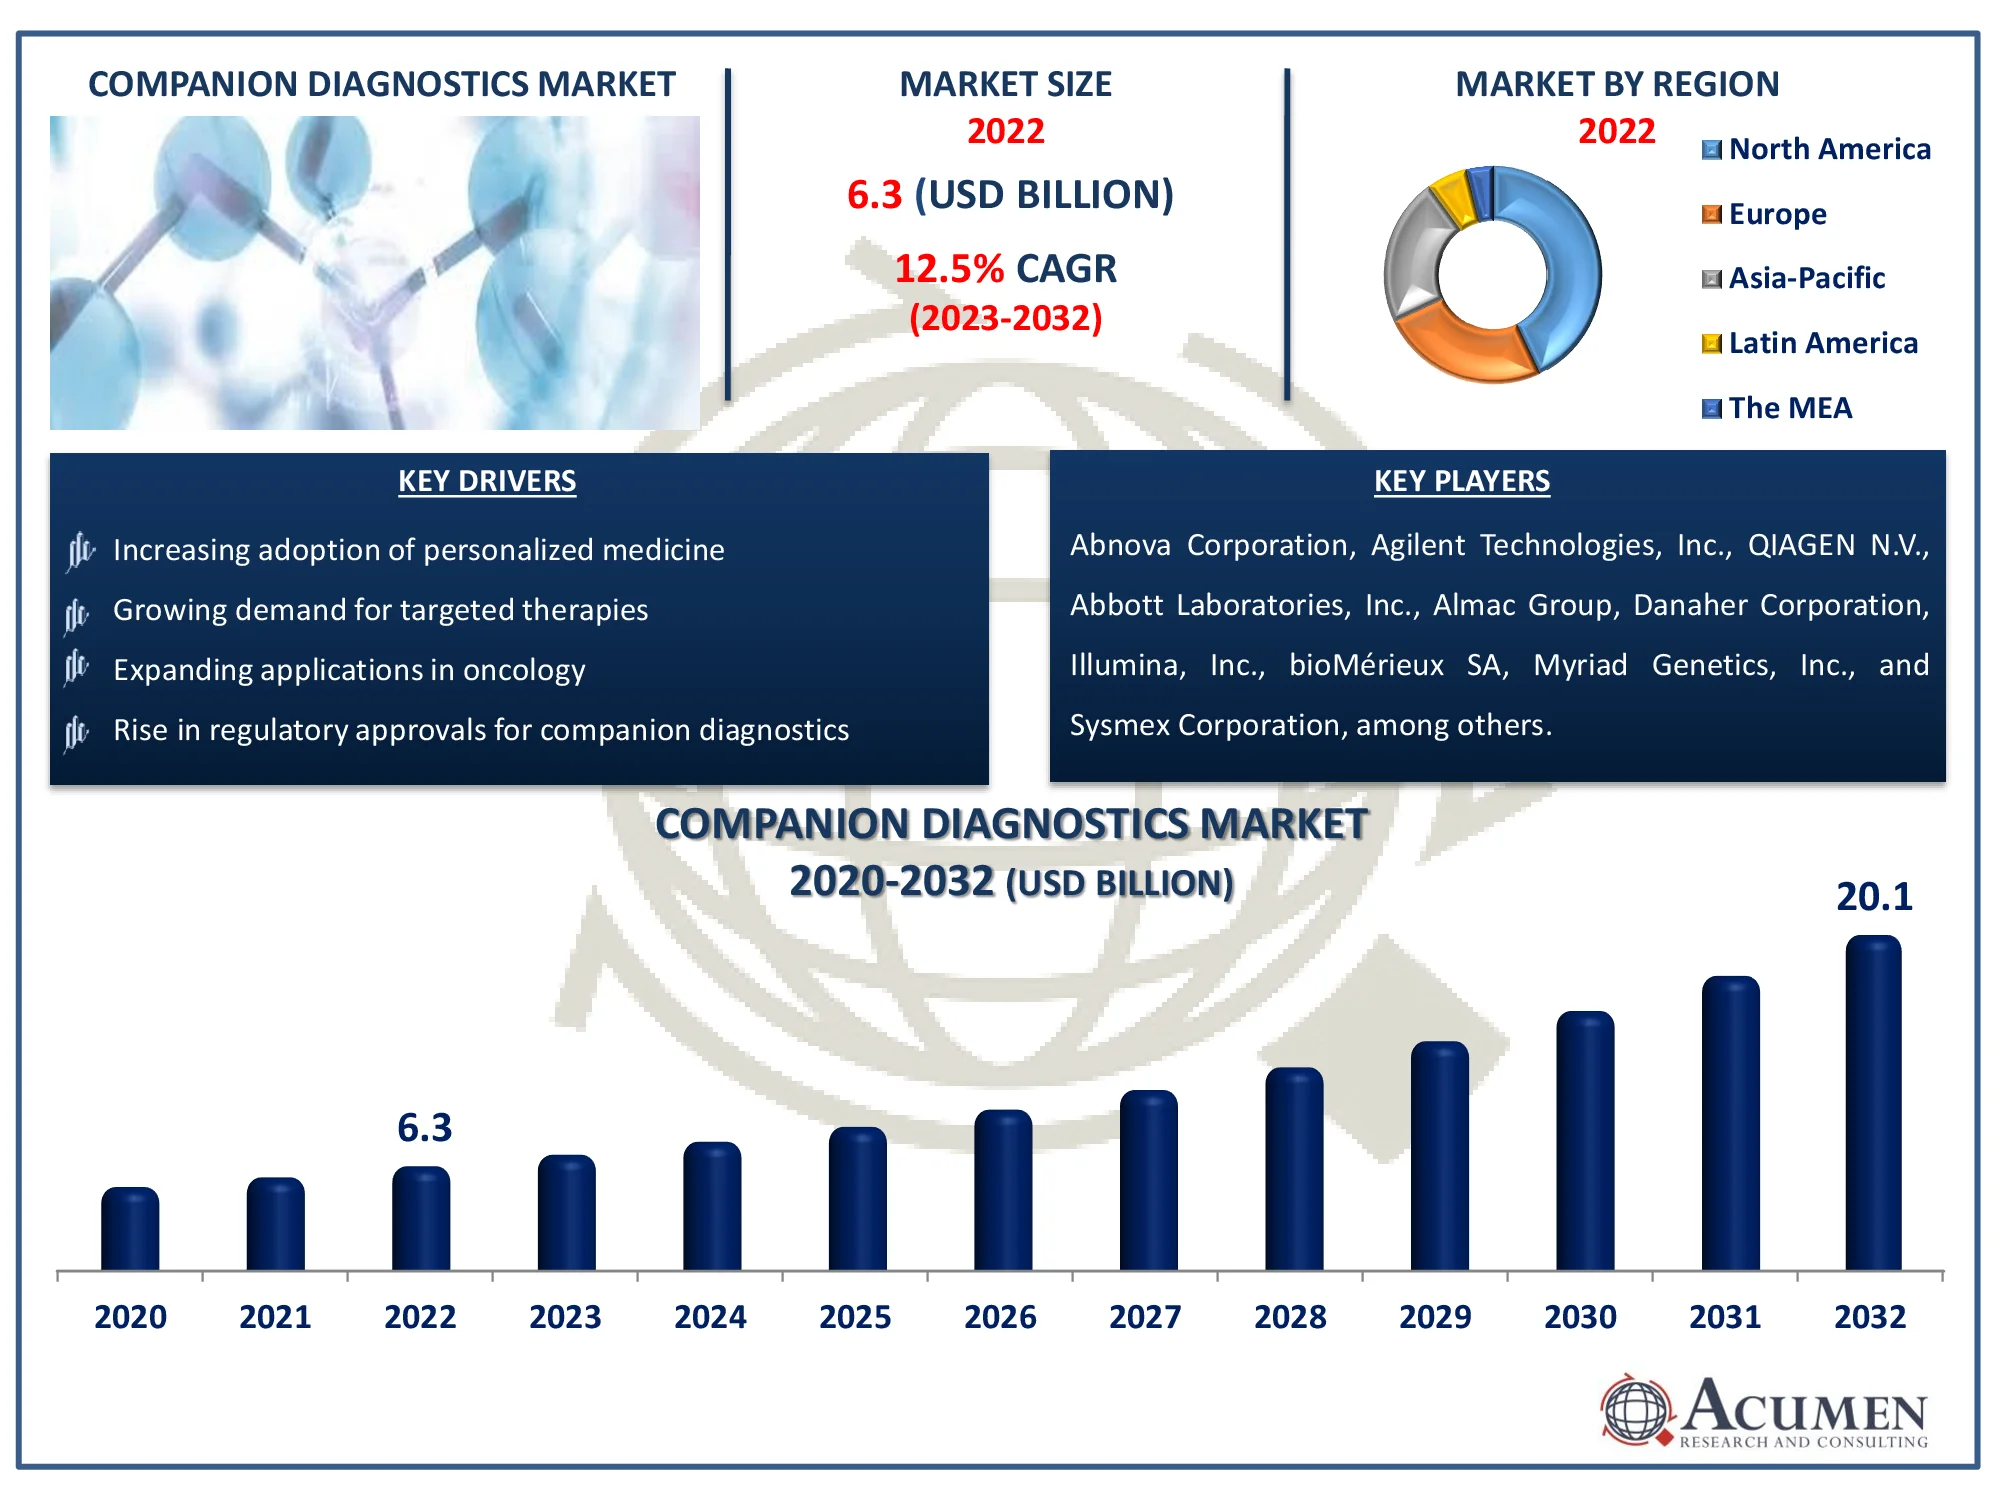
The Global Companion Diagnostics Market Size accounted for USD 6.3 Billion in 2022 and is estimated to achieve a market size of USD 20.1 Billion by 2032 growing at a CAGR of 12.5% from 2023 to 2032.
Companion Diagnostics Market Highlights
- Global companion diagnostics market revenue is poised to garner USD 20.1 billion by 2032 with a CAGR of 12.5% from 2023 to 2032
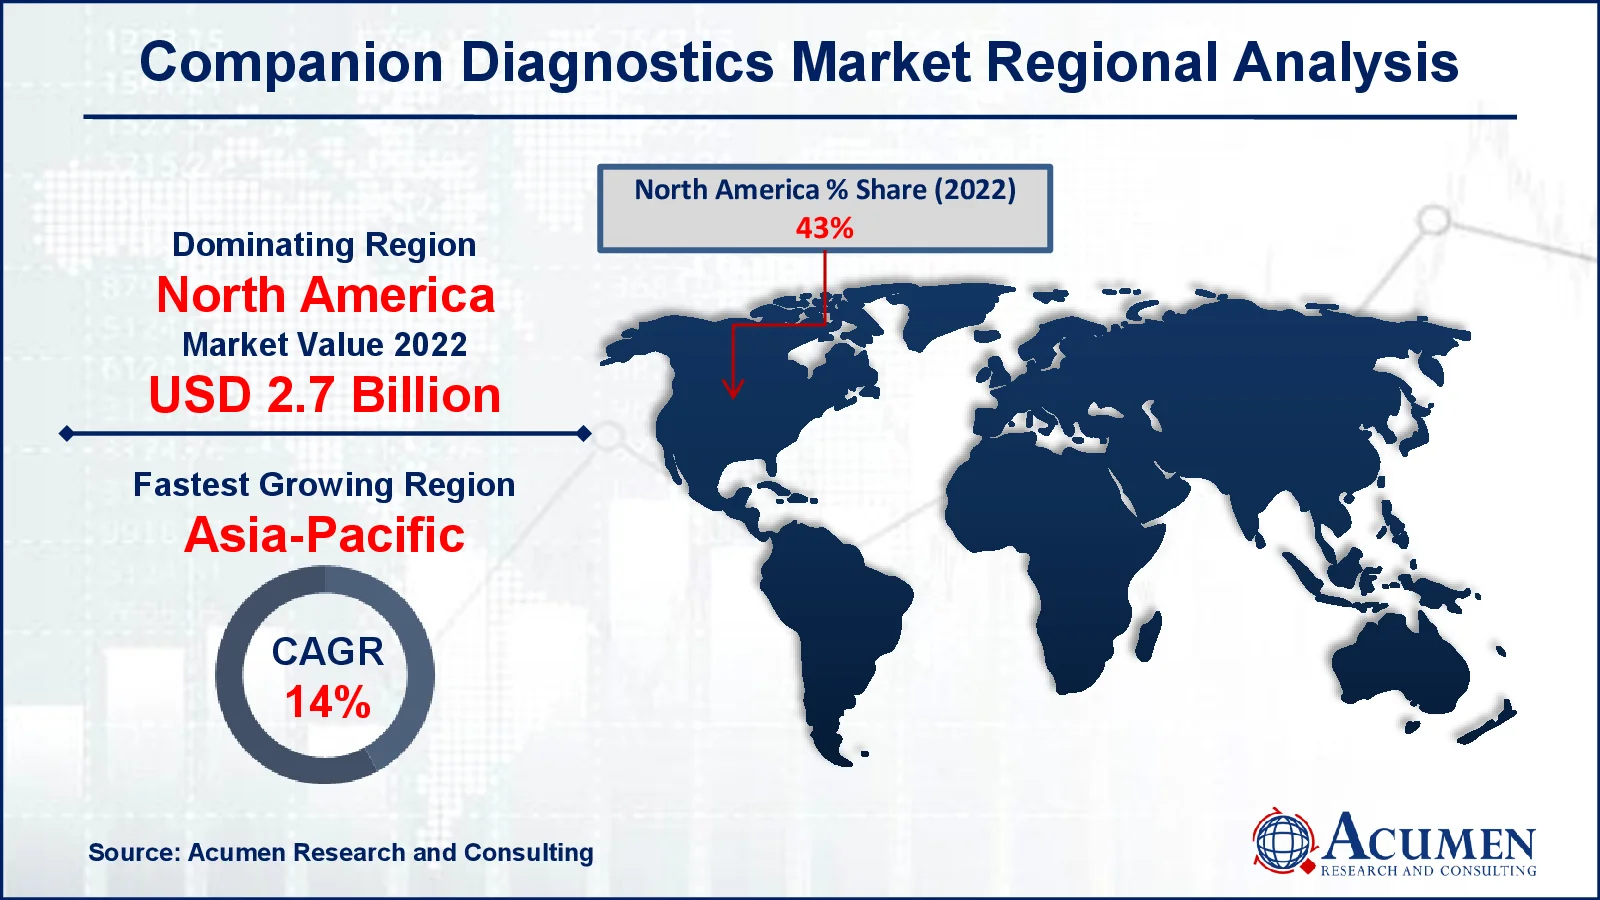
- North America companion diagnostics market value occupied around USD 2.7 billion in 2022
- Asia-Pacific companion diagnostics market growth will record a CAGR of more than 14% from 2023 to 2032
- Among end-user, the pharmaceutical & biopharmaceutical companies sub-segment generated more than USD 2.5 billion revenue in 2022
- Based on product & service, the assays, kits & reagents sub-segment generated around 60% market share in 2022
- Rising focus on precision medicine initiatives is a popular companion diagnostics market trend that fuels the industry demand

A companion diagnostic is a sophisticated diagnostic instrument that combines test kits, reagents, software, and services to provide critical insights into the optimal use and safety profile of a pharmacological or biological product. Its principal role, which is frequently used in conjunction with therapeutic medications, is to determine whether the benefits of a certain therapeutic product outweigh any possible dangers or side effects for patients. Furthermore, these diagnostics play an important role in identifying patients who are most likely to benefit from a given therapeutic product, guaranteeing personalized treatment strategies. Additional, they offer continuous monitoring of patient reactions to therapy, allowing for modifications as needed to improve the therapeutic regimen's safety and efficacy. Companion diagnostics provide a substantial contribution to precision medicine projects by providing individualized treatment options that maximize patient outcomes while minimizing hazards.
Global Companion Diagnostics Market Dynamics
Market Drivers
- Increasing adoption of personalized medicine
- Growing demand for targeted therapies
- Expanding applications in oncology
- Rise in regulatory approvals for companion diagnostics
Market Restraints
- High development costs
- Regulatory challenges and approval delays
- Limited reimbursement coverage
Market Opportunities
- Advancements in genomic technologies
- Expansion into emerging markets
- Collaborations between pharmaceutical and diagnostic companies
Companion Diagnostics Market Report Coverage
|
Market |
Companion Diagnostics Market |
|
Companion Diagnostics Market Size 2022 |
USD 6.3 Billion |
|
Companion Diagnostics Market Forecast 2032 |
USD 20.1 Billion |
|
Companion Diagnostics Market CAGR During 2023 - 2032 |
12.5% |
|
Companion Diagnostics Market Analysis Period |
2020 - 2032 |
|
Companion Diagnostics Market Base Year |
2022 |
|
Companion Diagnostics Market Forecast Data |
2023 - 2032 |
|
Segments Covered |
By Technology, By Indication, By Product & Service, By End-User, and By Geography |
|
Regional Scope |
North America, Europe, Asia Pacific, Latin America, and Middle East & Africa |
|
Key Companies Profiled Aviation |
Abnova Corporation, Agilent Technologies, Inc., QIAGEN N.V., Abbott Laboratories, Inc., Almac Group, Danaher Corporation, Illumina, Inc., bioMérieux SA, Myriad Genetics, Inc., Sysmex Corporation, Thermo Fisher Scientific Inc., and Hoffmann-La Roche AG. |
|
Report Coverage |
Market Trends, Drivers, Restraints, Competitive Analysis, Player Profiling, Covid-19 Analysis, Regulation Analysis |
Companion Diagnostics Market Insights
The advantages associated with companion diagnostics significantly support market growth. The increasing demand for targeted therapy, coupled with the growing importance of personalized medicine, is driving market expansion. Additionally, the rising prevalence of cancer worldwide, along with the expanding application areas of companion diagnostics, is accelerating market value. Moreover, the increasing demand for next-generation sequencing, a growing number of clinical trials, and the growing significance in drug development are expected to create potential opportunities over the companion diagnostics industry forecast period from 2023 to 2032.
However, the high cost of companion diagnostic tests and the unclear reimbursement status are expected to stifle market expansion. Reimbursement issues and cost concerns are important impediments to adoption, possibly limiting market development and restricting patient access to these breakthrough diagnostic technologies.
Furthermore, the combination of artificial intelligence (AI) and machine learning (ML) technologies represents a substantial opportunity in the companion diagnostics industry. Artificial intelligence and machine learning algorithms have the ability to analyse complicated biological data more rapidly and precisely, resulting in improved diagnostic capabilities and personalised therapy suggestions. Companion diagnostics can use AI and ML to enhance patient classification, predict therapy responses, and uncover novel biomarkers for therapeutic targeting. Furthermore, these technologies help improve clinical trial procedures by identifying appropriate patient groups and optimising trial design, reducing drug development delays. Overall, the incorporation of AI and ML into companion diagnostics has the potential to transform patient care by enabling more accurate and effective treatment regimens, hence boosting market development and innovation.
 Companion Diagnostics Market Segmentation
The worldwide market for companion diagnostics is split based on technology, indication, product & service, end-user, and geography.
Companion Diagnostics Market By Technology
- Immunohistochemistry (IHC)
- Polymerase Chain Reaction (PCR)
- In-situ Hybridization (ISH)
- Next-Generation Sequencing
- Gene Sequencing
- Others
According to companion diagnostics industry analysis, in 2022, the polymerase chain reaction (PCR) segment had the majority of the market share (%). This leadership position is due to the increased use of PCR for high-throughput identification of mutants with limited or low allele frequencies of genes, which is driving market value. Furthermore, PCR's very rapid turnaround time when compared to other technologies increases its commercial worth. The capacity of PCR to swiftly amplify DNA sequences and detect particular genetic differences has made it important in a wide range of sectors, including diagnostics, research, and forensic investigation. As developments in PCR technology improve its sensitivity, specificity, and scalability, its position in the molecular diagnostics industry is projected to remain and grow in the companion diagnostics market forecast years.
Companion Diagnostics Market By Indication
- Cardiovascular
- Neurological Diseases
- Cancer
- Breast Cancer
- Lung Cancer
- Colorectal Cancer
- Melanoma
- Gastric Cancer
- Infectious Diseases
- Others
In the companion diagnostics market, the cancer category appears as the leading force, accounting for the greatest share. This is largely due to the increased prevalence of cancer worldwide and the growing relevance of personalized therapy in oncology. Companion diagnostics are critical for directing targeted medicines and treatment decisions suited to particular patients' molecular profiles. Furthermore, the cancer category benefits from considerable research and development activities aimed at finding biomarkers and treatment targets, which contributes to its market dominance. As precision oncology gains pace, companion diagnostics remain critical tools for optimizing cancer treatment results, improving patient care, and ultimately driving progress in the battle against cancer.
Companion Diagnostics Market By Product & Service
- Assays, Kits & Reagents
- Software & Services
The assays, kits, and reagents category dominates the companion diagnostics market, accounting for the majority of the market. This dominance is largely due to the essential role of assays, kits, and reagents in companion diagnostics processes. These goods are the basic components required for diagnostic testing, allowing the identification of certain biomarkers and genetic variants linked to various illnesses. Furthermore, the assays, kits, and reagents section benefits from ongoing technological breakthroughs, which result in the creation of more sensitive and accurate diagnostic instruments. Furthermore, the growing desire for personalized medicine and targeted therapeutics drives up the use of assays, kits, and reagents, cementing their place as the foundation of companion diagnostics. As precision medicine initiatives rise, this category is likely to maintain its leadership position, fueling innovation and growth in the companion diagnostics market.
Companion Diagnostics Market By End-Users
- Pharmaceutical & Biopharmaceutical Companies
- Reference Laboratories
- Contract Research Organizations
- Others
Pharmaceutical & biopharmaceutical companies is the main end-user category in the companion diagnostics market, accounting for a sizable proportion. This dominance is largely due to the critical involvement of pharmaceutical and biopharmaceutical corporations in the development and commercialization of companion diagnostic products. These firms use companion diagnostics to improve the efficacy and safety of their therapeutic products, shorten clinical trial procedures, and identify potential patient populations for targeted medicines. Furthermore, as precision medicine gets traction, pharmaceutical and biopharmaceutical companies see the importance of companion diagnostics in supporting personalised treatment options. Pharmaceutical and biopharmaceutical businesses drive innovation and shape the landscape of companion diagnostics through strategic alliances and collaborations with diagnostic companies, cementing their position as essential market stakeholders.
Companion Diagnostics Market Regional Outlook
North America
- U.S.
- Canada
Europe
- U.K.
- Germany
- France
- Spain
- Rest of Europe
Asia-Pacific
- India
- Japan
- China
- Australia
- South Korea
- Rest of Asia-Pacific
Latin America
- Brazil
- Mexico
- Rest of LATAM
The Middle East & Africa
- South Africa
- GCC Countries
- Rest of the Middle East & Africa (ME&A)
 Companion Diagnostics Market Regional Analysis
In terms of companion diagnostics market analysis, in 2022, North America dominated the worldwide industry, owing mostly to the region's increased prevalence of chronic illnesses. Furthermore, North America has a large potential share due to the existence of global businesses and excellent technologies. The region's well-established sophisticated healthcare infrastructure adds to its market value, making companion diagnostics more widely adopted and used. On other hand, the Asia-Pacific area is expected to see the greatest growth from 2023 to 2032. This expansion is expected as a result of increased proteomics and genomics research efforts, favorable research funding, increased investments by large pharmaceutical and biotechnology businesses, and greater awareness of personalized medicines. These factors are likely to drive market expansion in the Asia-Pacific region throughout the forecast period, establishing it as a significant growth market in the companion diagnostics industry.
Companion Diagnostics Market Players
Some of the top Companion Diagnostics companies offered in our report includes Abnova Corporation, Agilent Technologies, Inc., QIAGEN N.V., Abbott Laboratories, Inc., Almac Group, Danaher Corporation, Illumina, Inc., bioMérieux SA, Myriad Genetics, Inc., Sysmex Corporation, Thermo Fisher Scientific Inc., and Hoffmann-La Roche AG.
Frequently Asked Questions
How big is the companion diagnostics market?
The companion diagnostics market size was valued at USD 6.3 billion in 2022.
What is the CAGR of the global companion diagnostics market from 2023 to 2032?
The CAGR of companion diagnostics is 12.5% during the analysis period of 2023 to 2032.
Which are the key players in the companion diagnostics market?
The key players operating in the global market are including Abnova Corporation, Agilent Technologies, Inc., QIAGEN N.V., Abbott Laboratories, Inc., Almac Group, Danaher Corporation, Illumina, Inc., bioMérieux SA, Myriad Genetics, Inc., Sysmex Corporation, Thermo Fisher Scientific Inc., and Hoffmann-La Roche AG.
Which region dominated the global companion diagnostics market share?
North America held the dominating position in companion diagnostics industry during the analysis period of 2023 to 2032.
Which region registered fastest CAGR from 2023 to 2032?
Asia-Pacific region exhibited fastest growing CAGR for market of companion diagnostics during the analysis period of 2023 to 2032.
What are the current trends and dynamics in the global companion diagnostics industry?
The current trends and dynamics in the companion diagnostics industry include increasing adoption of personalized medicine, growing demand for targeted therapies, expanding applications in oncology, and rise in regulatory approvals for companion diagnostics.
Which indication held the maximum share in 2022?
The cancer indication held the maximum share of the companion diagnostics industry.


