Coal to Liquid Market Size - Global Industry, Share, Analysis, Trends and Forecast 2022 - 2030
Published :
Report ID:
Pages :
Format :
Coal to Liquid Market Size - Global Industry, Share, Analysis, Trends and Forecast 2022 - 2030
Report Coverage
- Industry Dynamics
- Market Size and Forecast Data
- Segment Analysis
- Competitive Landscape
- Regional Analysis with a Niche Focus on Country-Level Data
- High Level Analysis - Porter's, PESTEL, Value Chain, etc.
- Company Profiles of Key Players
- Option to Customize the Report As Per Your Specific Need
Request Sample Report
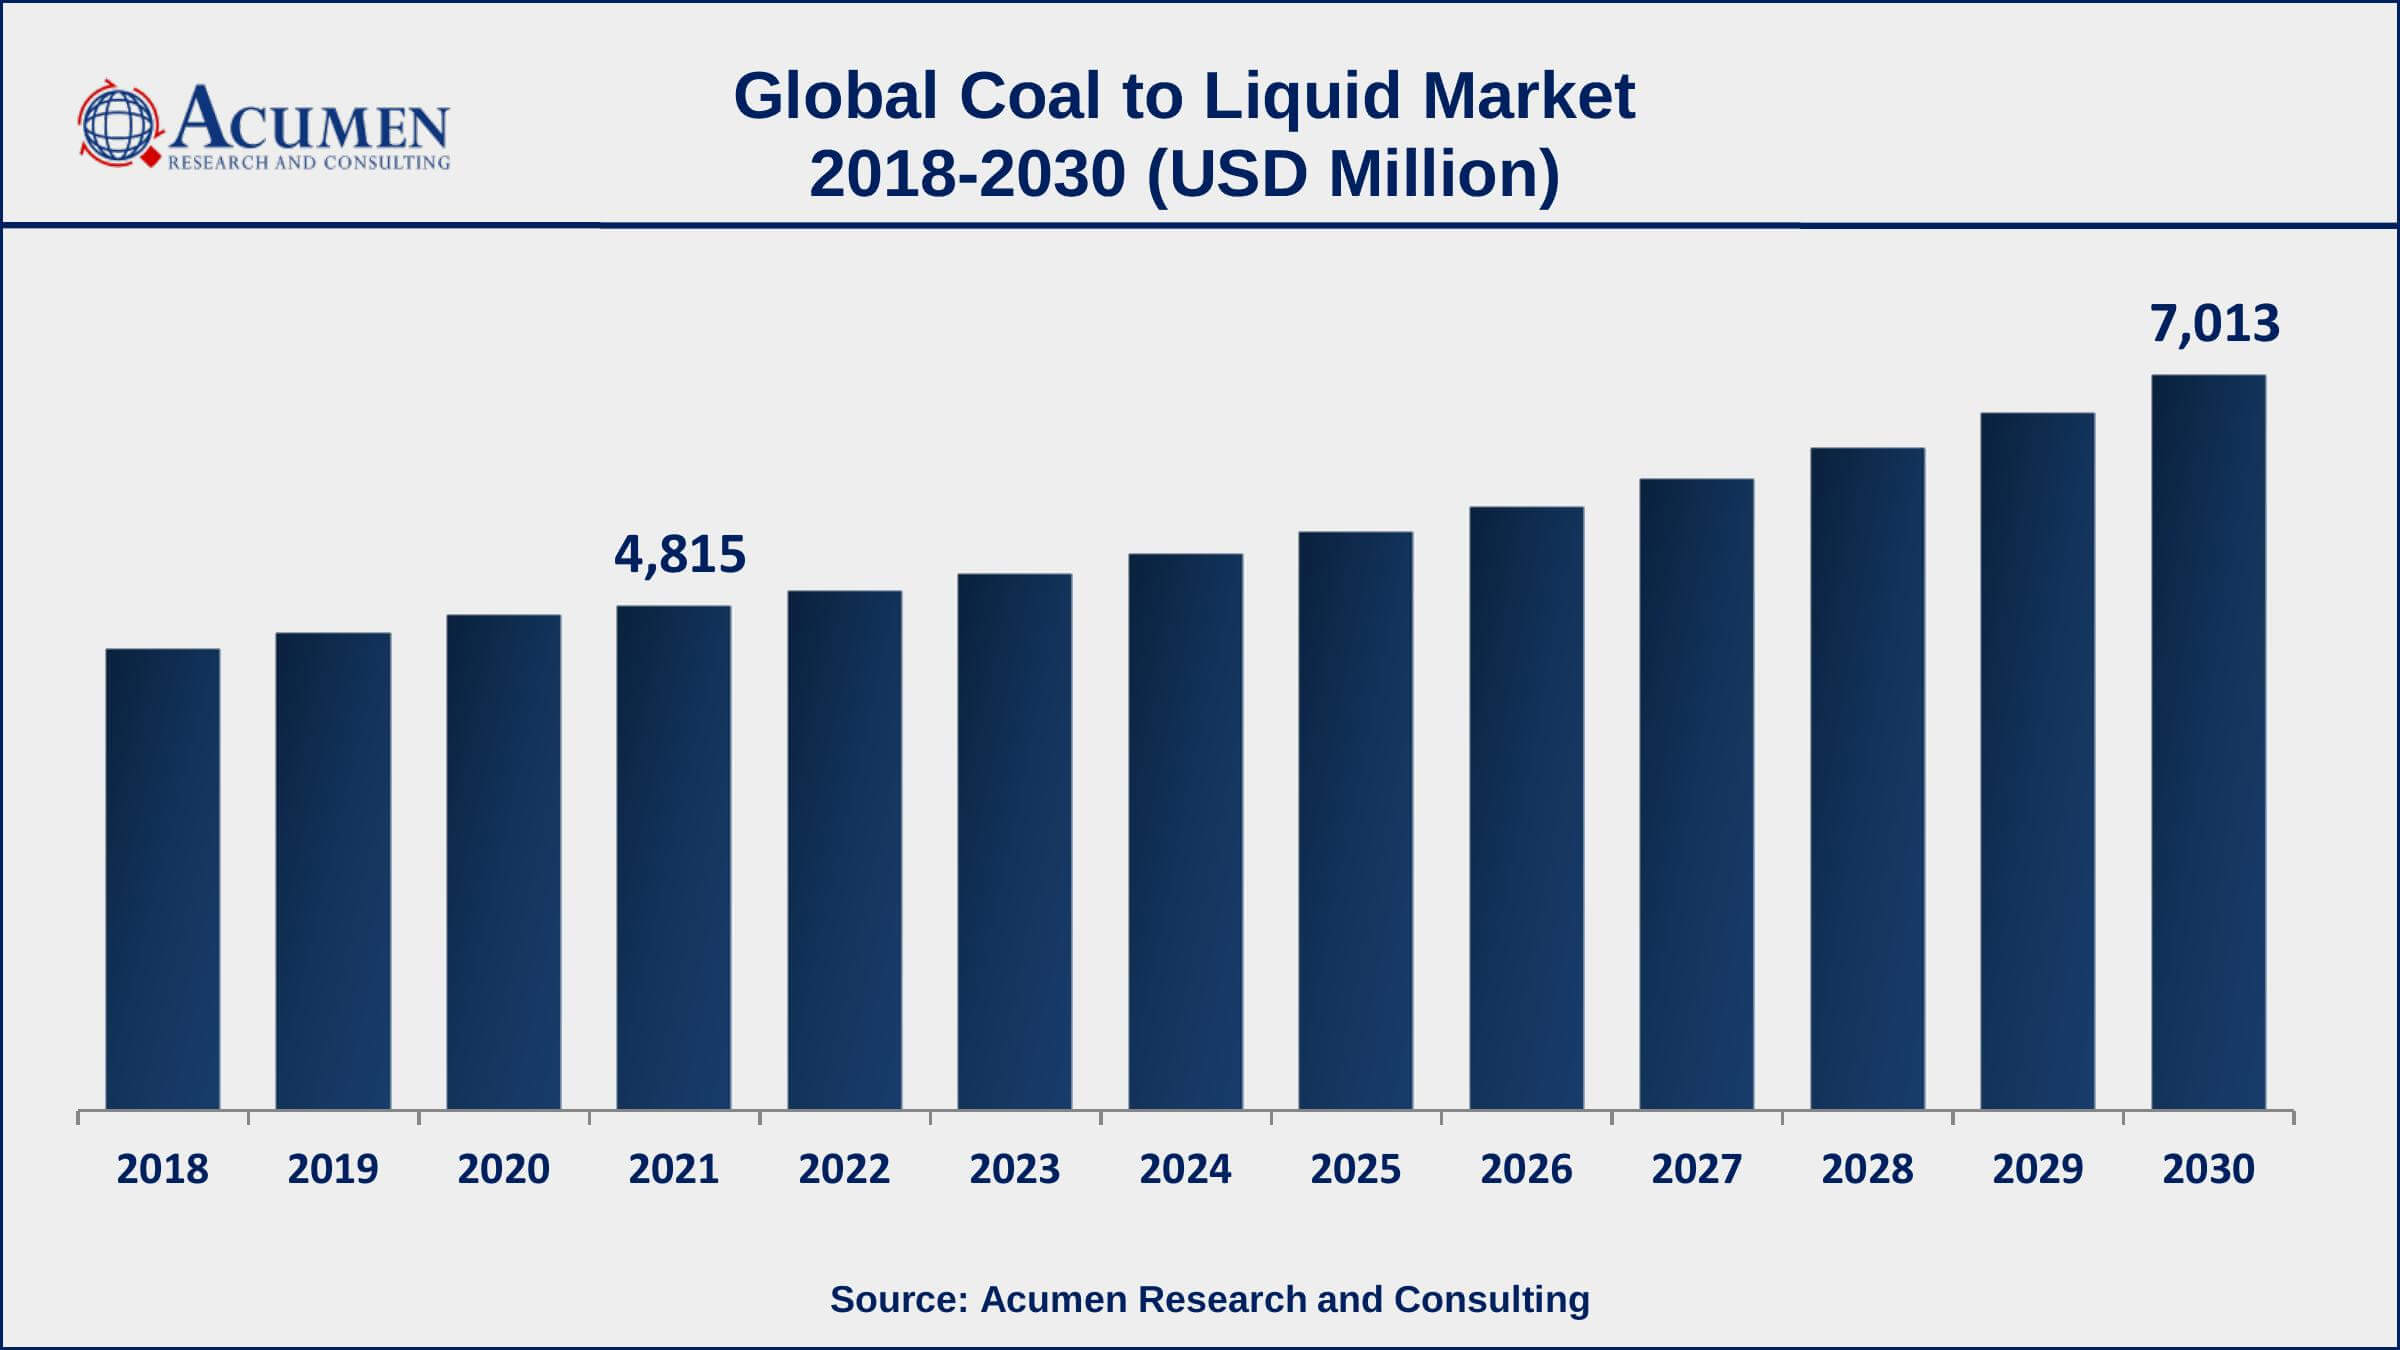
The Global Coal to Liquid Market Size accounted for USD 4,815 Million in 2021 and is estimated to achieve a market size of USD 7,013 Million by 2030 growing at a CAGR of 4.4% from 2022 to 2030. The increasing costs of refining crude oil or natural gas drive demand for the coal to liquid (CTL) market growth. Furthermore, the rise in demand for liquid fuel in the transportation and power generating sectors is likely to increase the coal to liquid market value in the coming years.
Coal to Liquid Market Report Key Highlights
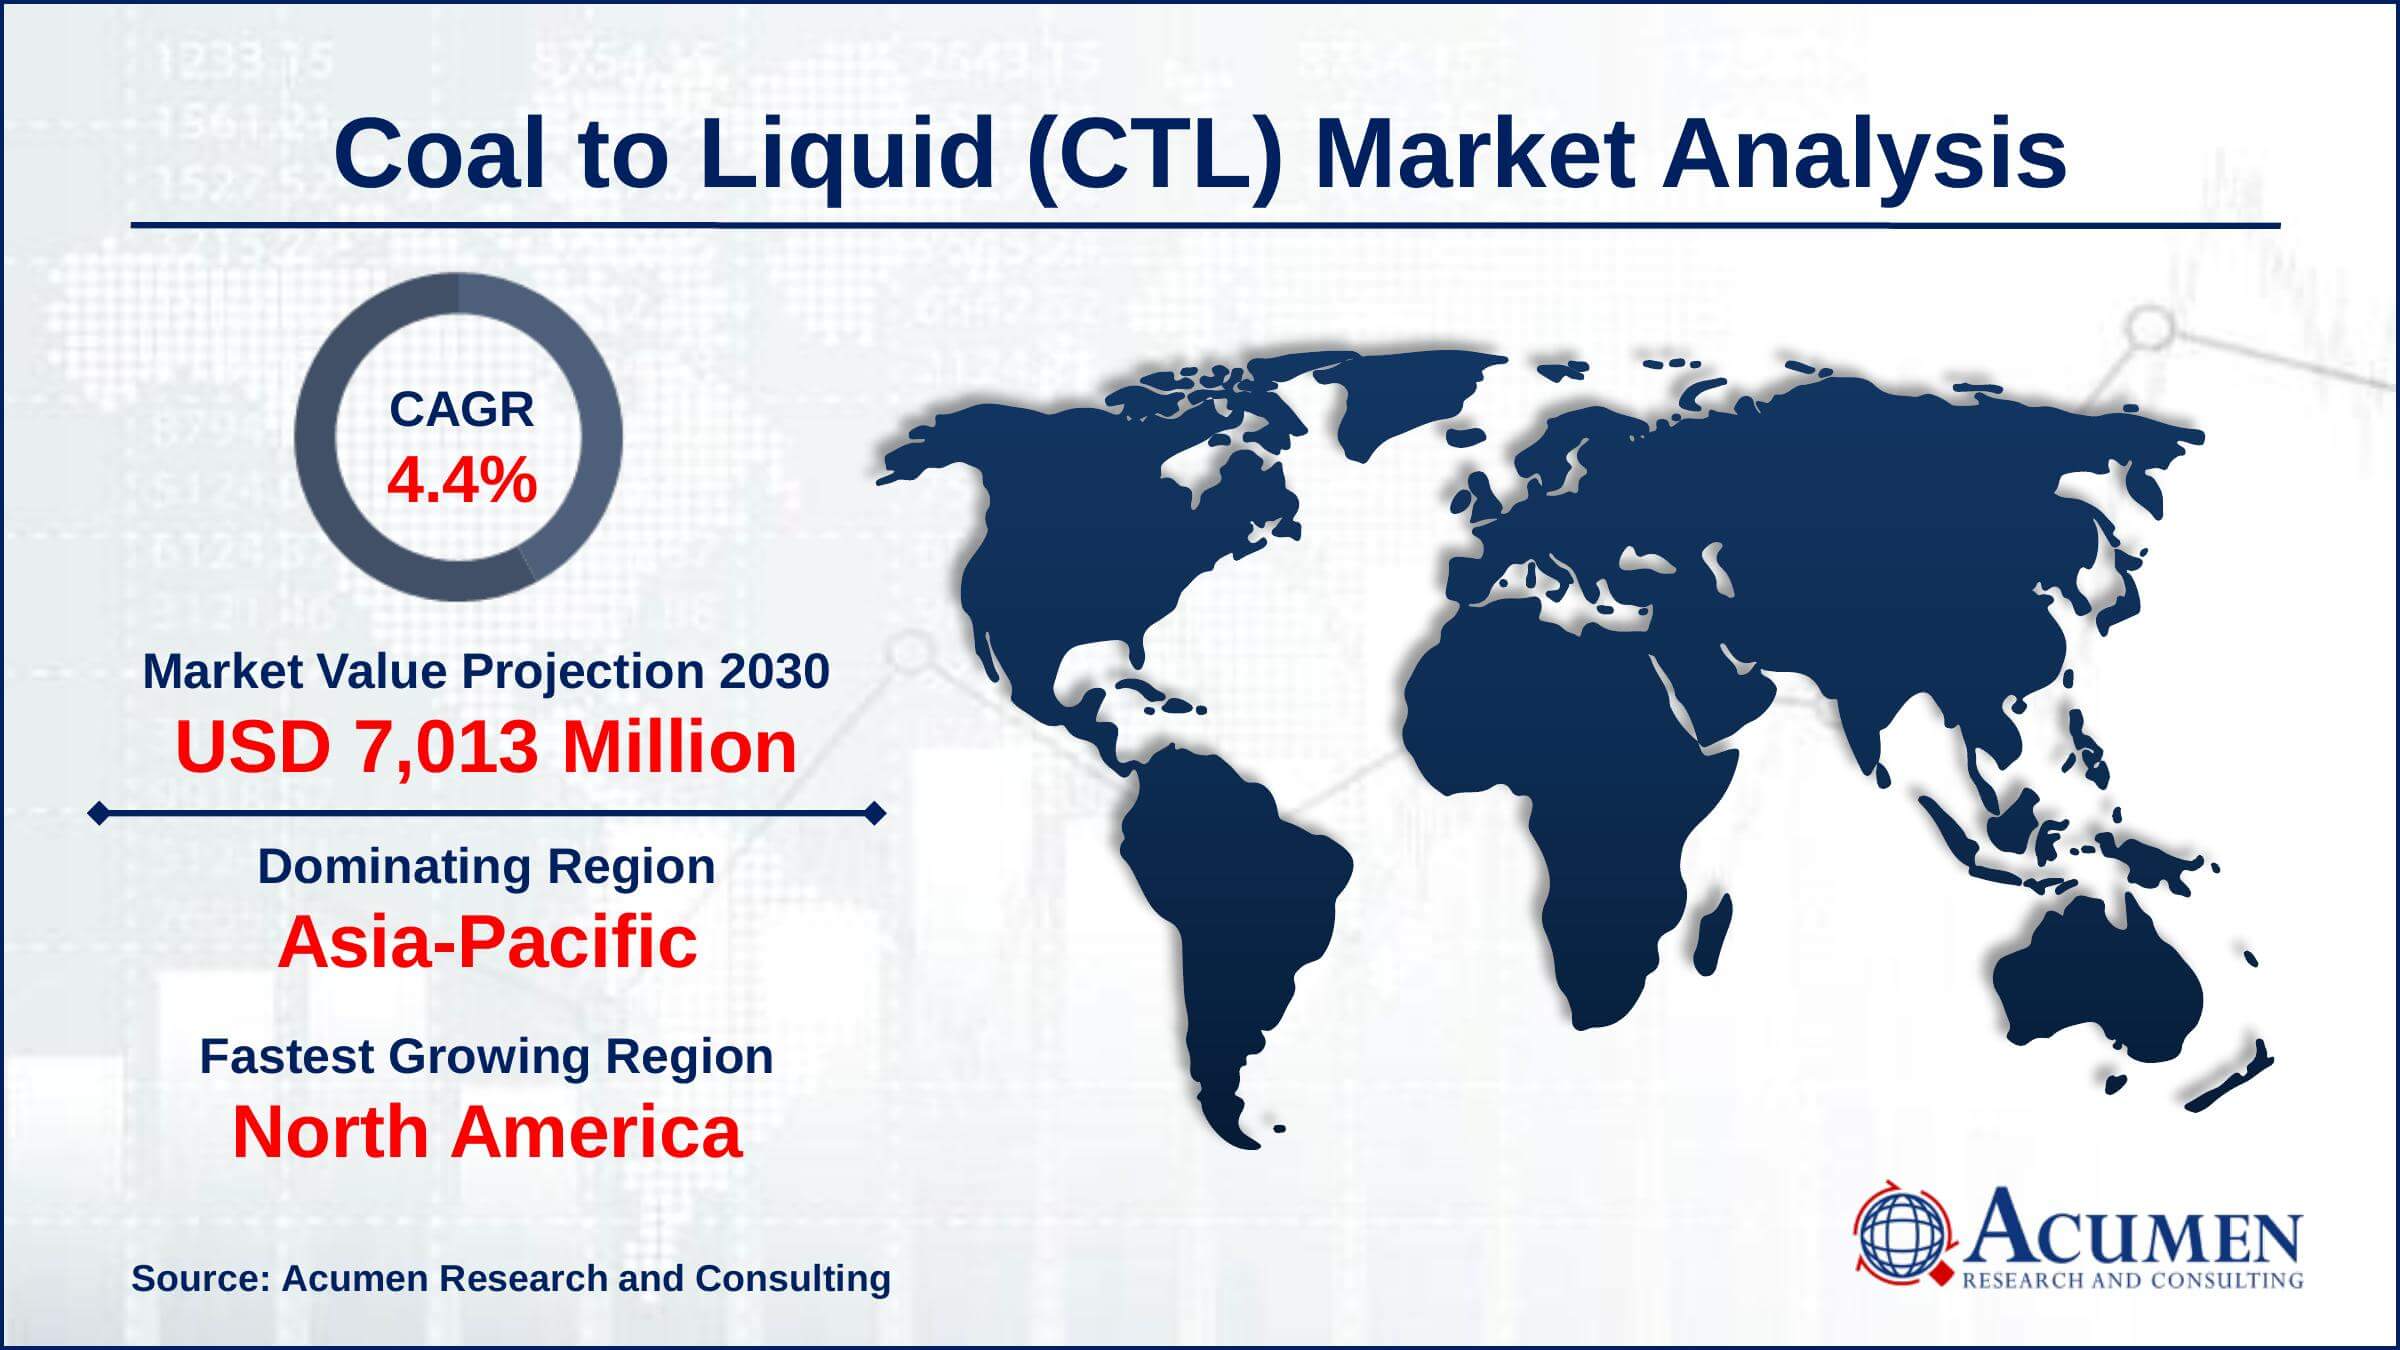
- Global coal to liquid market revenue is estimated to expand by USD 7,013 million by 2030, with a 4.4% CAGR from 2022 to 2030.
- Asia-Pacific coal to liquid market share accounted for over 39% of total market shares in 2021
- North America coal to liquid market growth will observe fastest CAGR from 2022 to 2030
- Based on product, diesel segment accounted for over 58% of the overall market share in 2021
- Among technology, indirect coal liquefaction segment engaged more than 72% of the total market share
- Increasing prices of petroleum products, drives the coal to liquid (CTL) market size
Coal and liquid petroleum fuels are two of the most widely used fuels on the planet. Coal is the most popular type of fuel used to generate energy around the world, whereas petroleum fuels are widely used in the automobile of all types. Coal may be transformed into liquid fuels due to their comparable internal structure both are composed of hydrocarbons. This process has gained prominence in recent years as more people become aware of the diminishing amounts of petroleum reservoirs.
Global Coal to Liquid Market Trends
Market Drivers
- Coal is abundant, especially when compared to liquid fuels
- Increase in natural gas processing expenses
- Increasing prices of petroleum products
- Growing demands for transportation fuels
Market Restraints
- High investment cost for the CTL facility
- Inadequate knowledge of the procedure
Market Opportunities
- Technological advancements in processes
- Growing environmental concerns
Coal to Liquid Market Report Coverage
| Market | Coal to Liquid Market |
| Coal to Liquid Market Size 2021 | USD 4,815 Million |
| Coal to Liquid Market Forecast 2030 | USD 7,013 Million |
| Coal to Liquid Market CAGR During 2022 - 2030 | 4.4% |
| Coal to Liquid Market Analysis Period | 2018 - 2030 |
| Coal to Liquid Market Base Year | 2021 |
| Coal to Liquid Market Forecast Data | 2022 - 2030 |
| Segments Covered | By Product, By Technology, And By Geography |
| Regional Scope | North America, Europe, Asia Pacific, Latin America, and Middle East & Africa |
| Key Companies Profiled | Linc Energy, Envidity Energy, Inc., DKRW Energy, China Shenhua Energy Co. Ltd., Bumi PLC, Altona Energy PLC, Manosh Energy, Sasol Ltd., Celanese Corporation, and TransGas Development Systems, LLC. |
| Report Coverage |
Market Trends, Drivers, Restraints, Competitive Analysis, Player Profiling, Regulation Analysis |
An increase in the expenses of natural gas processing or crude oil is additionally anticipated to drive demand for the CTL market. Numerous CTL projects will be commercialized in not so distant future with the expectation of a motivator for delayed endeavors to change over coal to low-sulfur, fiery debris-free transportation powers and in the end vaporous powers for residential use. Technological advancements combined with supported development of the liquid fuels demand for transportation are the key variables driving the worldwide coal to liquid (CTL) market value. In the present business situation, there are twenty dynamic CTL offices over the globe. With a rise in gas costs, the substitution of flammable gas from dry coal, to be utilized in petroleum gas let go control age offices, is by all accounts altogether efficient.
Technologically progressive fuel cell and combined cycle power generation operations will likewise require the transformation of coal to clean vaporous or fluid fills. Fluid products got from syngas are anticipated to capture a higher market share in the coming years. Simple accessibility of cutting-edge and process-explicit impetus has empowered the production of higher hydrocarbons and oxygenates including methanol. Synthesis gas-determined fuel products are relied upon to increase higher significance in not so distant future. These products are helpful for commodity chemicals and furthermore discover applications as transportation fuels.
Also, they can be utilized in the production of storable advantageous fuel for IGCC electric plants. The Fischer Tropsch process is the most broadly utilized coal synthesis process in the business. Its responses and polymerization of syngas efficiencies are viewed as higher and alterable according to explicit necessities to deliver a wide exhibit of products, for example, paraffin waxes, hydrocarbon gases, and oxygenates. Coordinate Coal Liquefaction (DCL) is broadly utilized in different applications in a great deal of CTL plants. The products delivered utilizing this procedure can be refined to meet the vast majority of the present particulars of transportation fuels.
Coal to Liquid Market Segmentation
The worldwide coal to liquid market segmentation is based on the product, technology, and geography.
Coal to Liquid Market By Product
- Diesel
- Gasoline
- Others
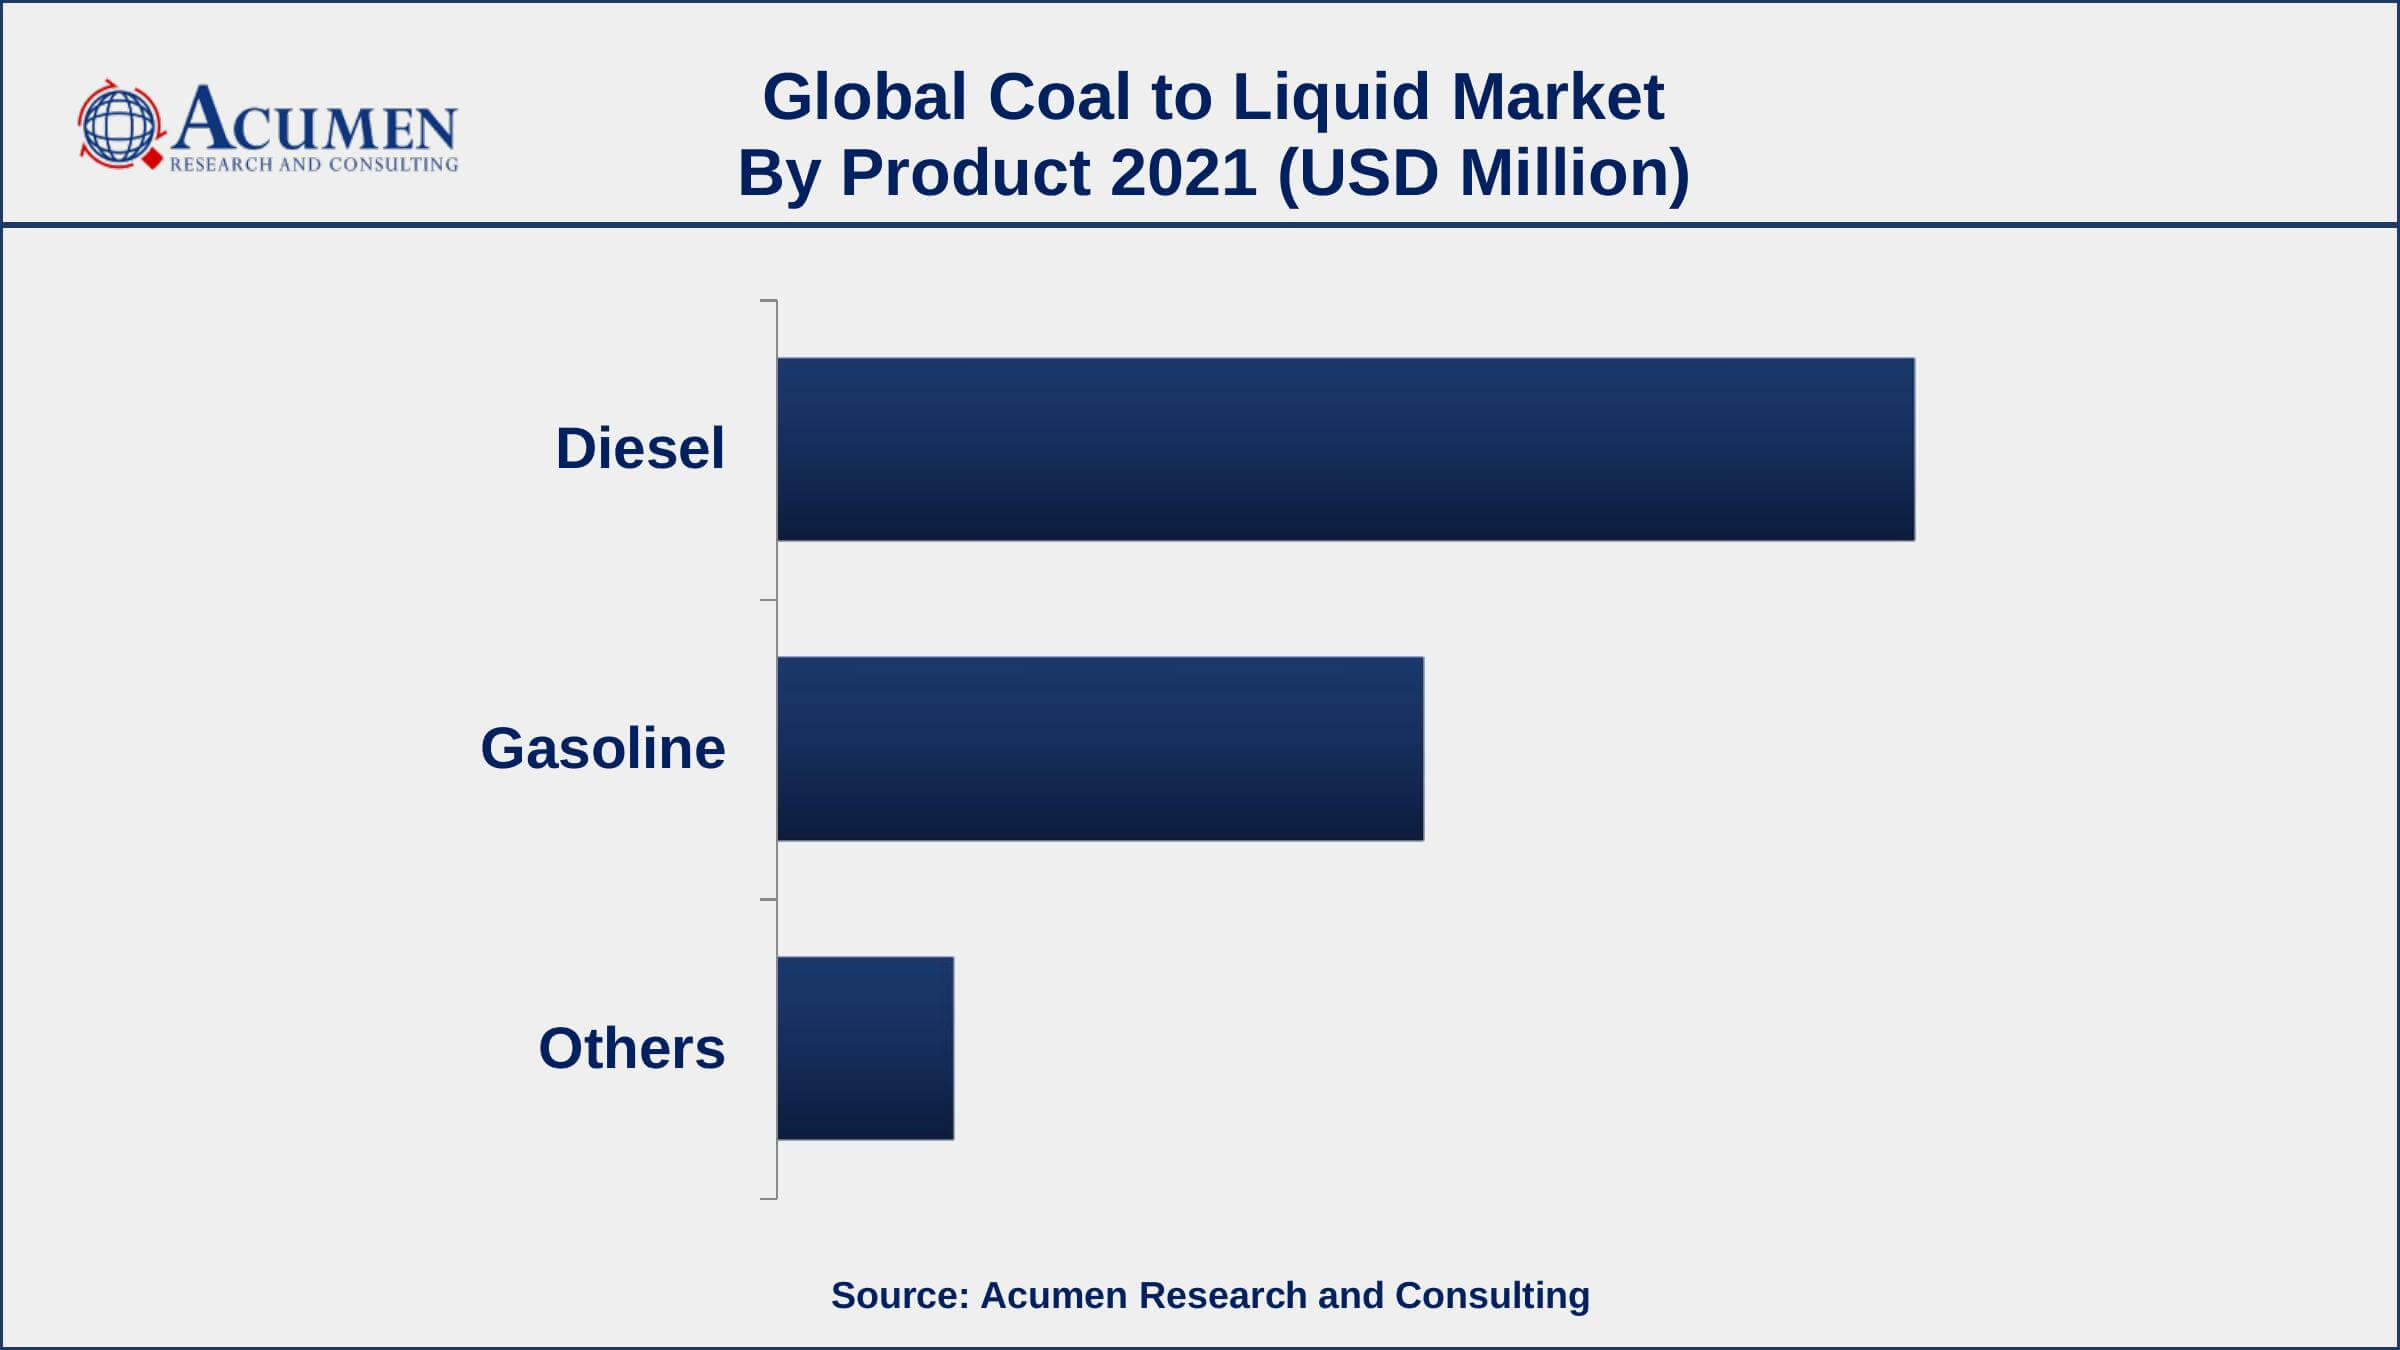
According to a coal to liquid industry analysis, the diesel segment can account for more than half of the market share in 2021. Diesel produced by CTL techniques has a number of potential benefits. Aromatic compounds in diesel derived from crude oil produce particles when burned. However, diesel produced from coal liquefaction does not include aromatics and hence burns significantly cleaner, overcoming one of the fundamental objections to diesel combustion.
Coal to Liquid Market By Technology
- DCL
- ICL
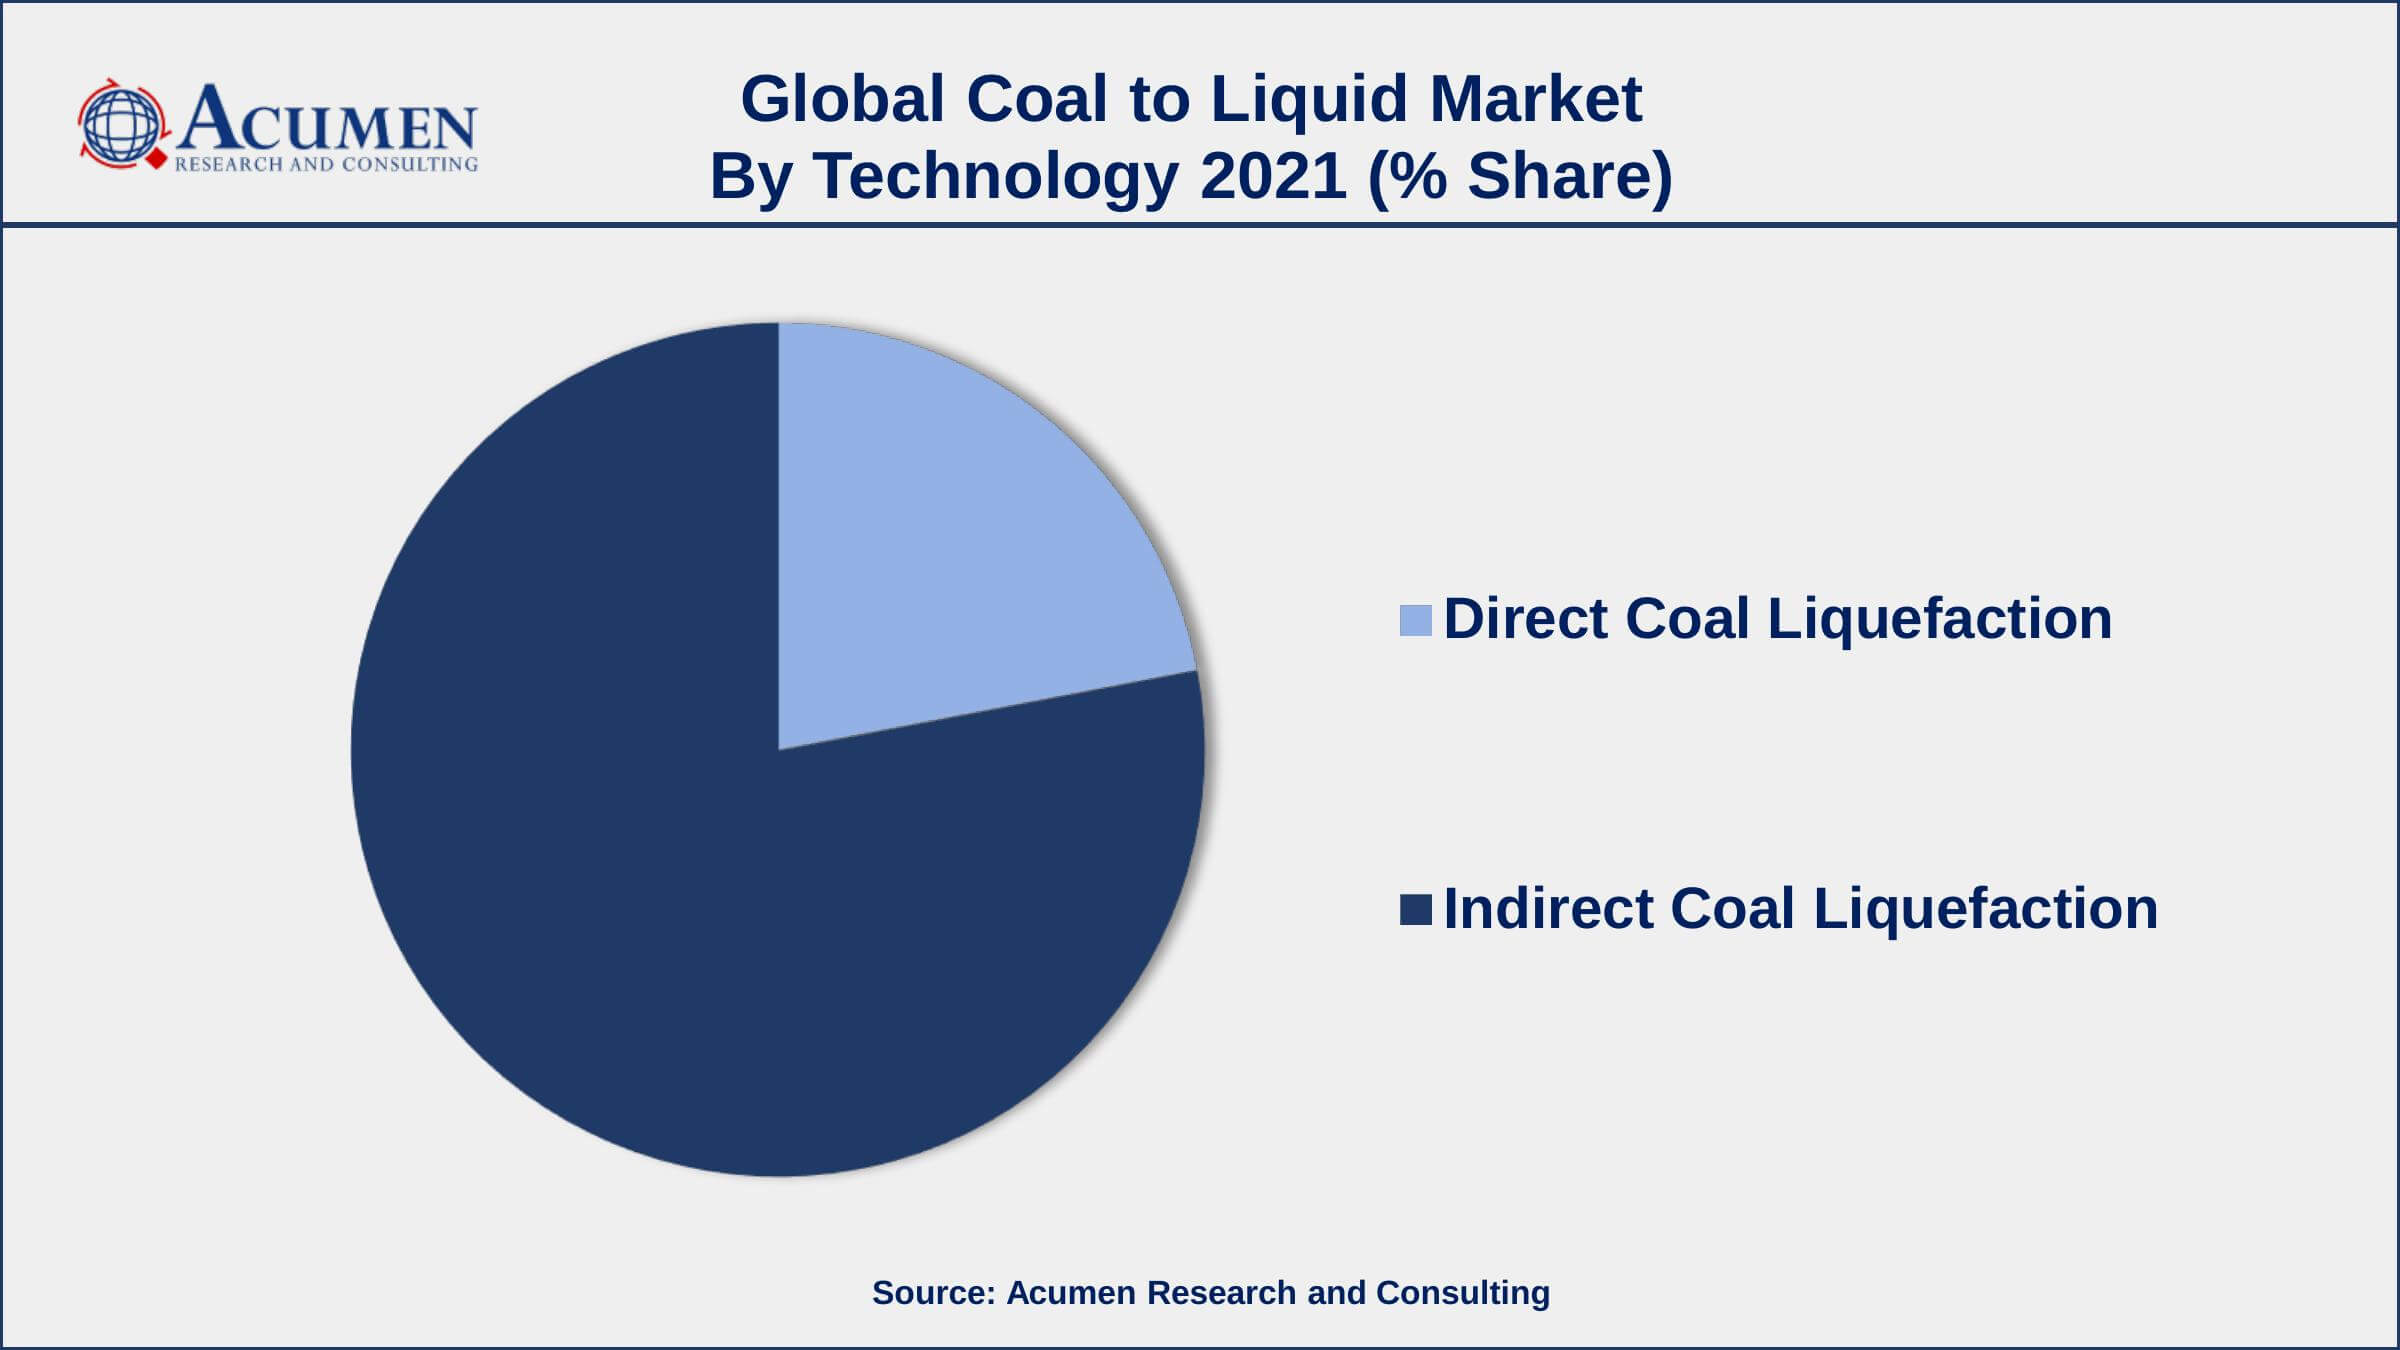
According to the coal to liquid market projection, the direct coal liquefaction (DCL) segment is expected to grow significantly in the market over the predicted years. This method is employed at a number of CTL facilities around the world. It is suited and advantageous for a diverse variety of feeds, particularly low-cash sub-bituminous coals, high-velocity bituminous coals, and low-cash lignites.
Coal to Liquid Market Regional Outlook
North America
- U.S.
- Canada
Europe
- U.K.
- Germany
- France
- Spain
- Rest of Europe
Asia-Pacific
- India
- Japan
- China
- Australia
- South Korea
- Rest of Asia-Pacific
Latin America
- Brazil
- Mexico
- Rest of Latin America
The Middle East & Africa
- South Africa
- GCC Countries
- Rest of the Middle East & Africa (ME&A)
Asia-Pacific Holds The Major Share Of The Global Coal to Liquid Market
The majority of the CTL plants are focused around China and a couple in India and Indonesia. China has five working offices with the most extreme production capacity in the region. In India, there are three working undertakings. Asia Pacific is the most rewarding geological area for the business members attributable to the way that the capital use or CAPEX for CTL plant setup of any limit is just 70%.
In addition, FT-diesel generation costs are likewise similarly brought down in APAC than in U.S. China is the biggest regional market, as far as the creation of manufactured powers. It is the world's largest producer and consumer of coal. The Chinese government is effectively involved in advancing the production of synthetic fuels from coal to decrease its reliance on the import of finished petroleum products.
Coal to Liquid Market Players
Some of the top coal to liquid market companies offered in the professional report include Linc Energy, Envidity Energy, Inc., DKRW Energy, China Shenhua Energy Co. Ltd., Bumi PLC, Altona Energy PLC, Manosh Energy, Sasol Ltd., Celanese Corporation, and TransGas Development Systems, LLC.
Frequently Asked Questions
What is the size of global coal to liquid (CTL) market in 2021?
The estimated value of global coal to liquid market in 2021 was accounted to be USD 4,815 Million.
What is the CAGR of global coal to liquid market during forecast period of 2022 to 2030?
The projected CAGR coal to liquid market during the analysis period of 2022 to 2030 is 4.4%.
Which are the key players operating in the market?
The prominent players of the global coal to liquid market are Linc Energy, Envidity Energy, Inc., DKRW Energy, China Shenhua Energy Co. Ltd., Bumi PLC, Altona Energy PLC, Manosh Energy, Sasol Ltd., Celanese Corporation, and TransGas Development Systems, LLC.
Which region held the dominating position in the global coal to liquid market?
Asia-Pacific held the dominating coal to liquid during the analysis period of 2022 to 2030.
Which region registered the fastest growing CAGR for the forecast period of 2022 to 2030?
North America region exhibited fastest growing CAGR for coal to liquid during the analysis period of 2022 to 2030.
What are the current trends and dynamics in the global coal to liquid market?
Increase in natural gas processing expenses and rising prices of petroleum products drives the growth of global coal to liquid market.
By product segment, which sub-segment held the maximum share?
Based on product, diesel segment is expected to hold the maximum share of the coal to liquid market.


