Chemical Tanker Shipping Market Size - Global Industry, Share, Analysis, Trends and Forecast 2024 - 2032
Published :
Report ID:
Pages :
Format :
Chemical Tanker Shipping Market Size - Global Industry, Share, Analysis, Trends and Forecast 2024 - 2032
Report Coverage
- Industry Dynamics
- Market Size and Forecast Data
- Segment Analysis
- Competitive Landscape
- Regional Analysis with a Niche Focus on Country-Level Data
- High Level Analysis - Porter's, PESTEL, Value Chain, etc.
- Company Profiles of Key Players
- Option to Customize the Report As Per Your Specific Need
Request Sample Report
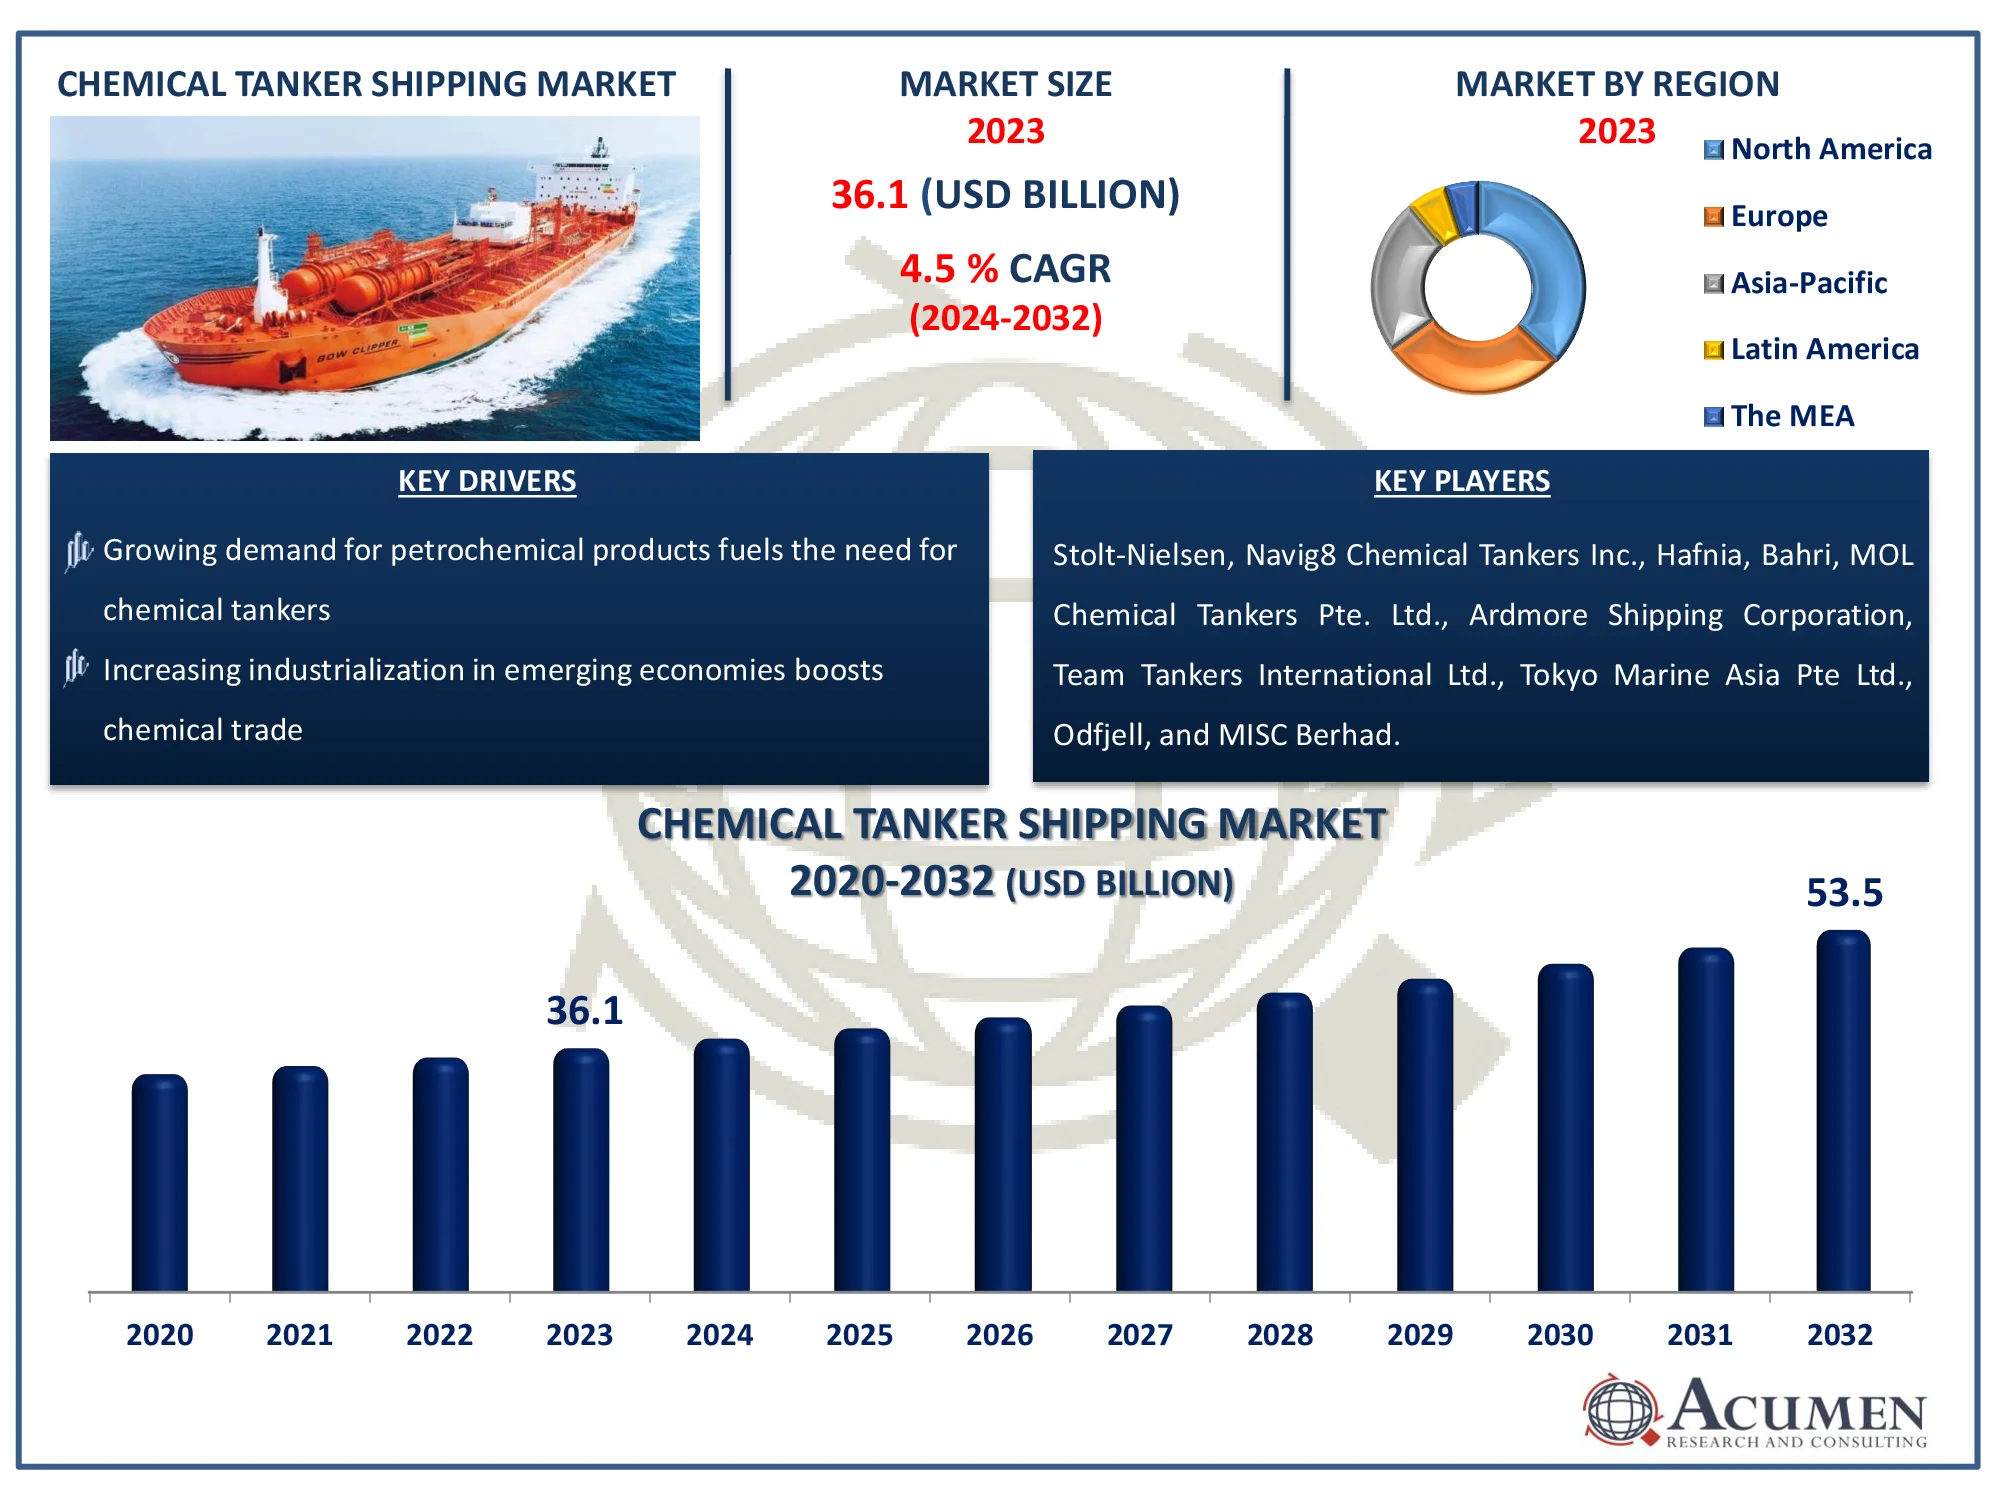
The Global Chemical Tanker Shipping Market Size accounted for USD 36.1 Billion in 2023 and is estimated to achieve a market size of USD 53.5 Billion by 2032 growing at a CAGR of 4.5% from 2024 to 2032.
Chemical Tanker Shipping Market Highlights
- Global chemical tanker shipping market revenue is poised to garner USD 53.5 billion by 2032 with a CAGR of 4.5% from 2024 to 2032
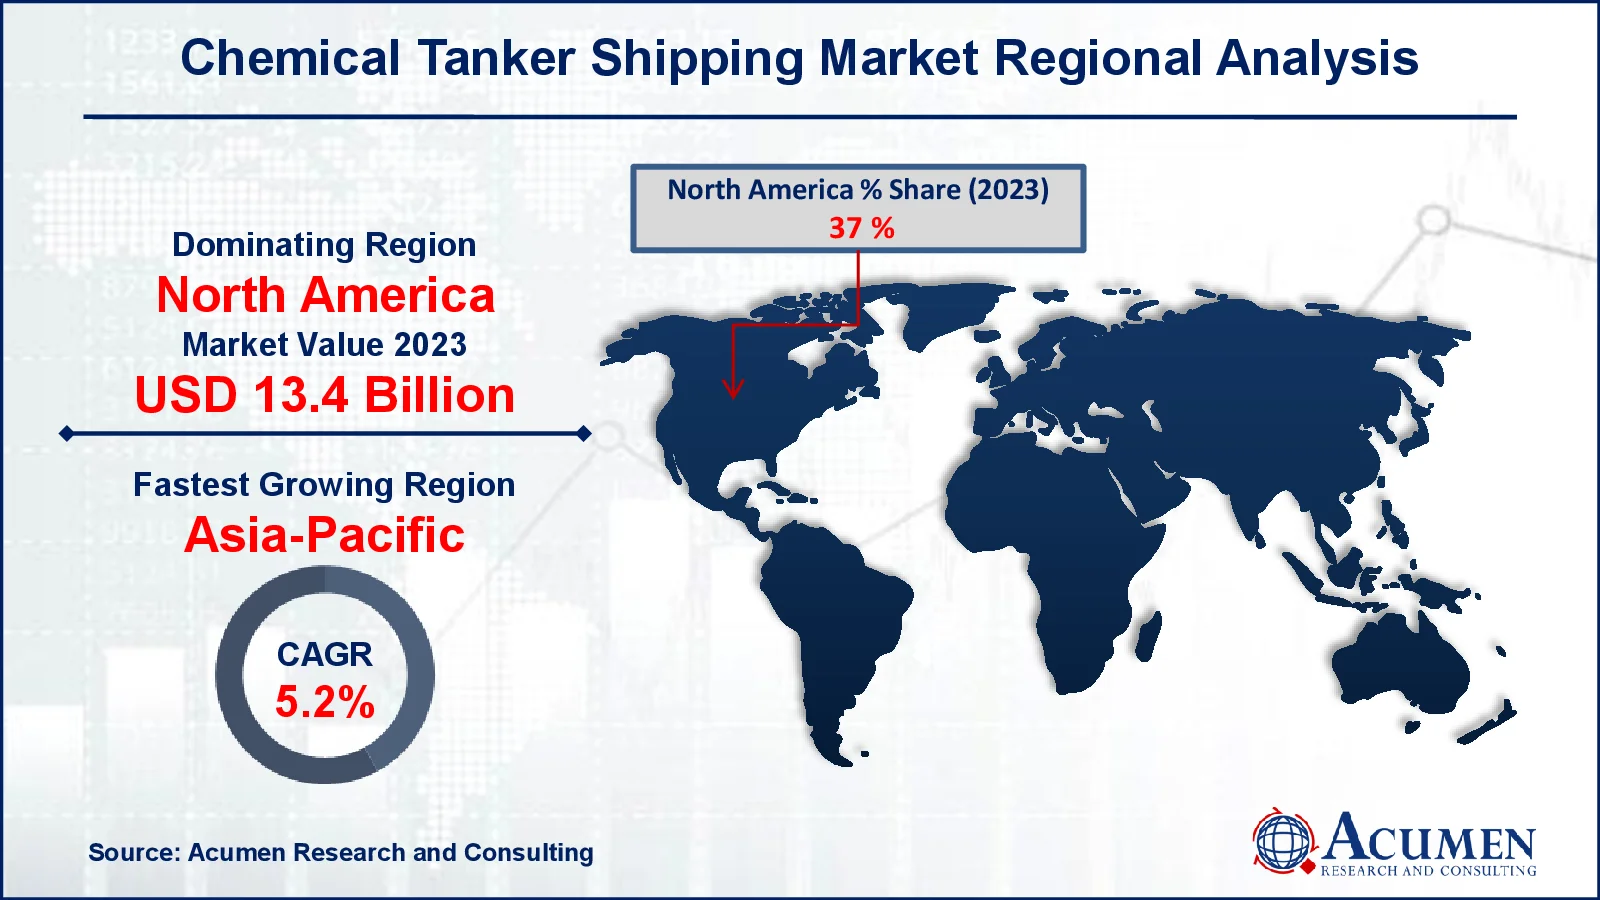
- North America chemical tanker shipping market value occupied around USD 13.4 billion in 2023
- Asia-Pacific chemical tanker shipping market growth will record a CAGR of more than 5.2% from 2024 to 2032
- Among fleet type, the IMO 2 sub-segment generated more than USD 18.4 billion revenue in 2023
- Based on product, the deep-sea chemical tankers (10,000-50,000 DWT) sub-segment generated around 72% chemical tanker shipping market share in 2023
- Expansion of seaborne trade in Asia-Pacific is a popular chemical tanker shipping market trend that fuels the industry demand

Chemical tanker shipping refers to the constructed ships for carrying liquid chemicals in bulk. These chemical tankers are required to fulfill safety aspects because many chemicals are flammable and toxic. Additionally, these tankers are required mandatory compliance with the International Bulk Chemical Code (IBC Code). Furthermore, there are various types of chemical tankers available in the shipping industry including inland chemical tankers with a deadweight tonnage (DWT) range from 1,000 to 4,999, coastal chemical tankers with DWT range from 5,000 to 9,999 and deep-sea chemical tankers with DWT range from 10,000 to 50,000.
These chemical tankers are used for carrying organic chemicals, inorganic chemical, vegetable oils & fats, and others including additives, lube oils, and molasses. Inland chemical tankers are typically in the form of self-propelled barges. These are commonly used in Europe in the river system to carry the load from large tankers and coastal terminals for transporting them to inland industrial facilities. Coastal chemical tankers are small tankers used to transport chemicals where larger tankers are restricted. In addition, deep-sea tankers are basically ocean-going vessels consists of stainless steel or coated tanks.
Global Chemical Tanker Shipping Market Dynamics
Market Drivers
- Growing demand for petrochemical products fuels the need for chemical tankers
- Increasing industrialization in emerging economies boosts chemical trade
- Expansion of the global chemical industry supports market growth
- Advancements in tanker technology improve efficiency and safety
Market Restraints
- Stringent environmental regulations increase operational costs
- Volatile crude oil prices impact profitability
- High initial investment requirements deter new market entrants
Market Opportunities
- Rising demand for bio-based chemicals creates new trade routes
- Growth in specialty chemicals market offers niche transport opportunities
- Technological innovations in tank coatings enhance cargo compatibility
Chemical Tanker Shipping Market Report Coverage
|
Market |
Chemical Tanker Shipping Market |
|
Chemical Tanker Shipping Market Size 2023 |
USD 36.1 Billion |
|
Chemical Tanker Shipping Market Forecast 2032 |
USD 53.5 Billion |
|
Chemical Tanker Shipping Market CAGR During 2024 - 2032 |
4.5% |
|
Chemical Tanker Shipping Market Analysis Period |
2020 - 2032 |
|
Chemical Tanker Shipping Market Base Year |
2023 |
|
Chemical Tanker Shipping Market Forecast Data |
2024 - 2032 |
|
Segments Covered |
By Product, By Fleet Type, By Application, and By Geography |
|
Regional Scope |
North America, Europe, Asia Pacific, Latin America, and Middle East & Africa |
|
Key Companies Profiled |
Stolt-Nielsen, Navig8 Chemical Tankers Inc., Hafnia, Bahri, MOL Chemical Tankers Pte. Ltd., Ardmore Shipping Corporation, Team Tankers International Ltd., Tokyo Marine Asia Pte Ltd., Odfjell, and MISC Berhad. |
|
Report Coverage |
Market Trends, Drivers, Restraints, Competitive Analysis, Player Profiling, Covid-19 Analysis, Regulation Analysis |
Chemical Tanker Shipping Market Insights
As worldwide demand for chemicals increases and crude oil prices decrease, the chemical tanker transportation business expands substantially. For instance according to the India Brand Equity Foundation in April-May 2024, exports of organic and inorganic chemicals totaled $4.78 billion. Chemicals are increasingly being used in a wide range of industries, including medicine and construction, necessitating the development of efficient and specialised chemical transportation systems. Furthermore, the growing trend toward healthy living has resulted in increased demand for oilseeds, vegetable oils, and fats. This trend is being driven by increased consumer awareness of the benefits of healthy and safe food, which is hastening the market's growth trajectory.
The Asia-Pacific area stands out as a big contributor to this expansion, with increased investments in chemical production. Emerging economies in the region are increasing their manufacturing capabilities, generating several chances for chemical tanker shipping operators to meet increased trade volumes. For instance according to the India Brand Equity Foundation India's need for chemicals and petrochemicals is predicted to nearly treble, reaching $1 trillion by 2040.
However, a number of barriers are preventing the market from expanding. Stringent oil bunkering restrictions complicate operations and boost costs for marine businesses. Geopolitical concerns, such as the North American Free Trade Agreement (NAFTA) renegotiation and rising geopolitical tensions, are also limiting trade flows. These concerns, together with rising geopolitical tensions, are expected to restrict market growth from 2024 to 2032.
Chemical Tanker Shipping Market Segmentation
The worldwide market for chemical tanker shipping is split based on product, fleet type, application, and geography.
Chemical Tanker Shipping Product
- Inland Chemical Tankers (1,000-4,999 DWT)
- Coastal Chemical Tankers (5,000-9,999 DWT)
- Deep-Sea Chemical Tankers (10,000-50,000 DWT)
According to chemical tanker shipping industry analysis, the deep-sea chemical tankers sector has the largest market share, and it is expected to retain this dominance over the forecast period. The segment's growth is being supported by an increase in chemical trade via deep-sea chemical tankers for the construction and building industries, as well as the car manufacturing industry.
Chemical Tanker Shipping Fleet Type
- IMO 3
- IMO 2
- IMO 1
The chemical tanker shipping market divides fleet types into IMO 1, IMO 2, and IMO 3 based on cargo safety regulations and hazard levels. IMO 2 emerges as the largest segment, driven by its ability to transport a wide range of moderately hazardous compounds. This categorization is widely used to transport chemicals such as vegetable oils, fats, and some solvents, making it extremely adaptable to changing trade demands.
The growth of the IMO 2 segment can be attributed to growing global trade in chemicals and oils, as well as rising consumer awareness of healthy food goods like vegetable oils. Furthermore, IMO 2 tankers strike a balance between safety measures and operating costs, increasing their market dominance.
Chemical Tanker Shipping Application
- Inorganic Chemicals
- Organic Chemicals
- Liquified Gases
- Vegetable Oils & Fats
- Others
The vegetable oils & fats segment take significant share in the chemical tanker shipping market, owing to growing global demand for healthier food products and bio-based applications. Consumers' growing awareness of the benefits of nutritious and sanitary diets has greatly raised the demand for vegetable oils such as palm, soybean, and sunflower.
Furthermore, vegetable oils are widely employed in a variety of industries, including food processing, cosmetics, and biofuels, which boosts demand. The Asia-Pacific area is crucial for producing and exporting a considerable volume of vegetable oil. Chemical tankers that specialize in this sector benefit from consistent demand patterns and high cargo quantities, firmly establishing Vegetable Oils & Fats as the market's leading application.
Chemical Tanker Shipping Market Regional Outlook
North America
- U.S.
- Canada
Europe
- U.K.
- Germany
- France
- Spain
- Rest of Europe
Asia-Pacific
- India
- Japan
- China
- Australia
- South Korea
- Rest of Asia-Pacific
Latin America
- Brazil
- Mexico
- Rest of LATAM
The Middle East & Africa
- South Africa
- GCC Countries
- Rest of the Middle East & Africa (ME&A)

Chemical Tanker Shipping Market Regional Analysis
The chemical tanker shipping industry shows significant geographical dynamics, with North America emerging as the largest market and Asia-Pacific as the fastest-growing area.
The strong chemical manufacturing industry and substantial trade volumes contribute to North America's dominance. According to the BASF analysis, global chemical production (excluding pharmaceuticals) is expected to grow by 2.7% in 2024, faster than the previous year. The region is home to several chemical production hubs, most notably the United States, which is a major provider of chemicals such as petrochemicals, inorganic chemicals, and specialty chemicals. Furthermore, the extensive coastline and well-established port facilities facilitate chemical shipments, bolstering North America's market leadership. Favorable trade agreements and stable economic conditions bolster the region's position in global chemical tanker transportation.
The Asia-Pacific region is quickly expanding during the chemical tanker shipping market forecast period, driven by increased industrialization and urbanization. Countries such as China, India, and Southeast Asia are significantly expanding their chemical production capacity to meet the demands of growing populations and economies. Rising investments in the chemical and petrochemical industries, together with robust export activity, are driving the region's demand for innovative chemical transportation solutions. According to the BASR analysis, in China, the world's largest chemical market, we expect chemical production to grow at a slower rate of 4.0% this year, compared to 7.5% in 2023. Furthermore, the rising demand for vegetable oils and bio-based chemicals, which are primarily produced in Asia-Pacific, contributes to the region's growing momentum.
The combination of North America’s established market and Asia-Pacific’s rapid expansion highlights the global significance of these regions in shaping the chemical tanker shipping market.
Chemical Tanker Shipping Market Players
Some of the top chemical tanker shipping companies offered in our report includes Stolt-Nielsen, Navig8 Chemical Tankers Inc., Hafnia, Bahri, MOL Chemical Tankers Pte. Ltd., Ardmore Shipping Corporation, Team Tankers International Ltd., Tokyo Marine Asia Pte Ltd., Odfjell, and MISC Berhad.
Frequently Asked Questions
How big is the chemical tanker shipping market?
The chemical tanker shipping market size was valued at USD 36.1 billion in 2023.
What is the CAGR of the global chemical tanker shipping market from 2024 to 2032?
The CAGR of chemical tanker shipping is 4.5% during the analysis period of 2024 to 2032.
Which are the key players in the chemical tanker shipping market?
The key players operating in the global market are including Stolt-Nielsen, Navig8 Chemical Tankers Inc., Hafnia, Bahri, MOL Chemical Tankers Pte. Ltd., Ardmore Shipping Corporation, Team Tankers International Ltd., Tokyo Marine Asia Pte Ltd., Odfjell, and MISC Berhad.
Which region dominated the global chemical tanker shipping market share?
North America held the dominating position in chemical tanker shipping industry during the analysis period of 2024 to 2032.
Which region registered fastest CAGR from 2024 to 2032?
Asia-Pacific region exhibited fastest growing CAGR for market of chemical tanker shipping during the analysis period of 2024 to 2032.
What are the current trends and dynamics in the global chemical tanker shipping industry?
The current trends and dynamics in the chemical tanker shipping industry include growing demand for petrochemical products fuels the need for chemical tankers, increasing industrialization in emerging economies boosts chemical trade, and expansion of the global chemical industry supports market growth
Which fleet type held the maximum share in 2023?
The IMO 2 fleet type held the maximum share of the chemical tanker shipping industry.


