Chemical Accelerator Market | Acumen Research and Consulting
Chemical Accelerator Market Size - Global Industry, Share, Analysis, Trends and Forecast 2023 - 2032
Published :
Report ID:
Pages :
Format :
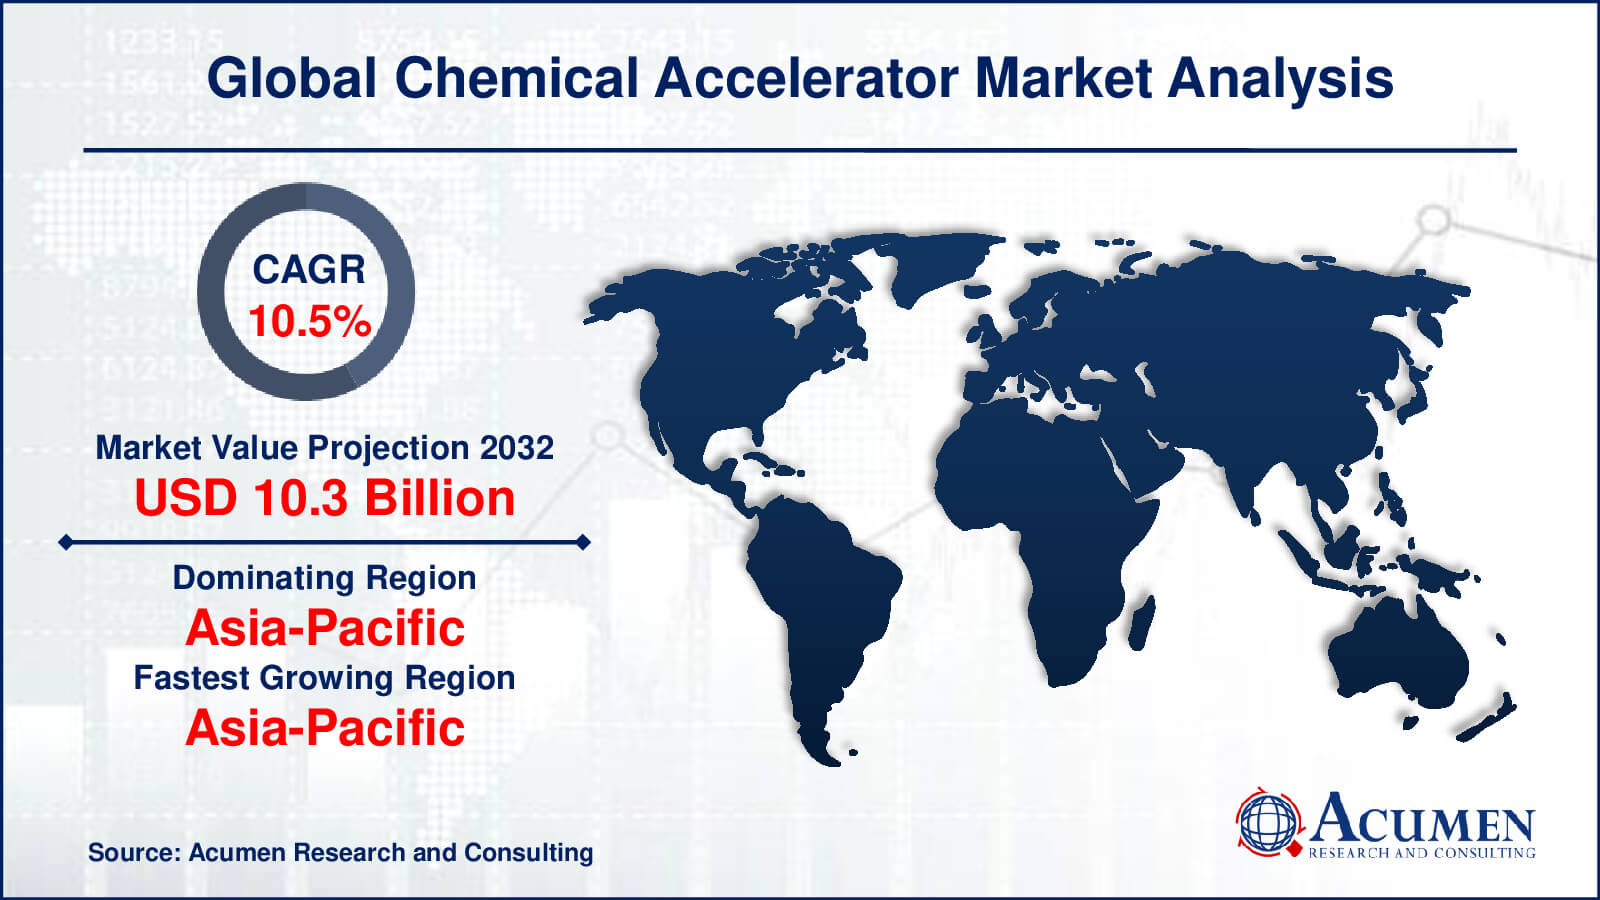
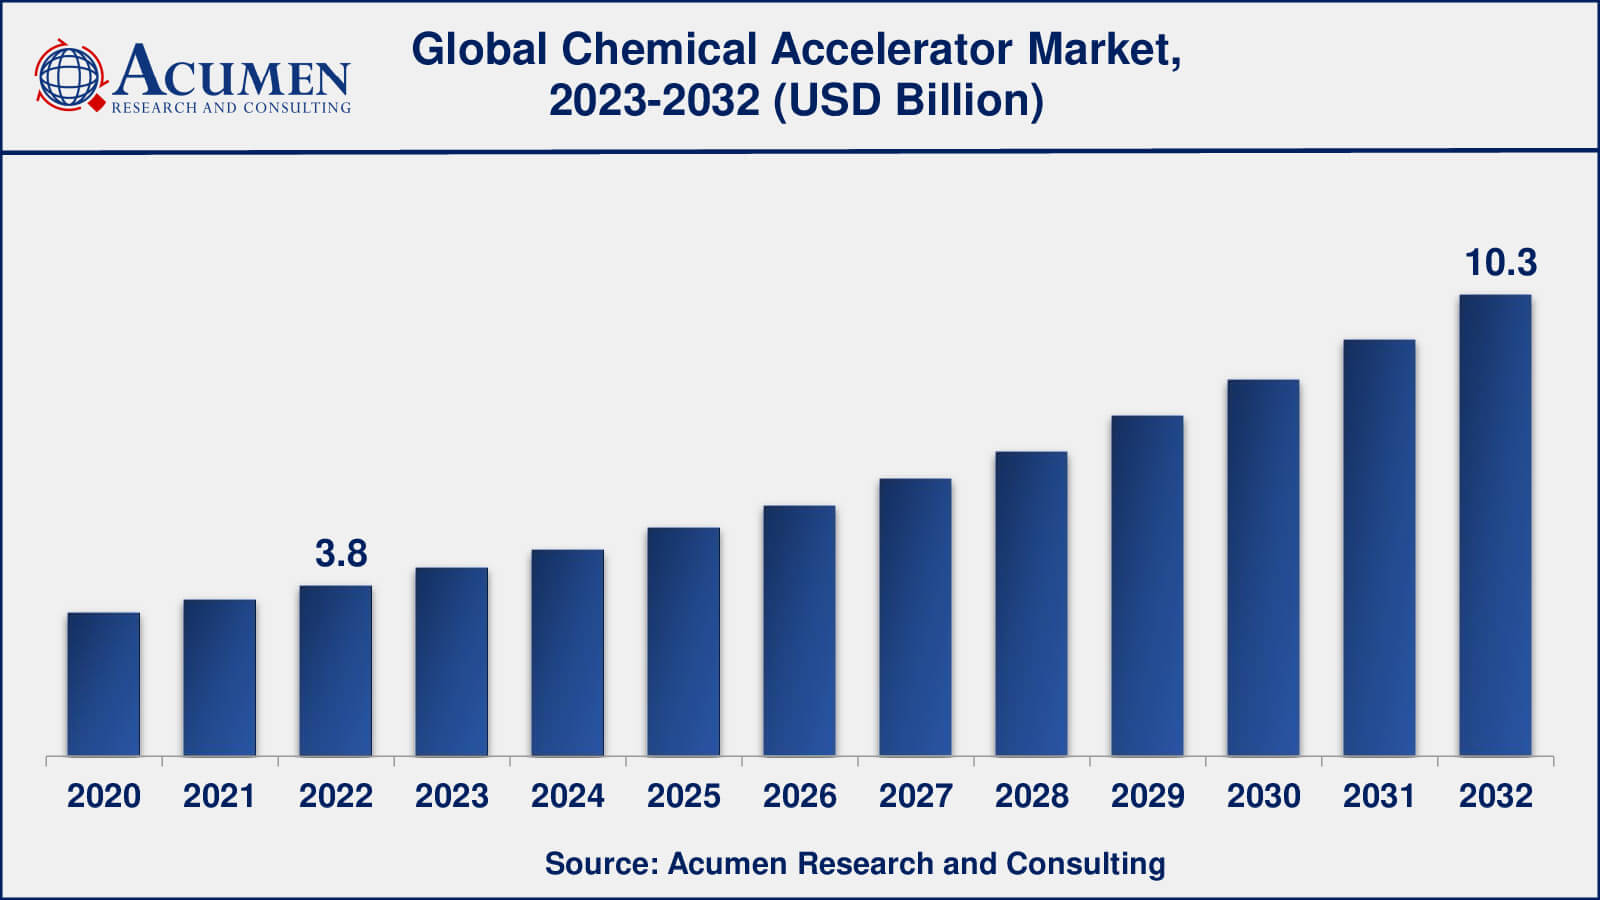
The Global Chemical Accelerator Market Size accounted for USD 3.8 Billion in 2022 and is estimated to achieve a market size of USD 10.3 Billion by 2032 growing at a CAGR of 10.5% from 2023 to 2032.
Chemical Accelerator Market Highlights
- Global chemical accelerator market revenue is poised to garner USD 10.3 billion by 2032 with a CAGR of 10.5% from 2023 to 2032
- Asia-Pacific chemical accelerator market value occupied almost USD 1.5 billion in 2022
- Asia-Pacific chemical accelerator market growth will record a CAGR of over 11% from 2023 to 2032
- Among product type, the primary accelerators sub-segment generated over US$ 2.4 billion revenue in 2022
- Based on application, the rubber manufacturing sub-segment generated around 56% share in 2022
- Increasing demand from emerging economies is a popular chemical accelerator market trend that fuels the industry demand
An accelerator is a material that once mixed with a catalyst and resin, initiates the chemical reaction between the catalyst and the resin. It is used in the polymerization of resin or vulcanization of rubbers. They are also known as promoters when used with polyester resins and vulcanizing agents when used with rubbers. The major applications of chemical accelerators are chemical production, medical, and others.
Global Chemical Accelerator Market Dynamics
Market Drivers
- Increasing demand for rubber products
- Rising investments in the construction industry
- Growing demand from the medical industry
- Government regulations
Market Restraints
- Health and environmental concerns
- Volatility in raw material prices
- Availability of substitutes
Market Opportunities
- Rising demand for eco-friendly and sustainable products
- Increasing focus on research and development
- Growing demand from the Healthcare industry
Chemical Accelerator Market Report Coverage
| Market | Chemical Accelerator Market |
| Chemical Accelerator Market Size 2022 | USD 3.8 Billion |
| Chemical Accelerator Market Forecast 2032 | USD 10.3 Billion |
| Chemical Accelerator Market CAGR During 2023 - 2032 | 10.5% |
| Chemical Accelerator Market Analysis Period | 2020 - 2032 |
| Chemical Accelerator Market Base Year | 2022 |
| Chemical Accelerator Market Forecast Data | 2023 - 2032 |
| Segments Covered | By Product Type, By Application, By End-User, And By Geography |
| Regional Scope | North America, Europe, Asia Pacific, Latin America, and Middle East & Africa |
| Key Companies Profiled | Lanxess AG, Akzonobel N.V, Emery Oleochemicals LLC, BASF SE, Arkema SA, Eastman Chemical Company, Solvay SA, R.T. Vanderbilt Company, Inc, China Petroleum & Chemical Corporation (Sinopec Corp.), and Behn Meyer Group. |
| Report Coverage |
Market Trends, Drivers, Restraints, Competitive Analysis, Player Profiling, Covid-19 Analysis, Regulation Analysis |
Chemical Accelerator Market Insights
The growing demand for the chemical, healthcare, and oil & gas industry is expected to drive the demand for the chemical accelerators market globally. In addition, the rising demand for chemical accelerators in emerging economies is expected to change the dynamics of the market in near future. However, stringent regulatory policies and volatile prices of raw materials are the restraining factors to the growth of the market.
Chemical Accelerator Market, By Segmentation
The worldwide market for chemical accelerator is split based on product type, application, end-user, and geography.
Chemical Accelerators Market, By Product Type
- Primary Accelerators
- Secondary Accelerators
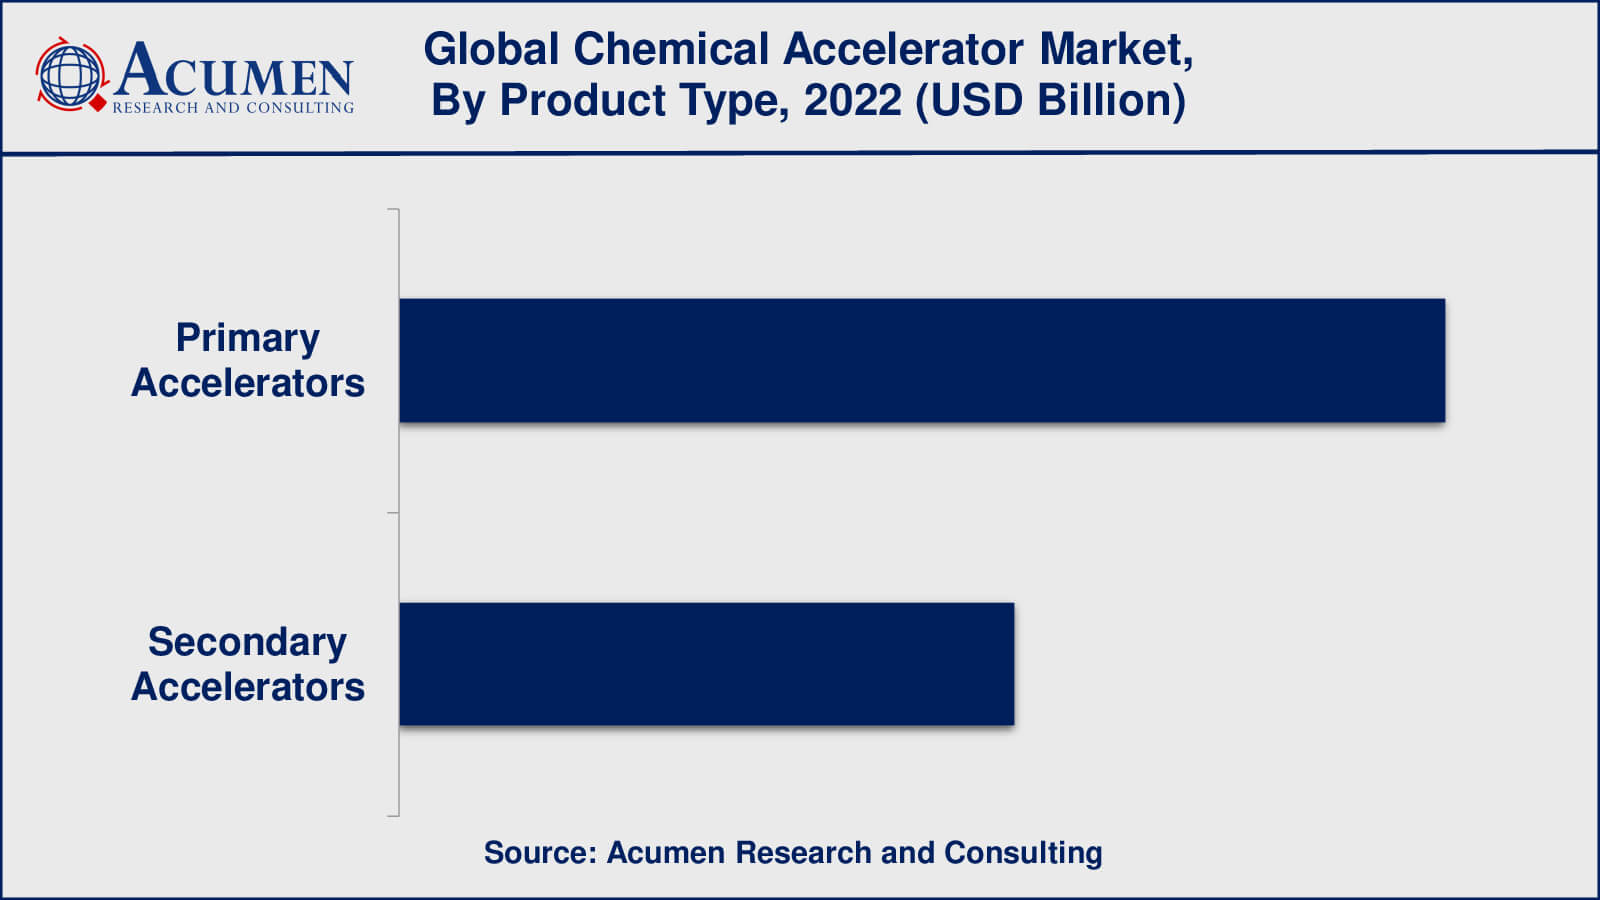
According to chemical accelerators industry analysis, the primary accelerators have dominated the chemical accelerator market in recent years. This is primarily due to their quick-acting nature and ability to reduce cure time, which aids in increasing productivity and lowering production costs. Furthermore, primary accelerators like sulfenamides and thiazoles have excellent scorch safety and processing properties, making them a popular choice in the tyre manufacturing industry. Secondary accelerators, on the other hand, increase the crosslinking density of the rubber compound and improve the mechanical properties of the final product. They are typically used in conjunction with primary accelerators to optimise the curing process and improve final product quality. Overall, the demand for primary and secondary accelerators in the chemical accelerator market is expected to increase due to rising demand for rubber products in a variety of end-use industries.
Chemical Accelerators Market, By Application
- Rubber Manufacturing
- Healthcare
- Others
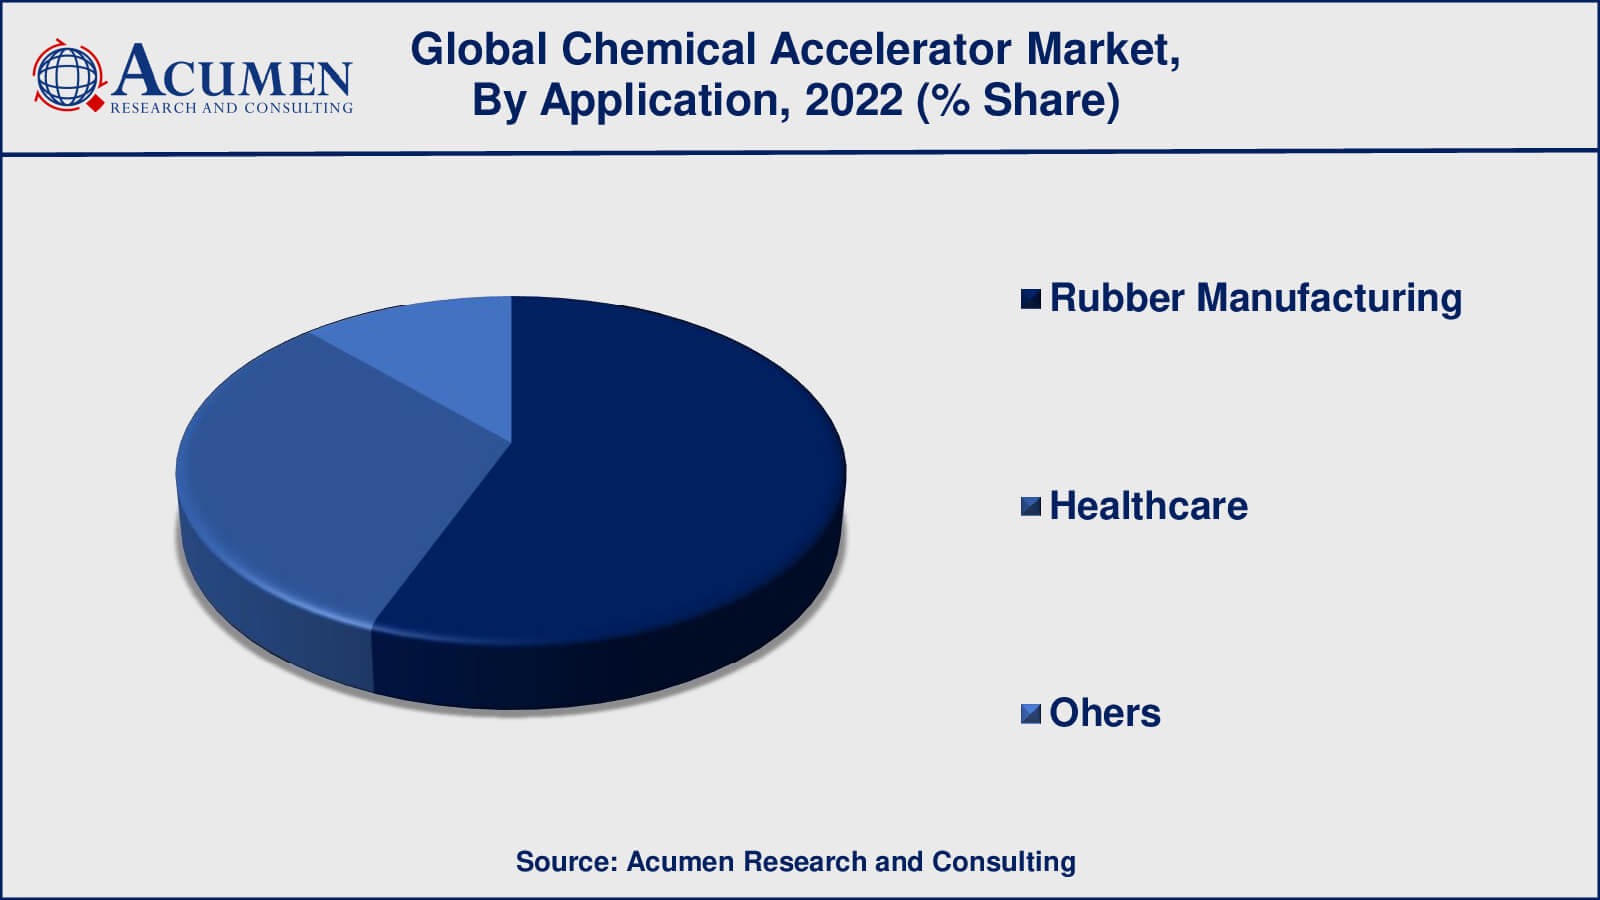
As per the chemical accelerator market forecast, the rubber manufacturing segment is believed to dominate the chemical accelerator market in terms of application. One of the major end-users of chemical accelerators is rubber manufacturing, which includes the production of tyres, automotive components, industrial products, and other rubber-based products.
However, demand for chemical accelerators in the healthcare sector is expected to grow significantly, particularly for the production of medical gloves and other rubber-based medical products. Demand for environmentally friendly and sustainable chemical accelerators is also expected to rise in the coming years, potentially opening up new market opportunities.
Other industrial applications such as adhesives, coatings, and sealants are expected to contribute to overall demand for chemical accelerators, but to a lesser extent than the rubber manufacturing and healthcare segments.
Chemical Accelerators Market, By End-User
- Automotive
- Healthcare
- Construction
- Consumer Goods
- Others
The automotive industry is a major end-user of rubber-based products such as tyres and automotive components made with chemical accelerators. Because of the growing global demand for automobiles, the demand for chemical accelerators in the automotive industry is expected to remain strong.
However, the demand for chemical accelerators in the healthcare industry is expected to rise significantly, particularly for the production of medical gloves and other rubber-based medical products. Chemical accelerators are also used extensively in the construction and consumer goods industries, though to a lesser extent than in the automotive and healthcare industries.
Chemical Accelerator Market Regional Outlook
North America
- U.S.
- Canada
Europe
- U.K.
- Germany
- France
- Spain
- Rest of Europe
Asia-Pacific
- India
- Japan
- China
- Australia
- South Korea
- Rest of Asia-Pacific
Latin America
- Brazil
- Mexico
- Rest of Latin America
The Middle East & Africa
- South Africa
- GCC Countries
- Rest of the Middle East & Africa (ME&A)
Chemical Accelerator Market Regional Analysis
The Asia-Pacific region has the largest market for chemical accelerators, with China being the world's largest consumer. The region's demand for chemical accelerators is being driven by the expansion of the automotive industry, particularly in China and India. The region is also home to some of the world's largest tire manufacturers, which adds to the demand for chemical accelerators.
The growth of the automotive industry is driving the chemical accelerator market in North America. The region is home to some of the world's largest automakers, and there is a high demand for chemical accelerators due to the increased production of tires and other rubber products. The United States is North America's largest market for chemical accelerators.
The European chemical accelerator market is expected to expand as demand from the tire and rubber industries rises. The region is home to some of the world's largest tire manufacturers, and chemical accelerators are in high demand due to the growing demand for high-performance tires. In Europe, the major markets for chemical accelerators are Germany, France, and the United Kingdom.
Chemical Accelerator Market Players
Some of the top chemical accelerator companies offered in the professional report includes Lanxess AG, Akzonobel N.V, Emery Oleochemicals LLC, BASF SE, Arkema SA, Eastman Chemical Company, Solvay SA, R.T. Vanderbilt Company, Inc, China Petroleum & Chemical Corporation (Sinopec Corp.), and Behn Meyer Group.
Frequently Asked Questions
What was the market size of the global chemical accelerator in 2022?
The market size of chemical accelerator was USD 3.8 billion in 2022.
What is the CAGR of the global chemical accelerator market from 2023 to 2032?
The CAGR of chemical accelerator is 10.5% during the analysis period of 2023 to 2032.
Which are the key players in the chemical accelerator market?
The key players operating in the global chemical accelerator market are including Lanxess AG, Akzonobel N.V, Emery Oleochemicals LLC, BASF SE, Arkema SA, Eastman Chemical Company, Solvay SA, R.T. Vanderbilt Company, Inc, China Petroleum & Chemical Corporation (Sinopec Corp.), and Behn Meyer Group.
Which region dominated the global chemical accelerator market share?
Asia-Pacific held the dominating position in chemical accelerator industry during the analysis period of 2023 to 2032.
Which region registered fastest CAGR from 2023 to 2032?
Asia-Pacific region exhibited fastest growing CAGR for market of chemical accelerator during the analysis period of 2023 to 2032.
What are the current trends and dynamics in the global chemical accelerator industry?
The current trends and dynamics in the chemical accelerator industry include increasing demand for rubber products, rising investments in the construction industry, and growing demand from the medical industry.
Which product type held the maximum share in 2022?
The primary accelerators product type held the maximum share of the chemical accelerator industry.


