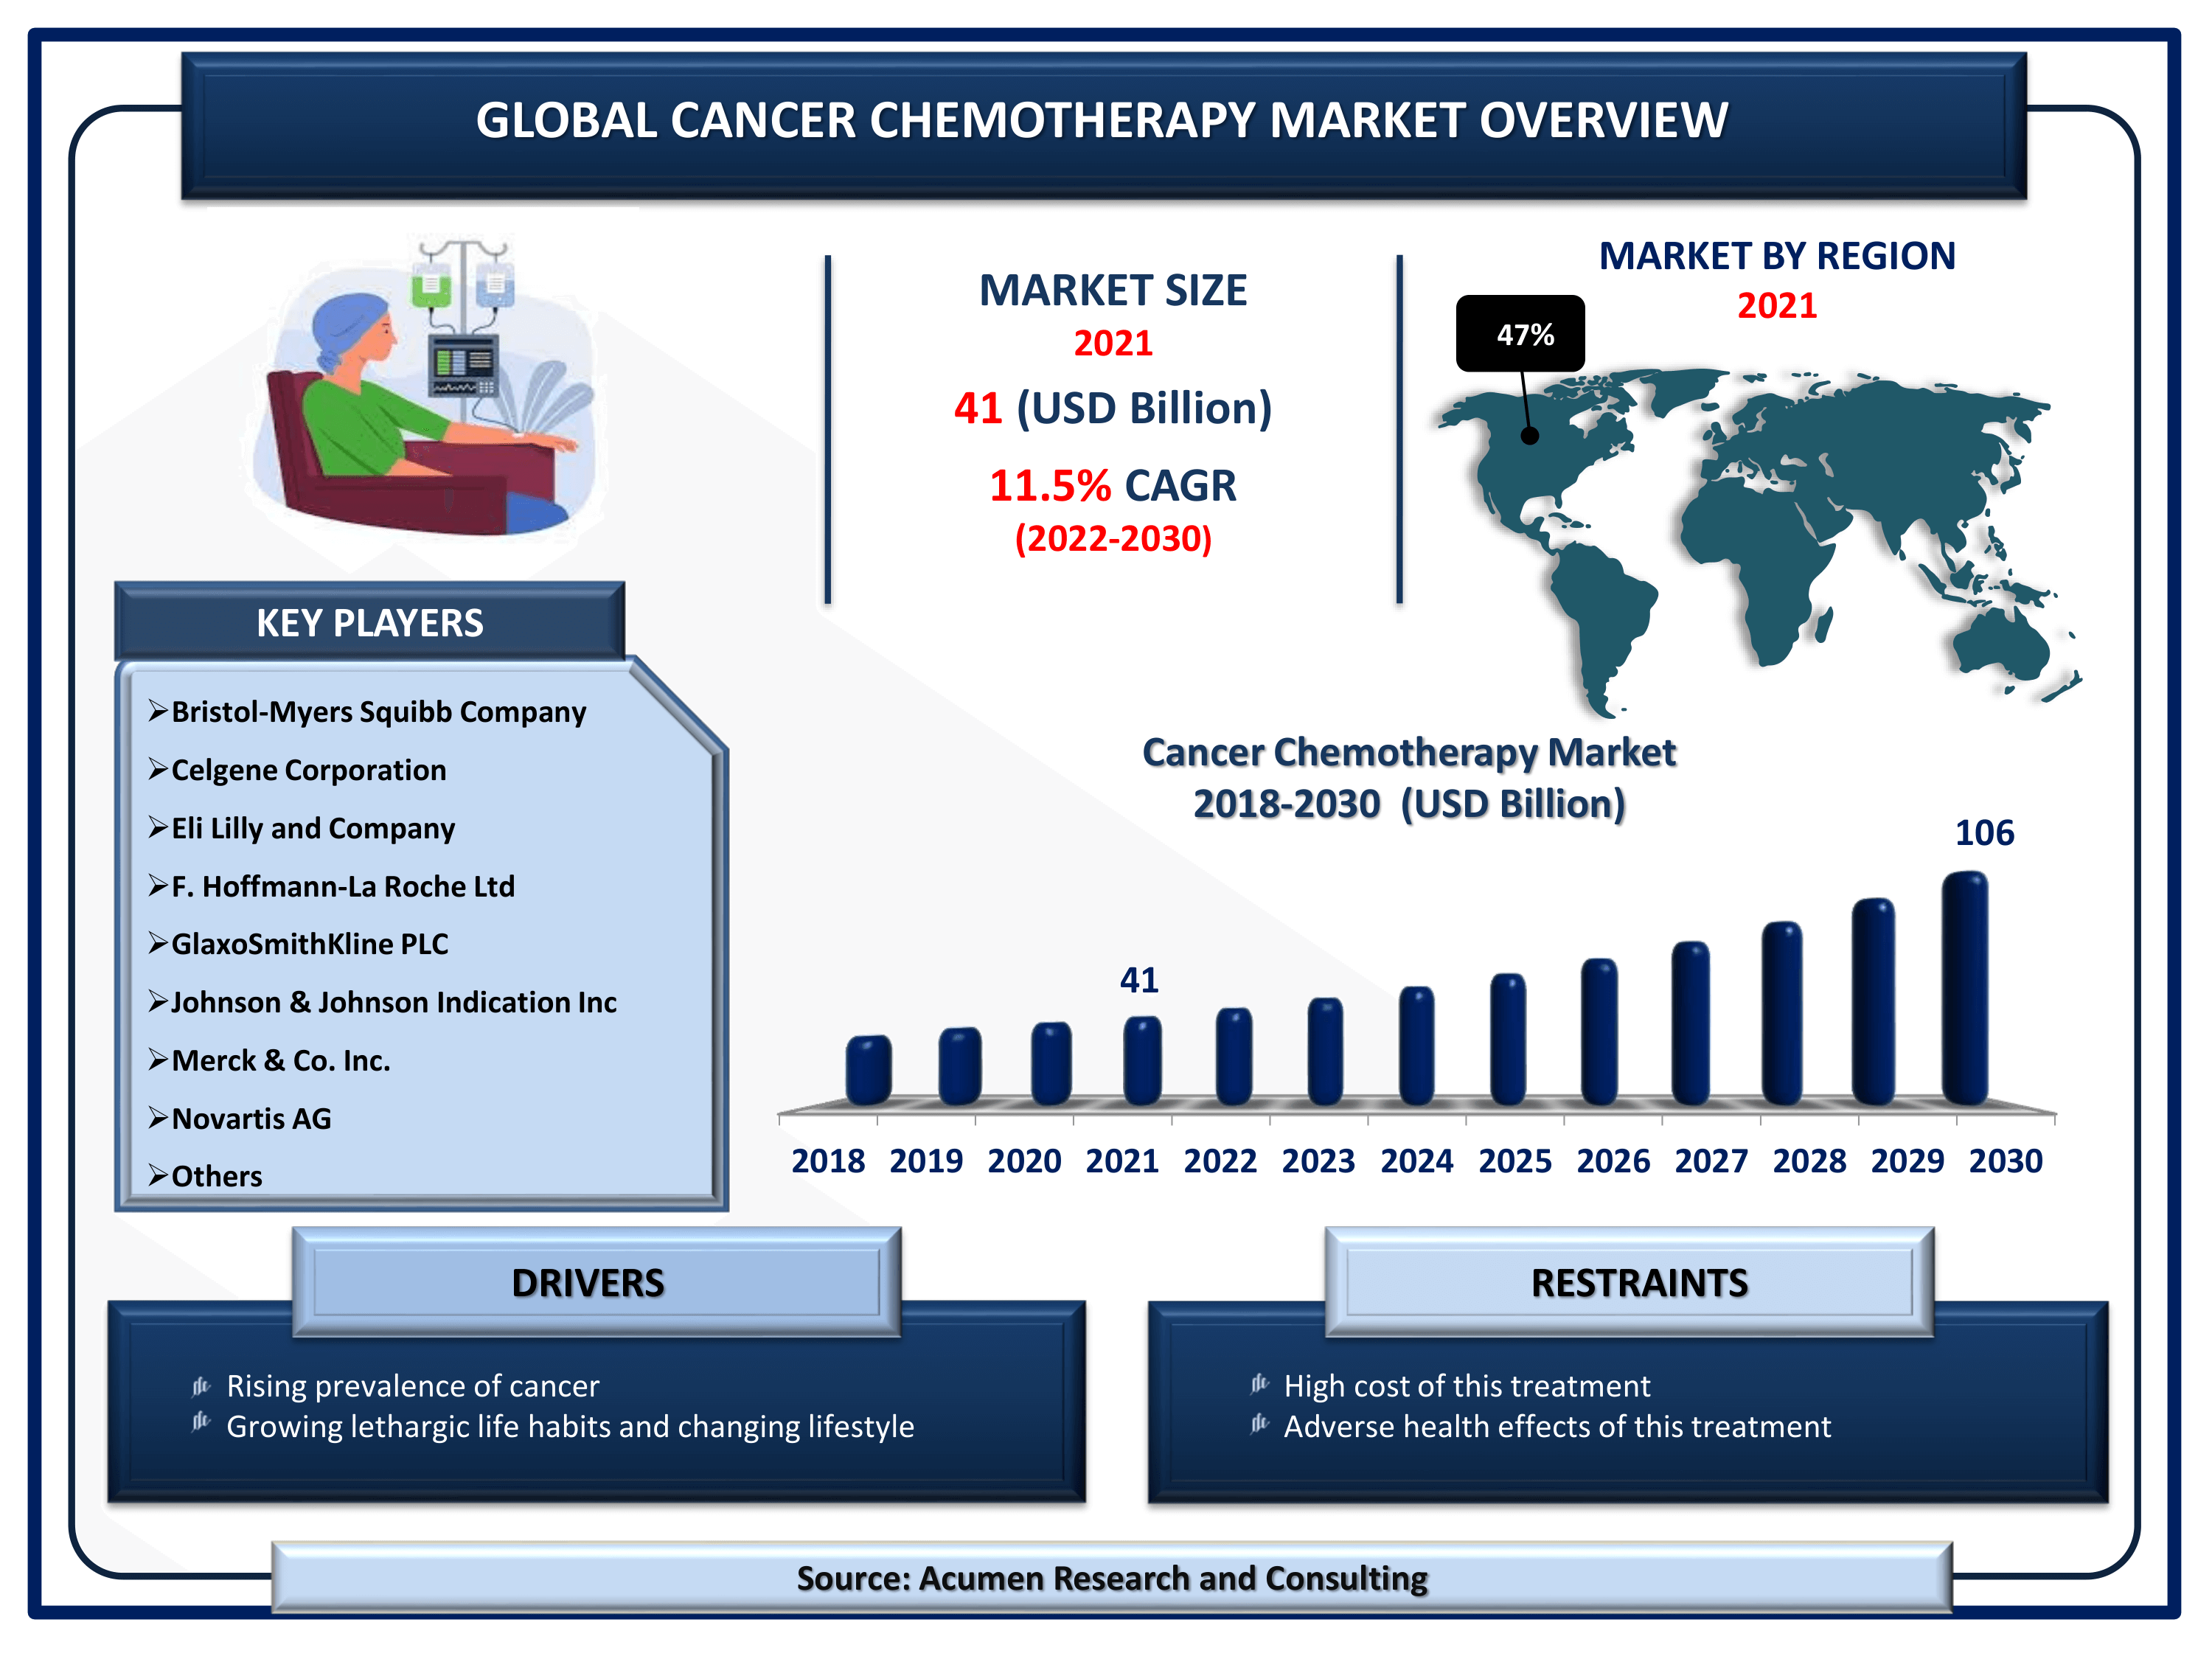
The Global Cancer Chemotherapy Market Size accounted for USD 41 Billion in 2021 and is estimated to garner a market size of USD 106 Billion by 2030 rising at a CAGR of 11.5% from 2022 to 2030. Growing incidences of cancer across the world is the leading aspect that is driving the cancer chemotherapy market share. The increasing technological advancement in the treatment of cancer is a prominent cancer chemotherapy market trend that is strengthening the industry's growth. Furthermore, robust investment in R&D activities to find new ways to treat these disorders is another factor boosting the cancer chemotherapy market value from 2022 to 2030.
Cancer Chemotherapy Market Report Key Highlights
- Global cancer chemotherapy market revenue is estimated to reach USD 106 Billion by 2030 with a CAGR of 11.5% from 2022 to 2030
- According to the World Health Organization, over 10 million people died due to cancer in 2020
- North America cancer chemotherapy market occupied over 47% regional shares in 2021
- In 2021, the United States recorded more than 1.9 million new cancer cases and 608,570 cancer deaths
- Asia-Pacific cancer chemotherapy market is likely to attain a substantial CAGR from 2022 to 2030
- Based on indication segment, breast cancer acquired more than 20% of the total market share in 2021
- Growing incidences of cancer in the world propels the cancer chemotherapy market growth in coming years
Chemotherapy refers to the drug treatment that uses powerful chemicals particularly to kill fast-growing cells inside the body. The factor is primarily making it a suitable procedure for cancer treatment, where these drugs are used alone or in combination to treat a wide variety of cancers. Additionally, these are used in various conditions like to cure cancer without other treatments or as a primary or sole treatment for cancer, for killing hidden cancer cells, and utilized to prepare for other treatments by shrinking a tumor so that other treatments, such as radiation and surgery, are possible. Additionally, it can also be used to ease the signs and symptoms of cancer by killing some of the cancer cells.
Global Cancer Chemotherapy Market Dynamics
Market Drivers
- Rising prevalence of cancer
- Growing lethargic life habits and changing lifestyle
- Increasing research & development activities
Market Restraints
- High cost of this treatment
- Adverse health effects of this treatment
Market Opportunities
- Growing expenditure on oncology
- Favorable health insurance and reimbursement policies
Cancer Chemotherapy Market Report Coverage
Market |
Cancer Chemotherapy Market |
Cancer Chemotherapy Market Size 2021 |
USD 41 Billion |
Cancer Chemotherapy Market Forecast 2030 |
USD 106 Billion |
Cancer Chemotherapy Market CAGR During 2022 - 2030 |
11.5% |
Cancer Chemotherapy Market Analysis Period |
2018 - 2030 |
Cancer Chemotherapy Market Base Year |
2021 |
Cancer Chemotherapy Market Forecast Data |
2022 - 2030 |
Segments Covered |
By Indication, By Drug Class, By Route of Administration, By End-User, And By Geography
|
Regional Scope |
North America, Europe, Asia Pacific, Latin America, and Middle East & Africa |
Key Companies Profiled |
Bristol-Myers Squibb Company, Celgene Corporation, Eli Lilly and Company, F. Hoffmann-La Roche Ltd, GlaxoSmithKline PLC, Johnson & Johnson Indication Inc, Merck & Co. Inc., Novartis AG, Pfizer Inc., and Sanofi S.A. |
Report Coverage
|
Market Trends, Drivers, Restraints, Competitive Analysis, Player Profiling, Regulation Analysis |
Cancer Chemotherapy Market Insights
The rising prevalence of cancer disease across all age demographics around the globe is the primary factor driving the chemotherapy market growth. The changing lifestyle, rapid urbanization, and unhealthy life habits are boosting the number of cancer patients across the globe. According to the National Cancer Institute (the US National Institutes of Health), an estimated 1,806,590 new cases of cancer were diagnosed in the US and 606,520 people died from the disease in 2020. The most common cancer are breast cancer, lung and bronchus cancer, prostate cancer, colon and rectum cancer, melanoma of the skin, bladder cancer, non-Hodgkin lymphoma, kidney and renal pelvis cancer, endometrial cancer, leukemia, pancreatic cancer, thyroid cancer, and liver cancer. Furthermore, the rising awareness about the treatment in developing economies, increasing expenditure on oncology medicine and research, reimbursements, and growing health insurance are further expected to create growth patterns over the forecast period.
On the other side, the high cost associated with drug development and treatment is likely to hinder the growth to an extent over the forecast period from 2022 to 2030.
Cancer Chemotherapy Market Segmentation
The worldwide cancer chemotherapy market is split based on indication, drug class, route of administration, and geography.
Cancer Chemotherapy Market By Indication
- Breast Cancer
- Lung Cancer
- Colorectal Cancer
- Prostate Cancer
- Stomach Cancer
- Lymphoma
- Leukemia
- Ovarian Cancer
- Others
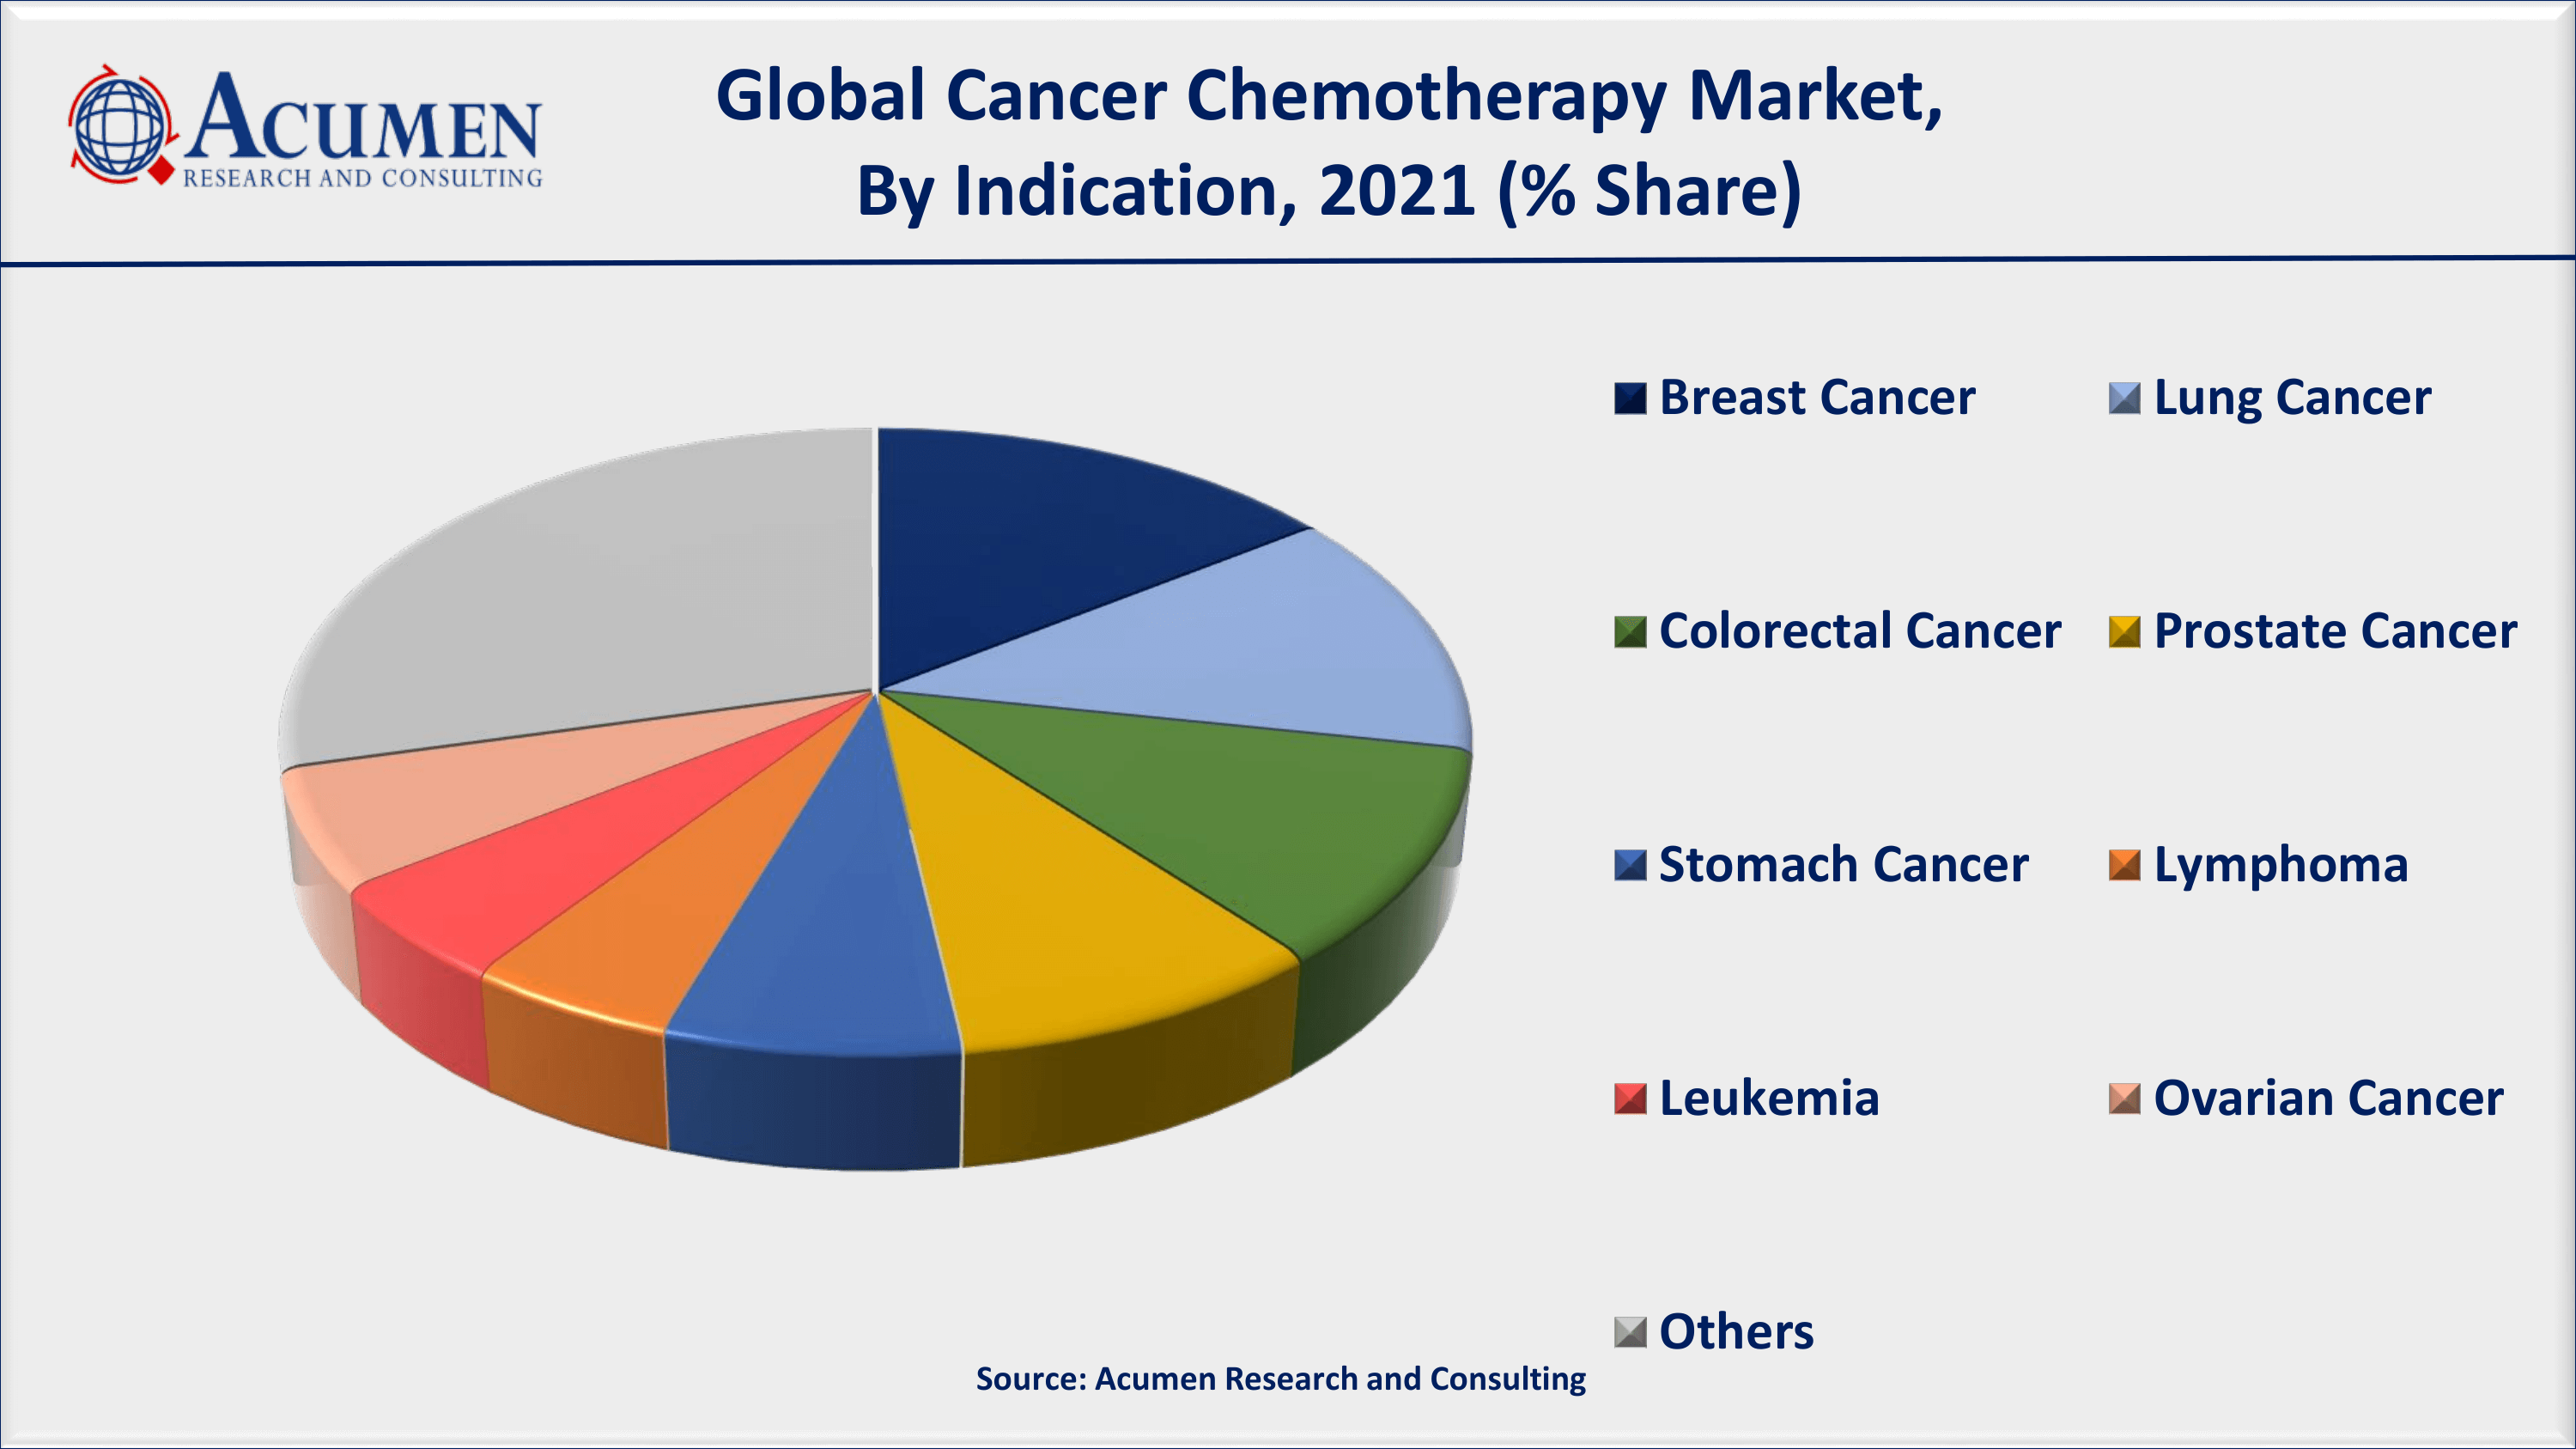
Breast cancer accounted for a significant market revenue in 2021, according to our cancer chemotherapy industry analysis. According to the WHO, there will be 2.3 million women diagnosed with breast cancer in 2020, with 685 000 deaths worldwide. As of the end of 2020, 7.8 million women had been diagnosed with breast cancer in the previous five years, making it the world's most common cancer. According to the American Cancer Society, approximately 287,850 new instances of invasive breast cancer will be diagnosed in women, with approximately 43,250 women dying from the disease.
Cancer Chemotherapy Market By Drug Class
- Alkylating Agents
- Mitotic Inhibitors
- Antimetabolites
- Topoisomerase Inhibitors
- Antitumor Antibiotic
- Others
Alkylating agents accounted for a sizable market share in 2021 and are expected to continue to do so in the coming years. Alkylating agents were the first anti-cancer prescription medications and are still among the most frequently used chemotherapy agents today. Alkylating agents cause cross-linking of DNA strands, unusual base pairing, or DNA strand breaks, preventing the cell from dividing. Alkylating agents are generally thought to be cell cycle phase nonspecific, which means they kill cells at multiple stages of the cell cycle.
Cancer Chemotherapy Market By Route of Administration
- Intravenous
- Oral
- Subcutaneous
- Intra-Muscular Intravesicular
- Topical
- Intraperitoneal
- Intraventricular/Intrathecal
- Others
According to our cancer chemotherapy market forecast, the intravenous route of administration subsegment accounted for the greatest market share from 2022 to 2030. Chemotherapy is typically administered via vein infusion (intravenously). The drugs can be administered by inserting a needle-tipped tube into a vein in patient’s arm or a device into a vein in their chest.
Cancer Chemotherapy Market By End-User
- Hospitals & Clinics
- Specialty Centers
- Others
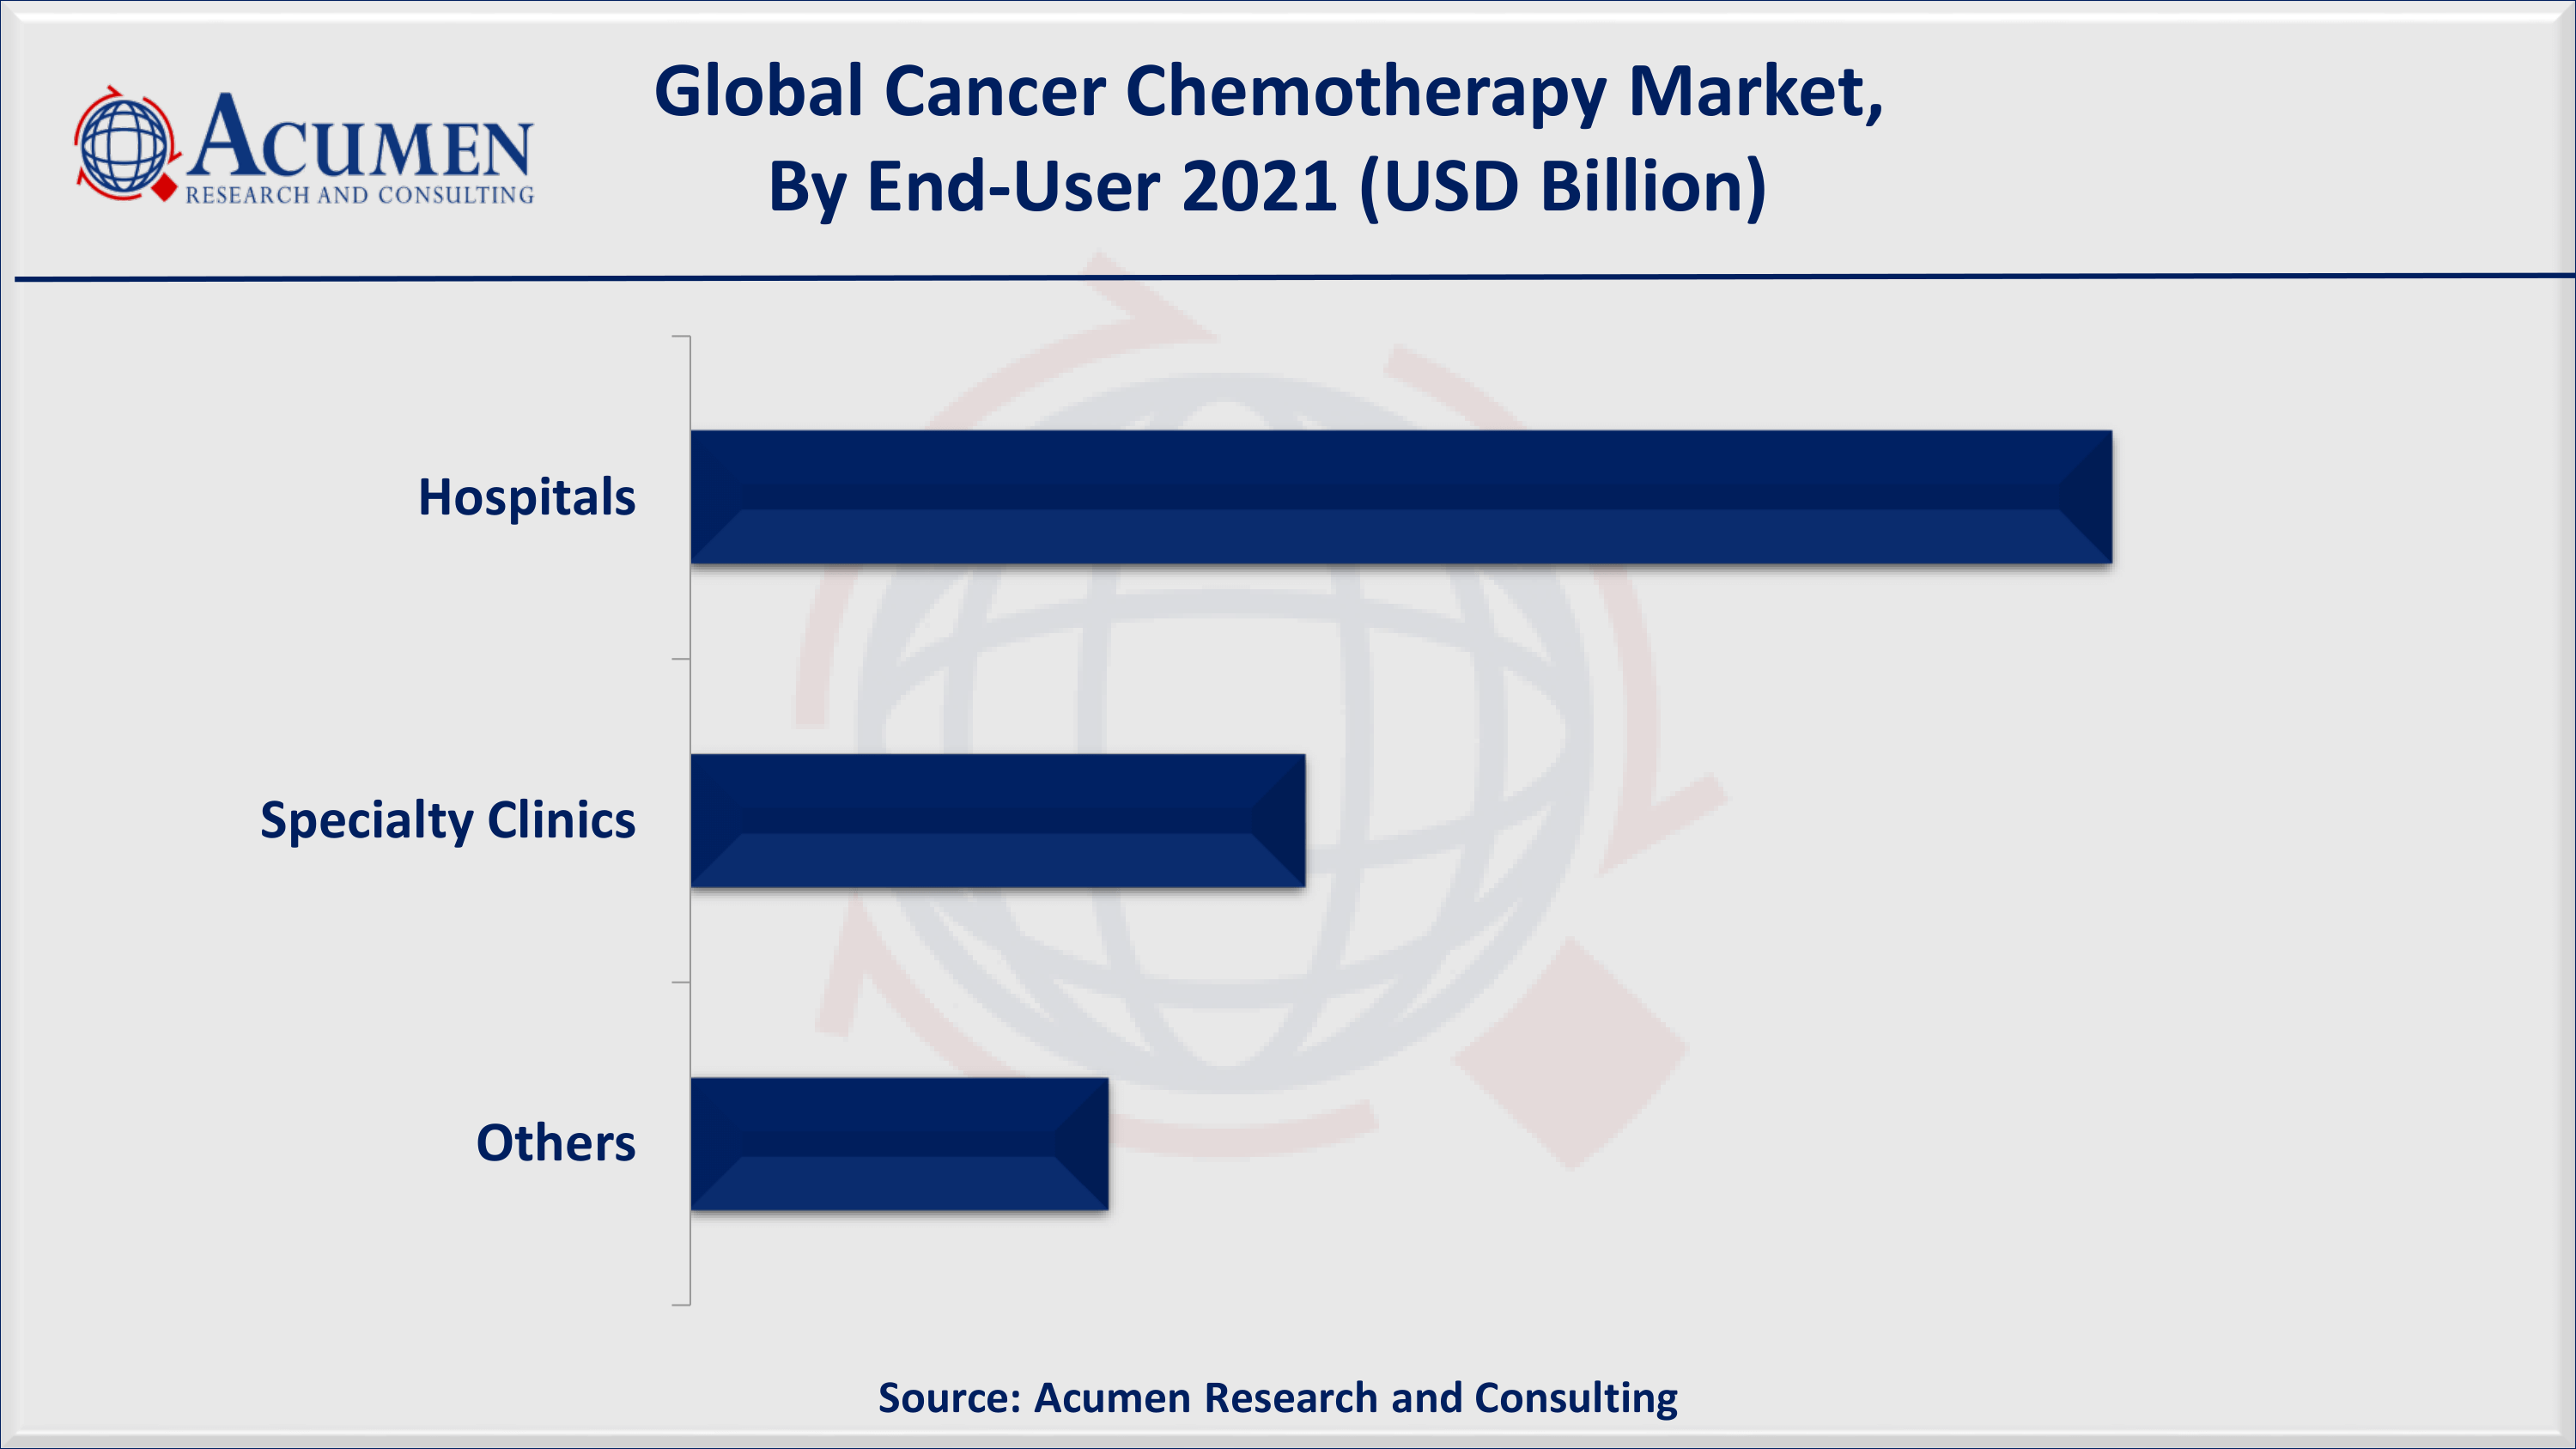
In 2021, hospitals and clinics accounted for a maximum cancer chemotherapy market share and is expected to continue its dominace during the projected timeframe. The high growth in the sub-segment is credited to the precise treatment of cancer in hospitals, presence of skilled medical professionals, existence of advanced healthcare equipment, and favorable reimbursement policies.
Cancer Chemotherapy Market Regional Outlook
North America
Europe
- U.K.
- Germany
- France
- Spain
- Rest of Europe
Latin America
- Mexico
- Brazil
- Rest of Latin America
Asia-Pacific
- India
- Japan
- China
- Australia
- South Korea
- Rest of Asia-Pacific
The Middle East & Africa (MEA)
- Gulf Cooperation Council (GCC)
- South Africa
- Rest of the Middle East & Africa
North America accounted for the maximum revenue share in the global market
In 2021, North America held the major share in terms of both revenue and the number of people treated. The region is also projected to maintain its dominance over the forecast period from 2022 to 2030. The major economy of the region US accounted for the maximum revenue share (%) in terms of revenue (US$ Bn). The rapidly increasing number of patients in the region is primarily supporting the growth. Additionally, the presence of a high-income base population which is able to spend on the treatment is further bolstering the regional market value. Moreover, the presence of technologically advanced infrastructure is further propelling the regional market value.
Asia Pacific is anticipated to experience fastest growth over the forecast timeframe from 2020 to 2027
The Asia-Pacific is anticipated to experience the fastest growth over the forecast period from 2022 to 2030 due to its advancing healthcare sector and increasing disposable income. The rapidly growing economies of the region including China and India are the major revenue contributors. The rising awareness about the treatment in the developing economies as well as the increasing spending power of people is further accelerating the market value.
Cancer Chemotherapy Market Players
The global cancer chemotherapy companies profiled in the report include Bristol-Myers Squibb Company, Celgene Corporation, Eli Lilly and Company, F. Hoffmann-La Roche Ltd, GlaxoSmithKline PLC, Johnson & Johnson Indication Inc, Merck & Co. Inc., Novartis AG, Pfizer Inc., and Sanofi S.A. among others.
CHAPTER 1. Industry Overview of Cancer Chemotherapy Market
1.1. Definition and Scope
1.1.1. Definition of Cancer Chemotherapy
1.1.2. Market Segmentation
1.1.3. Years Considered for the Study
1.1.4. Assumptions and Acronyms Used
1.1.4.1. Market Assumptions and Market Forecast
1.1.4.2. Acronyms Used in Global Cancer Chemotherapy Market
1.2. Summary
1.2.1. Executive Summary
1.2.2. Cancer Chemotherapy Market By Indication
1.2.3. Cancer Chemotherapy Market By Drug Class
1.2.4. Cancer Chemotherapy Market By Route of Administration
1.2.5. Cancer Chemotherapy Market By End-User
1.2.6. Cancer Chemotherapy Market By Region
CHAPTER 2. Research Approach
2.1. Methodology
2.1.1. Research Programs
2.1.2. Market Size Estimation
2.1.3. Market Breakdown and Data Triangulation
2.2. Data Source
2.2.1. Secondary Sources
2.2.2. Primary Sources
CHAPTER 3. Market Dynamics And Competition Analysis
3.1. Market Drivers
3.1.1. Driver 1
3.1.2. Driver 2
3.2. Restraints and Challenges
3.2.1. Restraint 1
3.2.2. Restraint 2
3.3. Growth Opportunities
3.3.1. Opportunity 1
3.3.2. Opportunity 2
3.4. Porter’s Five Forces Analysis
3.4.1. Bargaining Power of Suppliers
3.4.2. Bargaining Power of Buyers
3.4.3. Threat of Substitute
3.4.4. Threat of New Entrants
3.4.5. Degree of Competition
3.5. Market Concentration Ratio and Market Maturity Analysis of Cancer Chemotherapy Market
3.5.1. Go To Market Strategy
3.5.1.1. Introduction
3.5.1.2. Growth
3.5.1.3. Maturity
3.5.1.4. Saturation
3.5.1.5. Possible Development
3.6. Technological Roadmap for Cancer Chemotherapy Market
3.7. Value Chain Analysis
3.7.1. List of Key Manufacturers
3.7.2. List of Customers
3.7.3. Level of Integration
3.8. Regulatory Compliance
3.9. Competitive Landscape, 2021
3.9.1. Player Positioning Analysis
3.9.2. Key Strategies Adopted By Leading Players
CHAPTER 4. Cancer Chemotherapy Market By Indication
4.1. Introduction
4.2. Cancer Chemotherapy Revenue By Indication
4.2.1. Cancer Chemotherapy Revenue (USD Billion) and Forecast, By Indication, 2018-2030
4.2.2. Lung Cancer
4.2.2.1. Lung Cancer Market Revenue (USD Billion) and Growth Rate (%), 2018-2030
4.2.3. Breast Cancer
4.2.3.1. Breast Cancer Market Revenue (USD Billion) and Growth Rate (%), 2018-2030
4.2.4. Colorectal Cancer
4.2.4.1. Colorectal Cancer Market Revenue (USD Billion) and Growth Rate (%), 2018-2030
4.2.5. Prostate Cancer
4.2.5.1. Prostate Cancer Market Revenue (USD Billion) and Growth Rate (%), 2018-2030
4.2.6. Stomach Cancer
4.2.6.1. Stomach Cancer Market Revenue (USD Billion) and Growth Rate (%), 2018-2030
4.2.7. Lymphoma
4.2.7.1. Lymphoma Market Revenue (USD Billion) and Growth Rate (%), 2018-2030
4.2.8. Leukemia
4.2.8.1. Leukemia Market Revenue (USD Billion) and Growth Rate (%), 2018-2030
4.2.9. Ovarian Cancer
4.2.9.1. Ovarian Cancer Market Revenue (USD Billion) and Growth Rate (%), 2018-2030
4.2.10. Others
4.2.10.1. Others Market Revenue (USD Billion) and Growth Rate (%), 2018-2030
CHAPTER 5. Cancer Chemotherapy Market By Drug Class
5.1. Introduction
5.2. Cancer Chemotherapy Revenue By Drug Class
5.2.1. Cancer Chemotherapy Revenue (USD Billion) and Forecast, By Drug Class, 2018-2030
5.2.2. Alkylating Agents
5.2.2.1. Alkylating Agents Market Revenue (USD Billion) and Growth Rate (%), 2018-2030
5.2.3. Mitotic Inhibitors
5.2.3.1. Mitotic Inhibitors Market Revenue (USD Billion) and Growth Rate (%), 2018-2030
5.2.4. Antimetabolites
5.2.4.1. Antimetabolites Market Revenue (USD Billion) and Growth Rate (%), 2018-2030
5.2.5. Topoisomerase Inhibitors
5.2.5.1. Topoisomerase Inhibitors Market Revenue (USD Billion) and Growth Rate (%), 2018-2030
5.2.6. Antitumor Antibiotic
5.2.6.1. Antitumor Antibiotic Market Revenue (USD Billion) and Growth Rate (%), 2018-2030
5.2.7. Others
5.2.7.1. Others Market Revenue (USD Billion) and Growth Rate (%), 2018-2030
CHAPTER 6. Cancer Chemotherapy Market By Route of Administration
6.1. Introduction
6.2. Cancer Chemotherapy Revenue By Route of Administration
6.2.1. Cancer Chemotherapy Revenue (USD Billion) and Forecast, By Route of Administration, 2018-2030
6.2.2. Intravenous
6.2.2.1. Intravenous Market Revenue (USD Billion) and Growth Rate (%), 2018-2030
6.2.3. Oral
6.2.3.1. Oral Market Revenue (USD Billion) and Growth Rate (%), 2018-2030
6.2.4. Drug Stores
6.2.4.1. Drug Stores Market Revenue (USD Billion) and Growth Rate (%), 2018-2030
6.2.5. Intra-Muscular
6.2.5.1. Intra-Muscular Market Revenue (USD Billion) and Growth Rate (%), 2018-2030
6.2.6. Intravesicular
6.2.6.1. Intravesicular Market Revenue (USD Billion) and Growth Rate (%), 2018-2030
6.2.7. Topical
6.2.7.1. Topical Market Revenue (USD Billion) and Growth Rate (%), 2018-2030
6.2.8. Intraperitoneal
6.2.8.1. Intraperitoneal Market Revenue (USD Billion) and Growth Rate (%), 2018-2030
6.2.9. Intraventricular/Intrathecal
6.2.9.1. Intraventricular/Intrathecal Market Revenue (USD Billion) and Growth Rate (%), 2018-2030
6.2.10. Others
6.2.10.1. Others Market Revenue (USD Billion) and Growth Rate (%), 2018-2030
CHAPTER 7. Cancer Chemotherapy Market By End-User
7.1. Introduction
7.2. Cancer Chemotherapy Revenue By End-User
7.2.1. Cancer Chemotherapy Revenue (USD Billion) and Forecast, By End-User, 2018-2030
7.2.2. Specialty Centers
7.2.2.1. Specialty Centers Market Revenue (USD Billion) and Growth Rate (%), 2018-2030
7.2.3. Hospitals & Clinics
7.2.3.1. Hospitals & Clinics Market Revenue (USD Billion) and Growth Rate (%), 2018-2030
7.2.4. Others
7.2.4.1. Others Market Revenue (USD Billion) and Growth Rate (%), 2018-2030
CHAPTER 8. North America Cancer Chemotherapy Market By Country
8.1. North America Cancer Chemotherapy Market Overview
8.2. U.S.
8.2.1. U.S. Cancer Chemotherapy Revenue (USD Billion) and Forecast By Indication, 2018-2030
8.2.2. U.S. Cancer Chemotherapy Revenue (USD Billion) and Forecast By Drug Class, 2018-2030
8.2.3. U.S. Cancer Chemotherapy Revenue (USD Billion) and Forecast By Route of Administration, 2018-2030
8.2.4. U.S. Cancer Chemotherapy Revenue (USD Billion) and Forecast By End-User, 2018-2030
8.3. Canada
8.3.1. Canada Cancer Chemotherapy Revenue (USD Billion) and Forecast By Indication, 2018-2030
8.3.2. Canada Cancer Chemotherapy Revenue (USD Billion) and Forecast By Drug Class, 2018-2030
8.3.3. Canada Cancer Chemotherapy Revenue (USD Billion) and Forecast By Route of Administration, 2018-2030
8.3.4. Canada Cancer Chemotherapy Revenue (USD Billion) and Forecast By End-User, 2018-2030
8.4. North America PEST Analysis
CHAPTER 9. Europe Cancer Chemotherapy Market By Country
9.1. Europe Cancer Chemotherapy Market Overview
9.2. U.K.
9.2.1. U.K. Cancer Chemotherapy Revenue (USD Billion) and Forecast By Indication, 2018-2030
9.2.2. U.K. Cancer Chemotherapy Revenue (USD Billion) and Forecast By Drug Class, 2018-2030
9.2.3. U.K. Cancer Chemotherapy Revenue (USD Billion) and Forecast By Route of Administration, 2018-2030
9.2.4. U.K. Cancer Chemotherapy Revenue (USD Billion) and Forecast By End-User, 2018-2030
9.3. Germany
9.3.1. Germany Cancer Chemotherapy Revenue (USD Billion) and Forecast By Indication, 2018-2030
9.3.2. Germany Cancer Chemotherapy Revenue (USD Billion) and Forecast By Drug Class, 2018-2030
9.3.3. Germany Cancer Chemotherapy Revenue (USD Billion) and Forecast By Route of Administration, 2018-2030
9.3.4. Germany Cancer Chemotherapy Revenue (USD Billion) and Forecast By End-User, 2018-2030
9.4. France
9.4.1. France Cancer Chemotherapy Revenue (USD Billion) and Forecast By Indication, 2018-2030
9.4.2. France Cancer Chemotherapy Revenue (USD Billion) and Forecast By Drug Class, 2018-2030
9.4.3. France Cancer Chemotherapy Revenue (USD Billion) and Forecast By Route of Administration, 2018-2030
9.4.4. France Cancer Chemotherapy Revenue (USD Billion) and Forecast By End-User, 2018-2030
9.5. Spain
9.5.1. Spain Cancer Chemotherapy Revenue (USD Billion) and Forecast By Indication, 2018-2030
9.5.2. Spain Cancer Chemotherapy Revenue (USD Billion) and Forecast By Drug Class, 2018-2030
9.5.3. Spain Cancer Chemotherapy Revenue (USD Billion) and Forecast By Route of Administration, 2018-2030
9.5.4. Spain Cancer Chemotherapy Revenue (USD Billion) and Forecast By End-User, 2018-2030
9.6. Rest of Europe
9.6.1. Rest of Europe Cancer Chemotherapy Revenue (USD Billion) and Forecast By Indication, 2018-2030
9.6.2. Rest of Europe Cancer Chemotherapy Revenue (USD Billion) and Forecast By Drug Class, 2018-2030
9.6.3. Rest of Europe Cancer Chemotherapy Revenue (USD Billion) and Forecast By Route of Administration, 2018-2030
9.6.4. Rest of Europe Cancer Chemotherapy Revenue (USD Billion) and Forecast By End-User, 2018-2030
9.7. Europe PEST Analysis
CHAPTER 10. Asia Pacific Cancer Chemotherapy Market By Country
10.1. Asia Pacific Cancer Chemotherapy Market Overview
10.2. China
10.2.1. China Cancer Chemotherapy Revenue (USD Billion) and Forecast By Indication, 2018-2030
10.2.2. China Cancer Chemotherapy Revenue (USD Billion) and Forecast By Drug Class, 2018-2030
10.2.3. China Cancer Chemotherapy Revenue (USD Billion) and Forecast By Route of Administration, 2018-2030
10.2.4. China Cancer Chemotherapy Revenue (USD Billion) and Forecast By End-User, 2018-2030
10.3. Japan
10.3.1. Japan Cancer Chemotherapy Revenue (USD Billion) and Forecast By Indication, 2018-2030
10.3.2. Japan Cancer Chemotherapy Revenue (USD Billion) and Forecast By Drug Class, 2018-2030
10.3.3. Japan Cancer Chemotherapy Revenue (USD Billion) and Forecast By Route of Administration, 2018-2030
10.3.4. Japan Cancer Chemotherapy Revenue (USD Billion) and Forecast By End-User, 2018-2030
10.4. India
10.4.1. India Cancer Chemotherapy Revenue (USD Billion) and Forecast By Indication, 2018-2030
10.4.2. India Cancer Chemotherapy Revenue (USD Billion) and Forecast By Drug Class, 2018-2030
10.4.3. India Cancer Chemotherapy Revenue (USD Billion) and Forecast By Route of Administration, 2018-2030
10.4.4. India Cancer Chemotherapy Revenue (USD Billion) and Forecast By End-User, 2018-2030
10.5. Australia
10.5.1. Australia Cancer Chemotherapy Revenue (USD Billion) and Forecast By Indication, 2018-2030
10.5.2. Australia Cancer Chemotherapy Revenue (USD Billion) and Forecast By Drug Class, 2018-2030
10.5.3. Australia Cancer Chemotherapy Revenue (USD Billion) and Forecast By Route of Administration, 2018-2030
10.5.4. Australia Cancer Chemotherapy Revenue (USD Billion) and Forecast By End-User, 2018-2030
10.6. South Korea
10.6.1. South Korea Cancer Chemotherapy Revenue (USD Billion) and Forecast By Indication, 2018-2030
10.6.2. South Korea Cancer Chemotherapy Revenue (USD Billion) and Forecast By Drug Class, 2018-2030
10.6.3. South Korea Cancer Chemotherapy Revenue (USD Billion) and Forecast By Route of Administration, 2018-2030
10.6.4. South Korea Cancer Chemotherapy Revenue (USD Billion) and Forecast By End-User, 2018-2030
10.7. Rest of Asia-Pacific
10.7.1. Rest of Asia-Pacific Cancer Chemotherapy Revenue (USD Billion) and Forecast By Indication, 2018-2030
10.7.2. Rest of Asia-Pacific Cancer Chemotherapy Revenue (USD Billion) and Forecast By Drug Class, 2018-2030
10.7.3. Rest of Asia-Pacific Cancer Chemotherapy Revenue (USD Billion) and Forecast By Route of Administration, 2018-2030
10.7.4. Rest of Asia-Pacific Cancer Chemotherapy Revenue (USD Billion) and Forecast By End-User, 2018-2030
10.8. Asia Pacific PEST Analysis
CHAPTER 11. Latin America Cancer Chemotherapy Market By Country
11.1. Latin America Cancer Chemotherapy Market Overview
11.2. Brazil
11.2.1. Brazil Cancer Chemotherapy Revenue (USD Billion) and Forecast By Indication, 2018-2030
11.2.2. Brazil Cancer Chemotherapy Revenue (USD Billion) and Forecast By Drug Class, 2018-2030
11.2.3. Brazil Cancer Chemotherapy Revenue (USD Billion) and Forecast By Route of Administration, 2018-2030
11.2.4. Brazil Cancer Chemotherapy Revenue (USD Billion) and Forecast By End-User, 2018-2030
11.3. Mexico
11.3.1. Mexico Cancer Chemotherapy Revenue (USD Billion) and Forecast By Indication, 2018-2030
11.3.2. Mexico Cancer Chemotherapy Revenue (USD Billion) and Forecast By Drug Class, 2018-2030
11.3.3. Mexico Cancer Chemotherapy Revenue (USD Billion) and Forecast By Route of Administration, 2018-2030
11.3.4. Mexico Cancer Chemotherapy Revenue (USD Billion) and Forecast By End-User, 2018-2030
11.4. Rest of Latin America
11.4.1. Rest of Latin America Cancer Chemotherapy Revenue (USD Billion) and Forecast By Indication, 2018-2030
11.4.2. Rest of Latin America Cancer Chemotherapy Revenue (USD Billion) and Forecast By Drug Class, 2018-2030
11.4.3. Rest of Latin America Cancer Chemotherapy Revenue (USD Billion) and Forecast By Route of Administration, 2018-2030
11.4.4. Rest of Latin America Cancer Chemotherapy Revenue (USD Billion) and Forecast By End-User, 2018-2030
11.5. Latin America PEST Analysis
CHAPTER 12. Middle East & Africa Cancer Chemotherapy Market By Country
12.1. Middle East & Africa Cancer Chemotherapy Market Overview
12.2. GCC
12.2.1. GCC Cancer Chemotherapy Revenue (USD Billion) and Forecast By Indication, 2018-2030
12.2.2. GCC Cancer Chemotherapy Revenue (USD Billion) and Forecast By Drug Class, 2018-2030
12.2.3. GCC Cancer Chemotherapy Revenue (USD Billion) and Forecast By Route of Administration, 2018-2030
12.2.4. GCC Cancer Chemotherapy Revenue (USD Billion) and Forecast By End-User, 2018-2030
12.3. South Africa
12.3.1. South Africa Cancer Chemotherapy Revenue (USD Billion) and Forecast By Indication, 2018-2030
12.3.2. South Africa Cancer Chemotherapy Revenue (USD Billion) and Forecast By Drug Class, 2018-2030
12.3.3. South Africa Cancer Chemotherapy Revenue (USD Billion) and Forecast By Route of Administration, 2018-2030
12.3.4. South Africa Cancer Chemotherapy Revenue (USD Billion) and Forecast By End-User, 2018-2030
12.4. Rest of Middle East & Africa
12.4.1. Rest of Middle East & Africa Cancer Chemotherapy Revenue (USD Billion) and Forecast By Indication, 2018-2030
12.4.2. Rest of Middle East & Africa Cancer Chemotherapy Revenue (USD Billion) and Forecast By Drug Class, 2018-2030
12.4.3. Rest of Middle East & Africa Cancer Chemotherapy Revenue (USD Billion) and Forecast By Route of Administration, 2018-2030
12.4.4. Rest of Middle East & Africa Cancer Chemotherapy Revenue (USD Billion) and Forecast By End-User, 2018-2030
12.5. Middle East & Africa PEST Analysis
CHAPTER 13. Player Analysis Of Cancer Chemotherapy Market
13.1. Cancer Chemotherapy Market Company Share Analysis
13.2. Competition Matrix
13.2.1. Competitive Benchmarking of key players by price, presence, market share, and R&D investment
13.2.2. New Product Launches and Product Enhancements
13.2.3. Mergers And Acquisition In Global Cancer Chemotherapy Market
13.2.4. Partnership, Joint Ventures and Strategic Alliances/ Sales Agreements
CHAPTER 14. Company Profile
14.1. Bristol-Myers Squibb Company
14.1.1. Company Snapshot
14.1.2. Business Overview
14.1.3. Financial Overview
14.1.3.1. Revenue (USD Billion), 2021
14.1.3.2. Bristol-Myers Squibb Company 2021 Cancer Chemotherapy Business Regional Distribution
14.1.4. Product /Service and Specification
14.1.5. Recent Developments & Business Strategy
14.2. Celgene Corporation
14.3. Eli Lilly and Company
14.4. F. Hoffmann-La Roche Ltd
14.5. GlaxoSmithKline PLC
14.6. Johnson & Johnson Indication Inc
14.7. Merck & Co. Inc.
14.8. Novartis AG
14.9. Pfizer Inc.
14.10. Sanofi S.A