Biostimulants Market Size - Global Industry, Share, Analysis, Trends and Forecast 2023 - 2032
Published :
Report ID:
Pages :
Format :
Biostimulants Market Size - Global Industry, Share, Analysis, Trends and Forecast 2023 - 2032
Report Coverage
- Industry Dynamics
- Market Size and Forecast Data
- Segment Analysis
- Competitive Landscape
- Regional Analysis with a Niche Focus on Country-Level Data
- High Level Analysis - Porter's, PESTEL, Value Chain, etc.
- Company Profiles of Key Players
- Option to Customize the Report As Per Your Specific Need
Request Sample Report
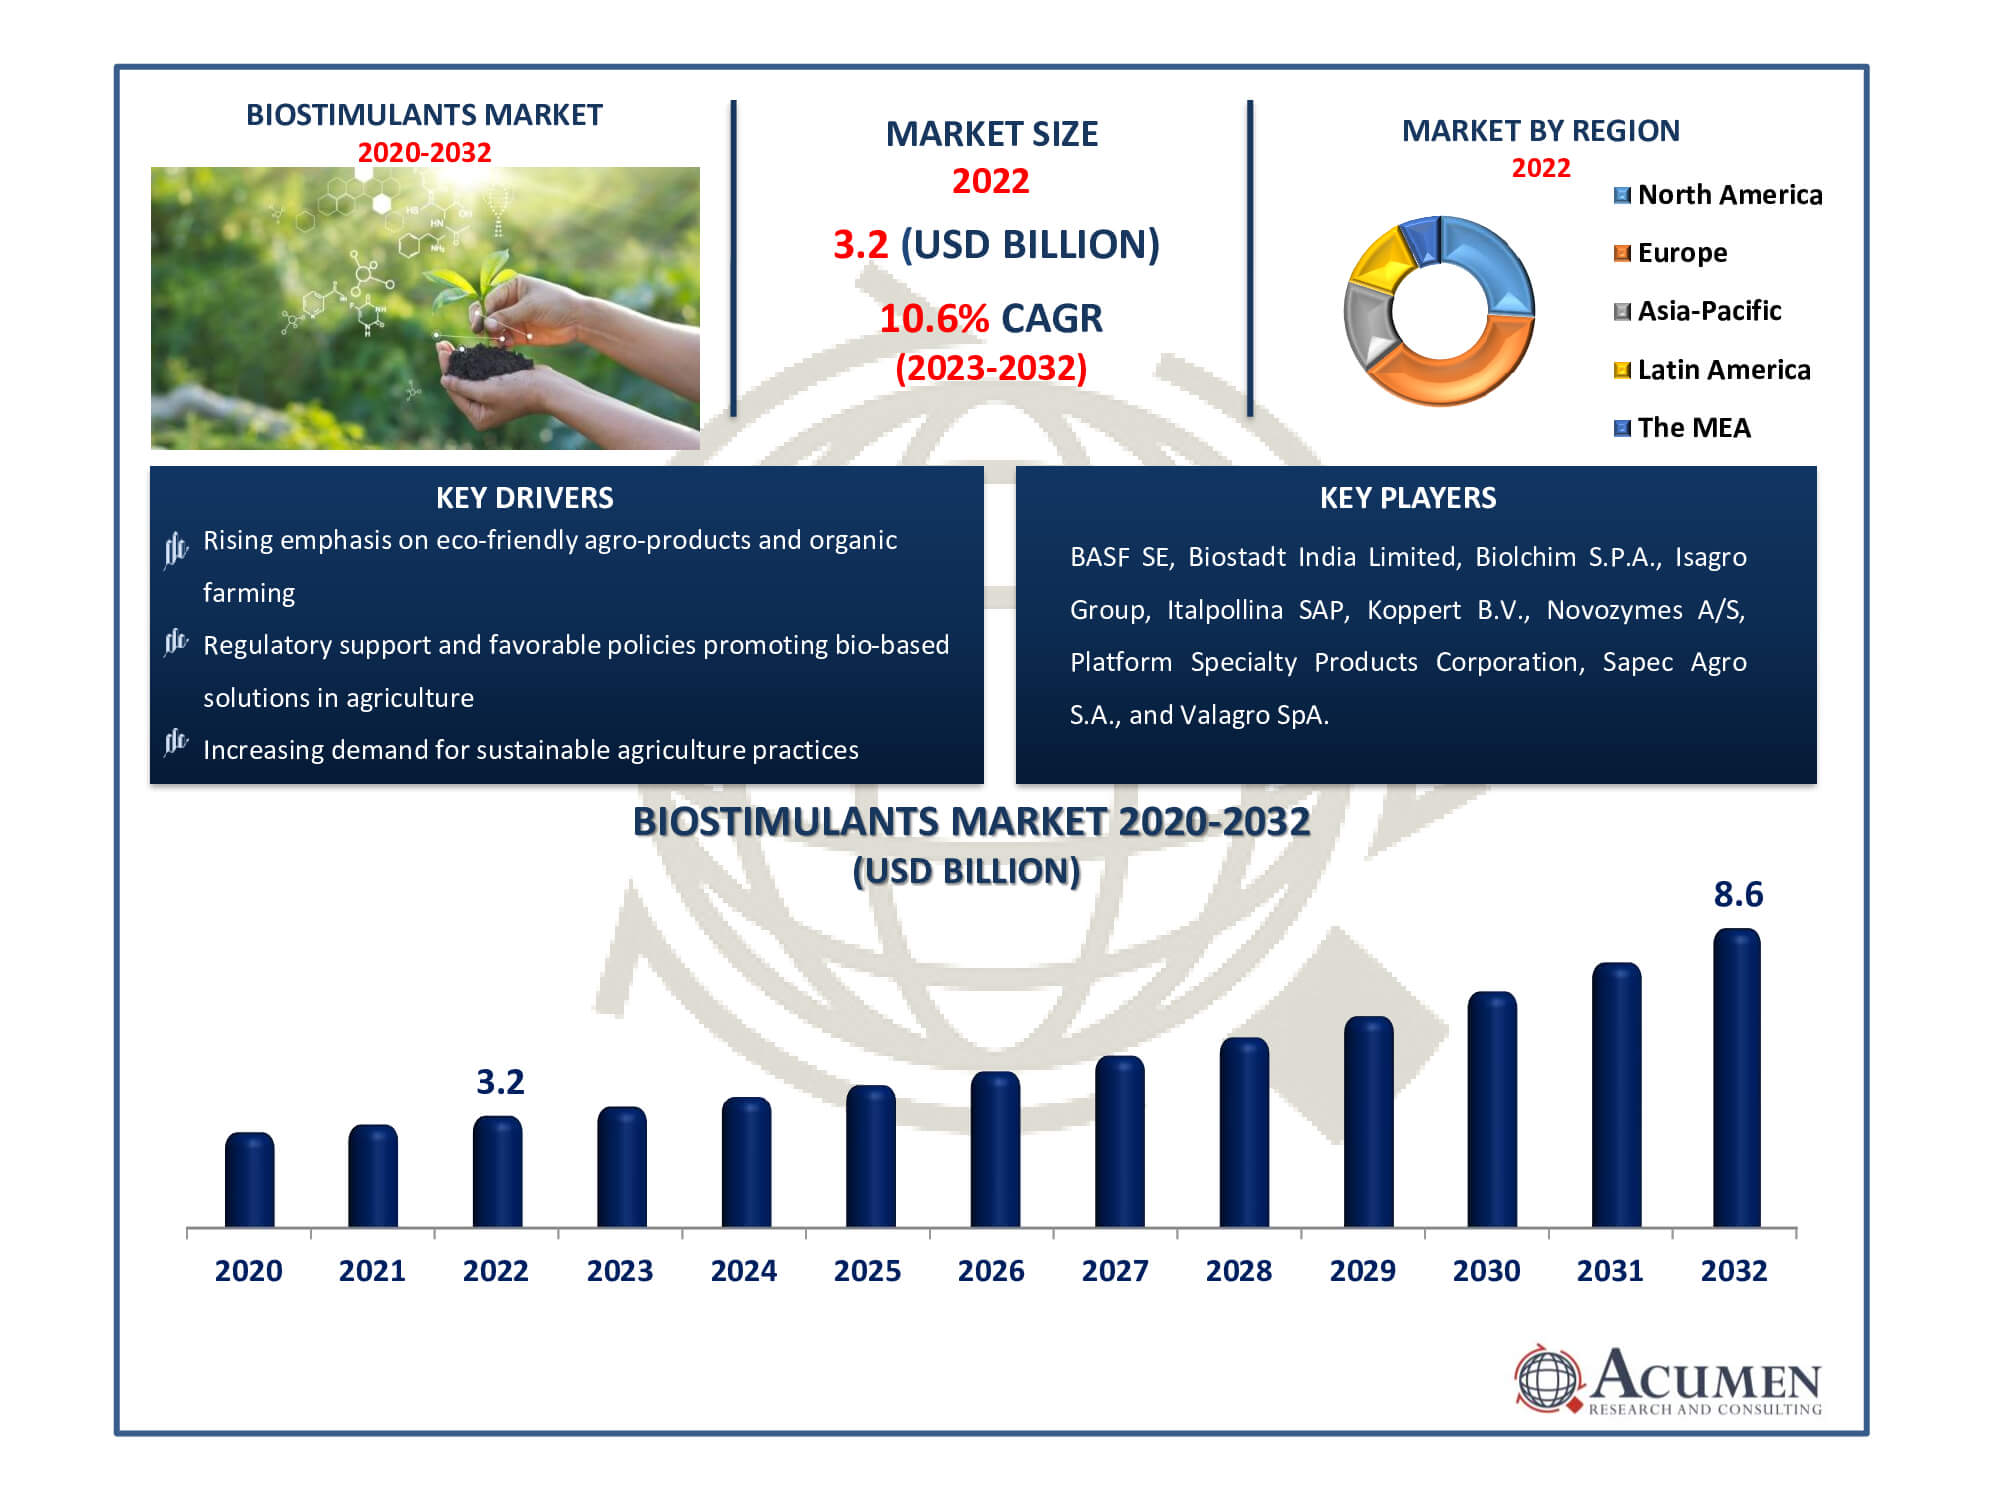
The Biostimulants Market Size accounted for USD 3.2 Billion in 2022 and is estimated to achieve a market size of USD 8.6 Billion by 2032 growing at a CAGR of 10.6% from 2023 to 2032.
Biostimulants Market Highlights
- Global biostimulants market revenue is poised to garner USD 8.6 billion by 2032 with a CAGR of 10.6% from 2023 to 2032
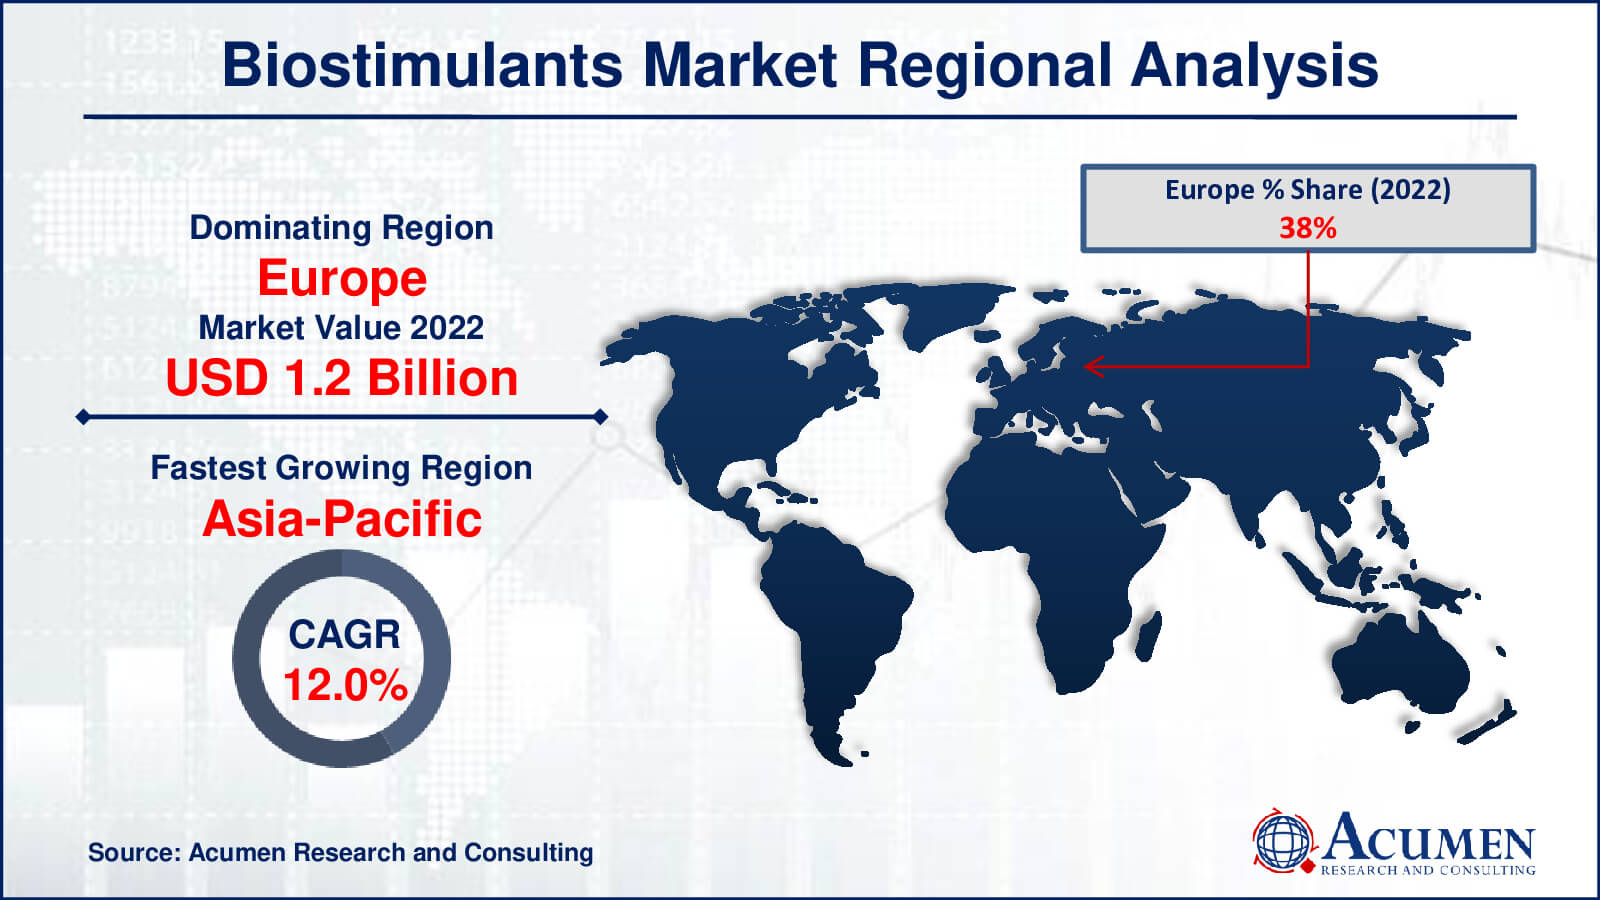
- Europe biostimulants market value occupied around USD 1.2 billion in 2022
- Asia-Pacific biostimulants market growth will record a CAGR of more than 12% from 2023 to 2032
- Among active ingredient, the seaweed extract sub-segment generated over US$ 1.1 billion revenue in 2022
- Based on application, the foliar treatment sub-segment generated around 78% share in 2022
- Expanding market for eco-friendly agricultural inputs and organic farming is a popular biostimulants market trend that fuels the industry demand

Bio-stimulants are utilized to enhance natural plant processes, aiming to improve nutrient utilization in soil, plants, seeds, and other substrates. These biological stimulants enhance crop quality, vigor, yield, and resilience to abiotic stress. Biostimulants encompass diverse formulations containing microorganisms, substances, and compounds applied to plants or soil. Throughout the plant's life cycle, from germination to maturity, biostimulants foster plant development. Unlike conventional agrochemical solutions like pesticides or fertilizers, biostimulants are not intended for use against pests or diseases. The biostimulants market has expanded dramatically as a result of greater knowledge of sustainable agricultural practices. Farmers are looking for ways to boost crop health, production, and resilience while lowering their reliance on traditional chemical inputs. Factors such as formulation technological advances and favorable regulatory support contribute to the developing panorama of biostimulants in modern agriculture.
Global Biostimulants Market Dynamics
Market Drivers
- Increasing demand for sustainable agriculture practices worldwide
- Rising emphasis on eco-friendly agro-products and organic farming methods
- Growing need to enhance crop productivity and yield in a changing climate
- Regulatory support and favorable policies promoting bio-based solutions in agriculture
Market Restraints
- Stringent regulations and approval processes for biostimulant products
- Limited awareness and understanding of biostimulant benefits among farmers
- Challenges related to standardization and formulation consistency
Market Opportunities
- Technological advancements leading to innovative biostimulant formulations
- Increasing focus on sustainable and regenerative agriculture practices
- Potential for biostimulants to address soil health and crop quality concerns
Biostimulants Market Report Coverage
| Market | Biostimulants Market |
| Biostimulants Market Size 2022 | USD 3.2 Billion |
| Biostimulants Market Forecast 2032 | USD 8.6 Billion |
| Biostimulants Market CAGR During 2023 - 2032 | 10.6% |
| Biostimulants Market Analysis Period | 2020 - 2032 |
| Biostimulants Market Base Year |
2022 |
| Biostimulants Market Forecast Data | 2023 - 2032 |
| Segments Covered | By Active Ingredient, By Crop Type, By Application, And By Geography |
| Regional Scope | North America, Europe, Asia Pacific, Latin America, and Middle East & Africa |
| Key Companies Profiled | BASF SE, Biostadt India Limited, Biolchim S.P.A., Isagro Group, Italpollina SAP, Koppert B.V., Novozymes A/S, Platform Specialty Products Corporation, Sapec Agro S.A., and Valagro SpA. |
| Report Coverage |
Market Trends, Drivers, Restraints, Competitive Analysis, Player Profiling, Covid-19 Analysis, Regulation Analysis |
Biostimulants Market Insights
The world biostimulants market is poised for substantial growth due to the rising global demand for eco-friendly agricultural products. Biostimulants serve as effective tools in developing sustainable agricultural practices. Forecasted growth in the global biostimulants market is attributed to various factors, including escalating ecological concerns linked to excessive use of synthetic pesticides, decreasing availability of arable land, increased demand for high-value agricultural crops, and a growing adoption of environmentally friendly agro-based products.
In recent years, the availability of arable land has declined, necessitating increased crop yields through the use of bio-based crop protection chemicals. Factors such as population growth and soil erosion have significantly reduced arable land. Soil degradation, stemming from extensive plowing and heightened chemical fertilizer use, has accelerated this decline. The expanding population and evolving consumption patterns are poised to escalate future food demand, further straining current arable land resources. Biostimulants offer an eco-friendly approach to enhance soil structure and nutritional value, leading to improved crop quality and yield. Consequently, the decreasing availability of arable land is anticipated to present significant opportunities for the global biostimulant market in the near future.
Biostimulants Market Segmentation
The worldwide market for biostimulants is split based on active ingredient, crop type, application, and geography.
Biostimulants Active Ingredients
- Humic Substances
- Seaweed Extract
- Microbial Amendment
- Amino Acids
- Others
The dominance of the seaweed extract subsegment in the market can be attributed to its numerous benefits for plant growth, as indicated by biostimulants industry analysis. Natural plant growth hormones, vitamins, and minerals found in seaweed extracts boost root development, increase nutrient uptake, and improve plant tolerance to stress. Their adaptability allows them to be used on a variety of crops and soil types. Furthermore, seaweed extracts include bioactive chemicals that boost plant growth regulators, resulting in higher crop yields and quality. Seaweed extracts are a preferred choice due to their proven effectiveness, eco-friendliness, and wide-ranging positive effects on plant health, driving their greatest proportion of the biostimulants market.
Biostimulants Crop Types
- Row Crops & Cereals
- Fruits & Vegetables
- Turf & Ornamentals
- Others
The leading position of the row crops & cereals subsegment within the biostimulants market is primarily a result of the widespread cultivation and high demand for essential food crops worldwide. This category encompasses crucial staples such as corn, wheat, soybeans, and rice, pivotal for both human diets and animal nutrition. Implementing biostimulants in these crops contributes significantly to enhancing root development, nutrient absorption, and stress resilience, pivotal factors for maximizing crop yields. Moreover, the extensive scale of farming and economic significance associated with row crops and cereals drive an increased integration of biostimulants in this sector. Given its pivotal role in global food production, the row crops & cereals subsegment stands as the largest share during the biostimulants market forecast period.
Biostimulants Applications
- Foliar Treatment
- Soil Treatment
- Seed Treatment
The foliar treatment segment hold the largest share in the biostimulants market because to its simple and effective application strategy. Plants quickly absorb and utilise biostimulants sprayed onto their leaves. This method is adaptable, addressing individual plant needs quickly, and correcting immediate nutritional deficits or stress. Furthermore, foliar sprays bypass soil constraints, nourishing plants directly. Foliar treatments are the favoured alternative due to their capacity to quickly provide nutrients, promote plant development, and ease stress, securing a significant portion of the biostimulants industry.
Biostimulants Market Regional Outlook
North America
- U.S.
- Canada
Europe
- U.K.
- Germany
- France
- Spain
- Rest of Europe
Asia-Pacific
- India
- Japan
- China
- Australia
- South Korea
- Rest of Asia-Pacific
Latin America
- Brazil
- Mexico
- Rest of Latin America
The Middle East & Africa
- South Africa
- GCC Countries
- Rest of the Middle East & Africa (ME&A)

Biostimulants Market Regional Analysis
Europe held the leading position in the overall market in 2022, a trend projected to persist in the biostimulants market forecast period. The region is poised for significant growth, driving profitability in the biostimulants market. The demand for biostimulants in Europe is expected to rise between 2023 and 2032, influenced by stringent regulations governing agrochemical approvals due to the harmful effects associated with chemical-based agricultural products. Additionally, the escalating demand for organic food further contributes to this growth. Germany is anticipated to lead the European biostimulants market, followed by France and Italy, during the forecast period. Fruits and vegetables are projected to emerge as significant consumers of biostimulants in Europe in the coming years.
North America is the second-largest market for biostimulants, with the Asia-Pacific area emerging as the fastest-growing sector. North America's strong position is due to its well-established agricultural industry, which is supported by large R&D investments. The region has a high rate of adoption of new agricultural methods, creating a favorable environment for the application of biostimulants. Furthermore, growing farmer knowledge of sustainable farming practices and the benefits of biostimulants have boosted market growth in North America.
The Asia-Pacific region's rapid expansion, on the other hand, is due to a variety of factors. The rising population and growing food security concerns fuel the demand for increased agricultural output. Governments in China and India are aggressively pushing sustainable agriculture practices, creating an atmosphere favorable to biostimulants uptake. Furthermore, rising disposable incomes and an expanding middle-class population in the region increase demand for high-value crops, propelling the usage of biostimulants even further.
Furthermore, the agricultural environment in Asia-Pacific is changing, with a trend towards precision farming techniques and a greater emphasis on organic and sustainable farming methods. These developments, combined with favorable government policies and a growing demand for organic goods, position the Asia-Pacific area as the fastest-growing biostimulant market.
Biostimulants Market Players
Some of the top biostimulants companies offered in our report includes BASF SE, Biostadt India Limited, Biolchim S.P.A., Isagro Group, Italpollina SAP, Koppert B.V., Novozymes A/S, Platform Specialty Products Corporation, Sapec Agro S.A., and Valagro SpA.
Frequently Asked Questions
How big was the biostimulants market?
The market size of biostimulants was USD 3.2 billion in 2022.
What is the CAGR of the global biostimulants market from 2023 to 2032?
The CAGR of biostimulants is 10.6% during the analysis period of 2023 to 2032.
Which are the key players in the biostimulants market?
The key players operating in the global market are including BASF SE, Biostadt India Limited, Biolchim S.P.A., Isagro Group, Italpollina SAP, Koppert B.V., Novozymes A/S, Platform Specialty Products Corporation, Sapec Agro S.A., and Valagro SpA.
Which region dominated the global biostimulants market share?
North America held the dominating position in biostimulants industry during the analysis period of 2023 to 2032.
Which region registered fastest CAGR from 2023 to 2032?
Asia-Pacific region exhibited fastest growing CAGR for market of biostimulants during the analysis period of 2023 to 2032.
What are the current trends and dynamics in the global biostimulants industry?
The current trends and dynamics in the biostimulants industry include increasing demand for sustainable agriculture practices worldwide, rising emphasis on eco-friendly agro-products and organic farming methods, growing need to enhance crop productivity and yield in a changing climate, and regulatory support and favorable policies promoting bio-based solutions in agriculture.
Which active ingredient held the maximum share in 2022?
The seaweed extract active ingredient held the maximum share of the biostimulants industry.


