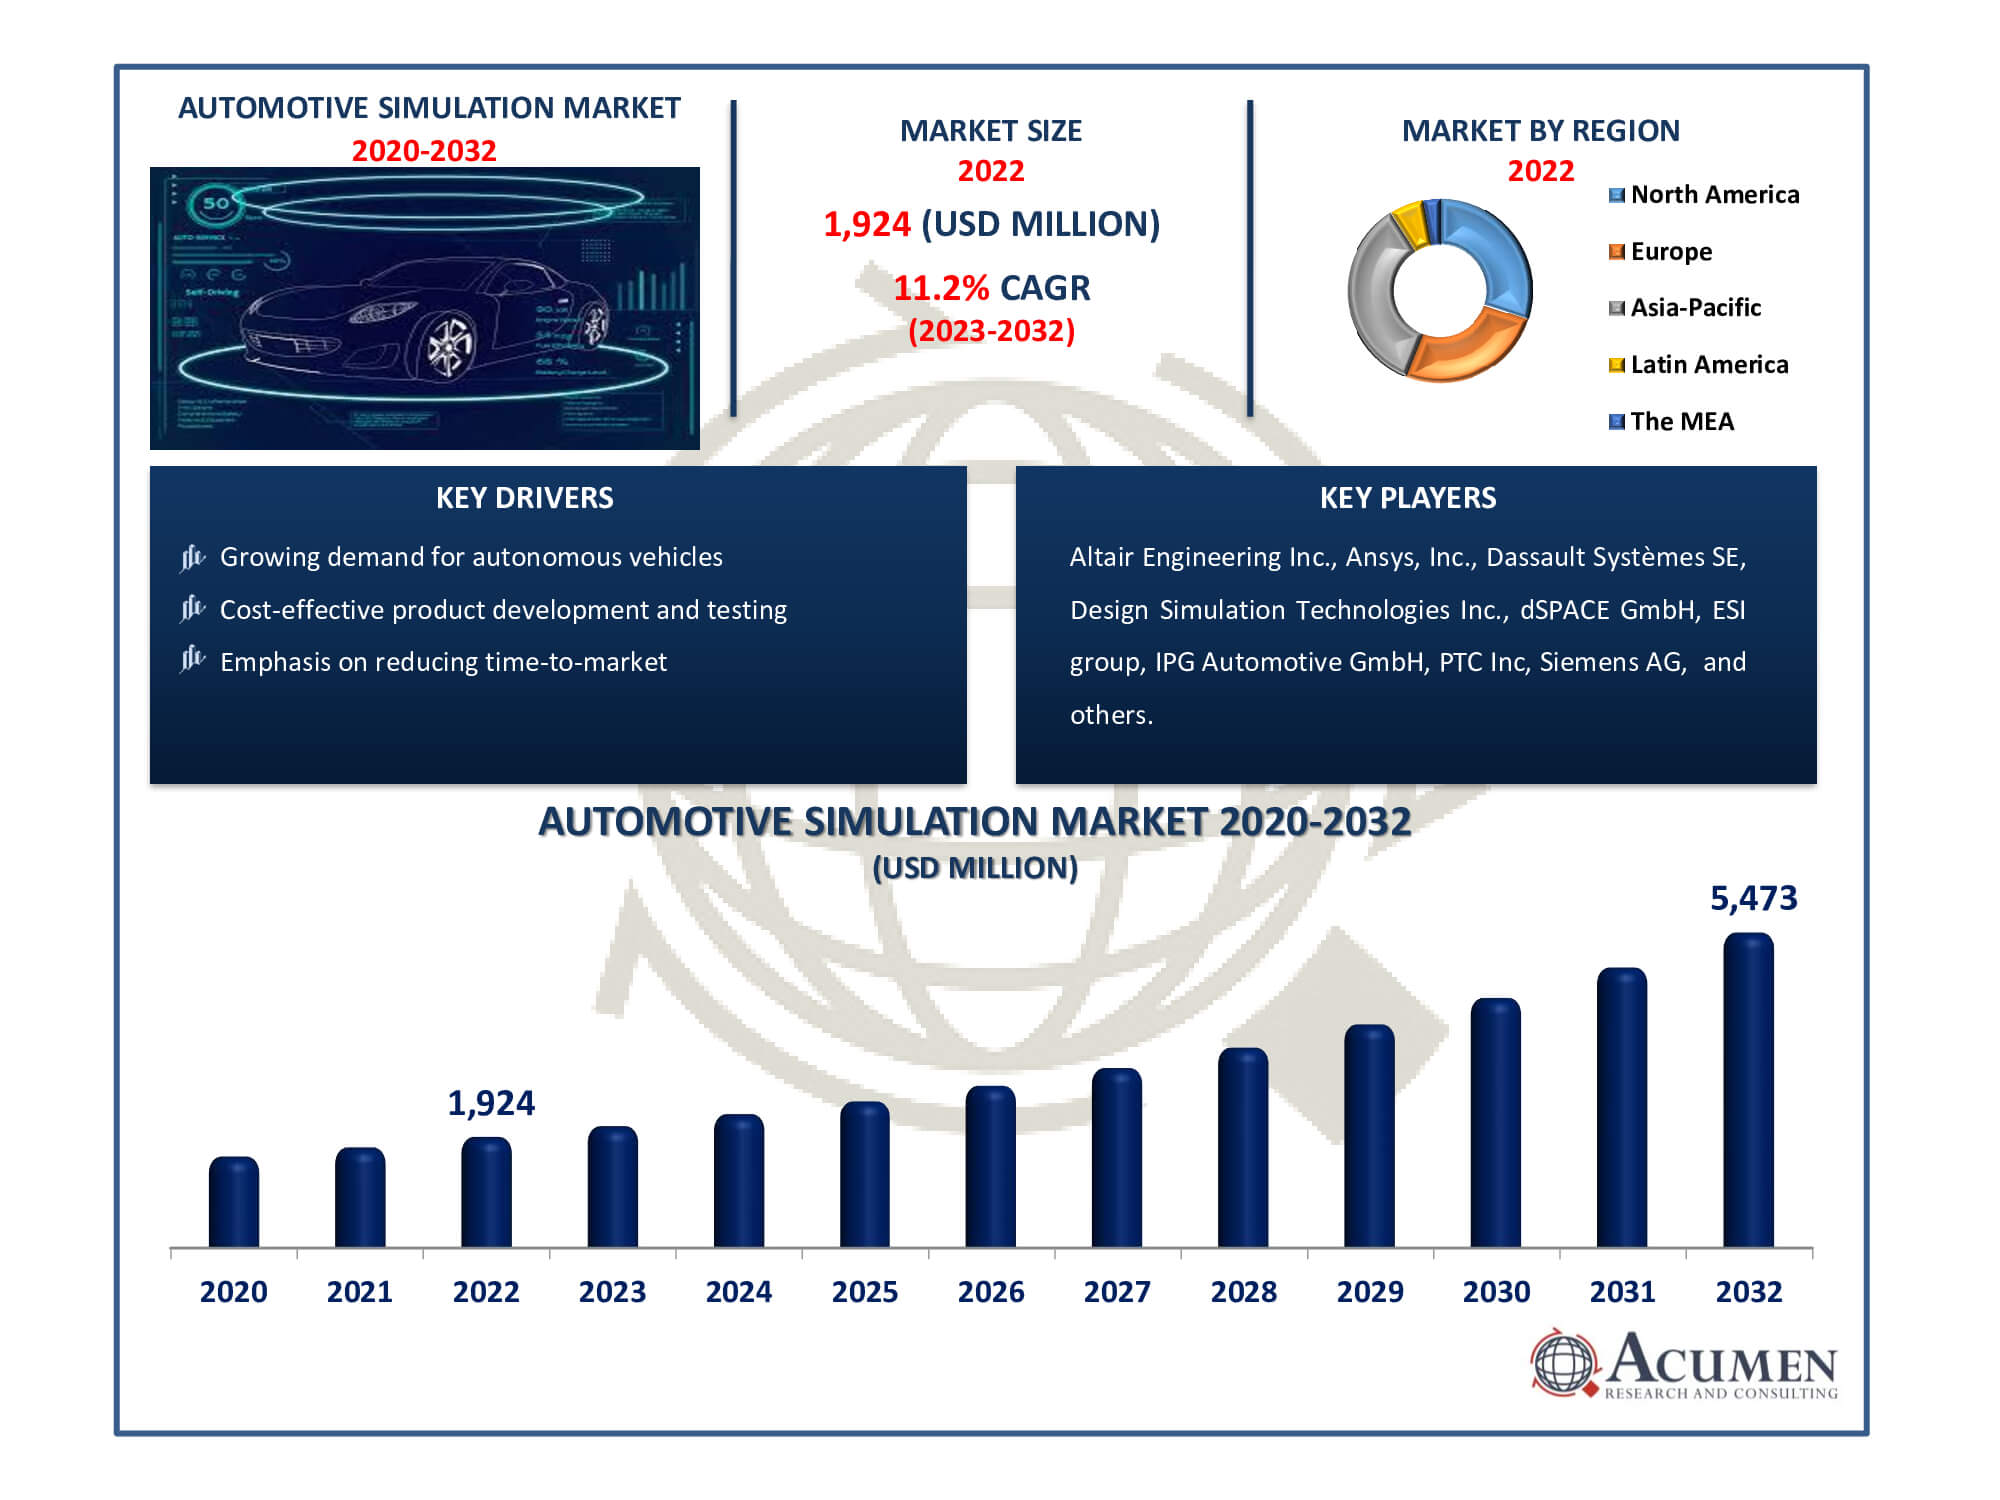
The Automotive Simulation Market Size accounted for USD 1,924 Million in 2022 and is estimated to achieve a market size of USD 5,473 Million by 2032 growing at a CAGR of 11.2% from 2023 to 2032.
Automotive Simulation Market Highlights
- The global automotive simulation market is set to achieve revenue of USD 5,473 million by 2032
- The automotive simulation market is experiencing a CAGR of 11.2% from 2023 to 2032
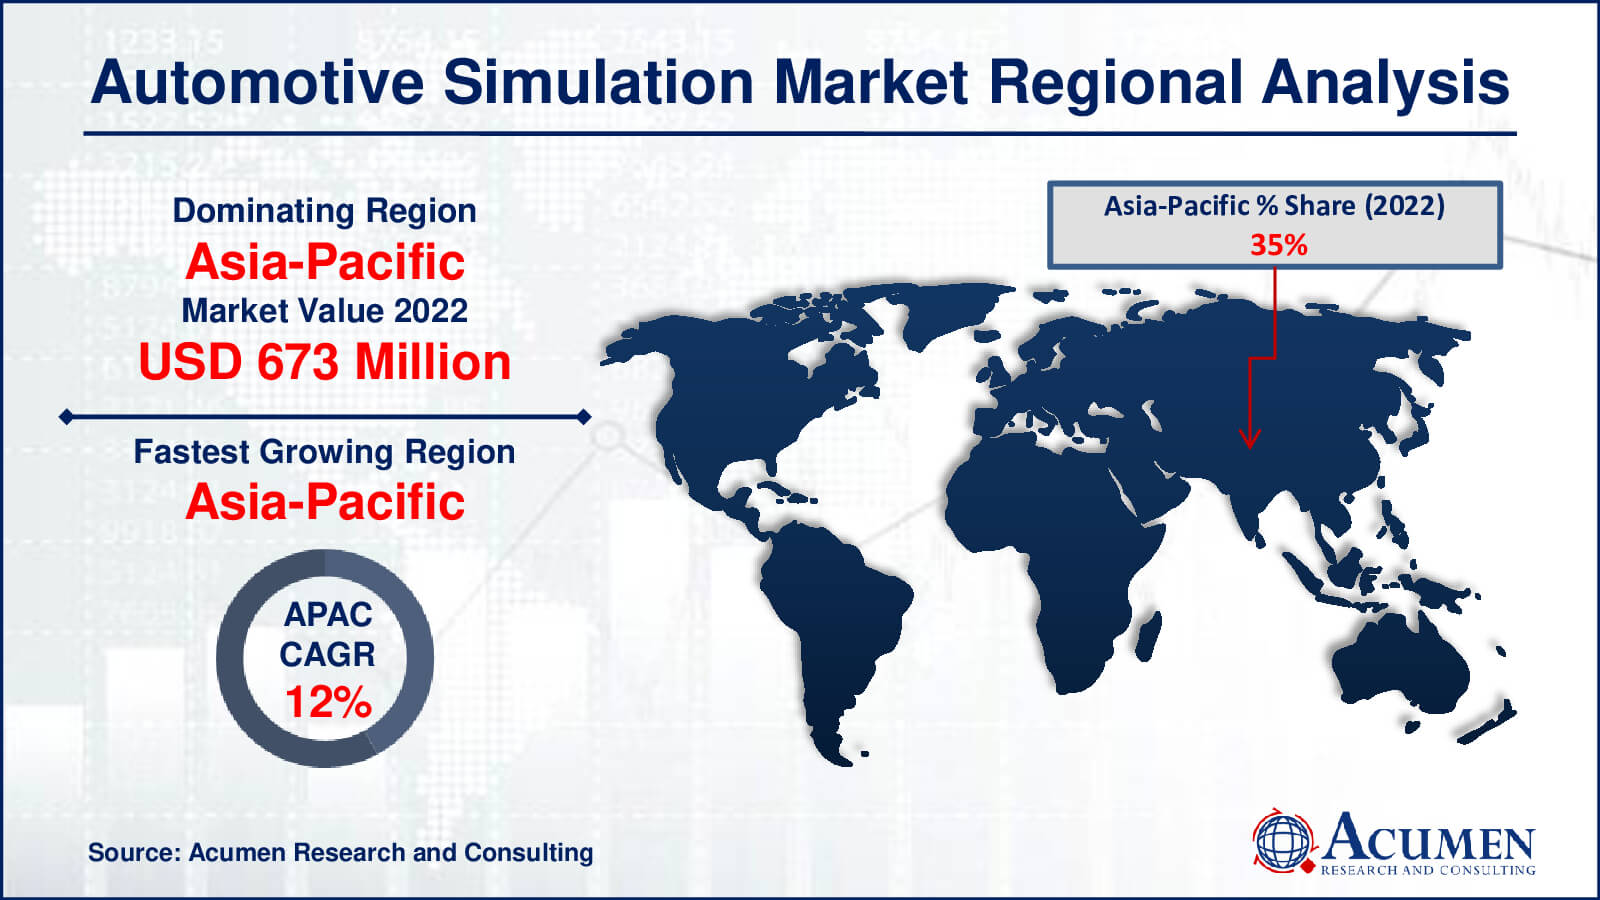
- In 2022, Asia-Pacific dominated the automotive simulation market with USD 673 million revenue
- The Asia-Pacific market is likely to witness CAGR of over 12% from 2023 to 2032
- Among component, the software sub-segment generated revenue exceeding USD 1,366 million in 2022
- In terms of sales channel, the OEMs sub-segment accounted for approximately 49% of the market share in 2022
- Simulation for smart city integration is a notable automotive simulation market trend
Automotive simulation is advanced software that simulates passenger vehicles and their components for the testing and development of driver assistance systems, vehicle dynamic controls, onboard power electronics, and engine controls. Automotive simulation replicates the characteristics of real vehicles in a virtual environment by recreating the external factors and conditions that a vehicle interacts with. It also enables individuals to learn how to drive without the risk of an accident with an actual vehicle. Additionally, it helps OEMs (Original Equipment Manufacturers) detect risks or faults in components before incorporating them into the vehicle, thus enhancing product efficiency.
Global Automotive Simulation Market Dynamics
Market Drivers
- Growing demand for autonomous vehicles
- Cost-effective product development and testing
- Emphasis on reducing time-to-market
- Safety testing without physical risks
Market Restraints
- High initial setup costs
- Limited real-world validation
- Data privacy and security concerns
Market Opportunities
- Rapid advancements in AI and machine learning
- Expansion in electric vehicle simulation
- Enhanced driver training and education
Automotive Simulation Market Report Coverage
Market |
Automotive Simulation Market
|
Automotive Simulation Market Size 2022 |
USD 1,924 Million |
Automotive Simulation Market Forecast 2032 |
USD 5,473 Million |
Automotive Simulation Market CAGR During 2023 - 2032 |
11.2% |
Automotive Simulation Market Analysis Period |
2020 - 2032 |
Base Year
|
2022 |
Forecast Data |
2023 - 2032 |
Segments Covered |
By Deployment, By Component, By Application, By Sales Channel, And By Geography
|
Regional Scope |
North America, Europe, Asia Pacific, Latin America, and Middle East & Africa |
Key Companies Profiled |
Altair Engineering Inc., Ansys, Inc., Dassault Systèmes SE, Design Simulation Technologies Inc., dSPACE GmbH, ESI group, IPG Automotive GmbH, PTC Inc, Siemens AG, SIMUL8 Corporation, Synopsys, Inc., and The MathWorks, Inc.
|
Report Coverage
|
Market Trends, Drivers, Restraints, Competitive Analysis, Player Profiling, Covid-19 Analysis, Regulation Analysis |
Automotive Simulation Market Insights
Rapid technological changes, driven by increased focus on R&D activities, are fueling market growth. Ongoing technological advancements, facilitated by the emergence of virtual platforms, are bolstering market value. The rising adoption of cloud computing, coupled with the use of automotive simulation software in governmental regulatory test centers, is also propelling market expansion. One of the key benefits of simulation software is its significant reduction of efforts for OEMs in both lab and on-road testing for new products and technologies, which further contributes to market growth. Additionally, the ongoing developments in the field of autonomous and semi-autonomous vehicles are expected to create potential opportunities throughout the forecast period from 2020 to 2027.
However, on the downside, constraints and complications related to real-time control in simulation activities, as well as the lack of established standards and regulations, are factors expected to impede market growth.
Automotive Simulation Market Segmentation
The worldwide market for automotive simulation is segmented into deployment, component, application, sales channel, and geography.
Automotive Simulation Deployments
According to the automotive simulation industry analysis, both on-premise and cloud deployments have a presence in the automotive simulation market, although cloud-based deployments were gaining traction. Cloud-based solutions were becoming more popular owing to their scalability, adaptability, and cost-effectiveness. They supported remote access and collaboration, making them ideal for complicated simulation jobs and scattered teams. However, the decision between on-premise and cloud implementation was frequently influenced by the automobile firms' individual demands and preferences. Because market trends might shift, I recommend consulting the most recent industry studies for the most up-to-date information on the dominating deployment technique in the automotive simulation market in 2022.
Automotive Simulation Components
As per the automotive simulation market forecast, software has continually prevailed as the key engine of development and innovation. The heart of the business is automotive simulation software, which powers virtual environments that simulate real-world driving circumstances and car behavior. These software solutions are critical for creating, testing, and fine-tuning many components of automotive technology, including driver assistance systems and engine controls.
Automakers and suppliers may develop and customize virtual testing scenarios with software, making it a cost-effective and time-efficient alternative to physical testing. The fast rate of technological innovation and the rising complexity of vehicles necessitate sophisticated software tools to simulate and analyse performance.
Automotive Simulation Applications
In terms of application, testing was the market leader in the automotive simulation industry. Driver assistance systems, vehicle dynamics, engine components, and safety features were all developed and validated using testing simulations. The use of simulation for testing enabled automobile firms to conduct a wide range of tests in virtual settings, eliminating the need for costly and time-consuming physical testing.
Testing simulations offered manufacturers with a low-cost and efficient way of evaluating the performance, safety, and operation of their cars and components under a variety of scenarios.
Automotive Simulation Sales Channels
- OEMs
- Component Manufacturers
- Regulatory Bodies
According to the automotive simulation market analysis, OEMs accounted for a major share of the revenue (%) in the global automotive simulation market. The rapid expansion of primary OEMs and increasing investments by major original equipment manufacturers are driving market growth. Rapid industrialization and infrastructural development are also creating opportunities for OEMs in the market. OEMs are offering advanced applications such as HMI, keyless entry, and auto-park assists, which are likely to generate demand for testing and prototyping of new automotive systems in the global automotive simulation market. These factors are expected to provide a competitive advantage to OEMs and, in turn, contribute to the overall growth of the global market.
Automotive Simulation Market Regional Outlook
North America
Europe
- U.K.
- Germany
- France
- Spain
- Rest of Europe
Asia-Pacific
- India
- Japan
- China
- Australia
- South Korea
- Rest of Asia-Pacific
Latin America
- Brazil
- Mexico
- Rest of Latin America
The Middle East & Africa
- South Africa
- GCC Countries
- Rest of the Middle East & Africa (ME&A)
Automotive Simulation Market Regional Analysis
"In 2022, Asia Pacific accounted for a significant share (%) in terms of value, and the region is expected to maintain its dominance over the forecast period from 2023 to 2032. Several factors contribute to the regional market's strong performance, including the increasing production of vehicles, growing demand for in-vehicle services connected to external cloud platforms, expansion of primary OEMs and automotive component suppliers, and changes in in-vehicle electronic architecture. Moreover, the rising sales of connected vehicles and stringent regulations promoting the use of eco-friendly vehicles in the regional market are further bolstering its value. Additionally, the region is projected to exhibit the fastest growth, with a substantial CAGR (%) throughout the forecast period from 2023 to 2032.
Automotive Simulation Market Players
Some of the top automotive simulation companies offered in our report include Altair Engineering Inc., Ansys, Inc., Dassault Systèmes SE, Design Simulation Technologies Inc., dSPACE GmbH, ESI group, IPG Automotive GmbH, PTC Inc, Siemens AG, SIMUL8 Corporation, Synopsys, Inc., and The MathWorks, Inc.
CHAPTER 1. Industry Overview of Automotive Simulation Market
1.1. Definition and Scope
1.1.1. Definition of Automotive Simulation
1.1.2. Market Segmentation
1.1.3. Years Considered for the Study
1.1.4. Assumptions and Acronyms Used
1.1.4.1. Market Assumptions and Market Forecast
1.1.4.2. Acronyms Used in Global Automotive Simulation Market
1.2. Summary
1.2.1. Executive Summary
1.2.2. Automotive Simulation Market By Deployment
1.2.3. Automotive Simulation Market By Component
1.2.4. Automotive Simulation Market By Application
1.2.5. Automotive Simulation Market By Sales Channel
1.2.6. Automotive Simulation Market By Region
CHAPTER 2. Research Approach
2.1. Methodology
2.1.1. Research Programs
2.1.2. Market Size Estimation
2.1.3. Market Breakdown and Data Triangulation
2.2. Data Source
2.2.1. Secondary Sources
2.2.2. Primary Sources
CHAPTER 3. Market Dynamics And Competition Analysis
3.1. Market Drivers
3.1.1. Driver 1
3.1.2. Driver 2
3.2. Restraints and Challenges
3.2.1. Restraint 1
3.2.2. Restraint 2
3.3. Growth Opportunities
3.3.1. Opportunity 1
3.3.2. Opportunity 2
3.4. Porter’s Five Forces Analysis
3.4.1. Bargaining Power of Suppliers
3.4.2. Bargaining Power of Buyers
3.4.3. Threat of Substitute
3.4.4. Threat of New Entrants
3.4.5. Degree of Competition
3.5. Market Concentration Ratio and Market Maturity Analysis of Automotive Simulation Market
3.5.1. Go To Market Strategy
3.5.1.1. Introduction
3.5.1.2. Growth
3.5.1.3. Maturity
3.5.1.4. Saturation
3.5.1.5. Possible Development
3.6. Technological Roadmap for Automotive Simulation Market
3.7. Value Chain Analysis
3.7.1. List of Key Manufacturers
3.7.2. List of Customers
3.7.3. Level of Integration
3.8. Cost Structure Analysis
3.8.1. Price Trend of Key Raw Materials
3.8.2. Raw Material Suppliers
3.8.3. Proportion of Manufacturing Cost Structure
3.8.3.1. Raw Material
3.8.3.2. Labor Cost
3.8.3.3. Manufacturing Expense
3.9. Regulatory Compliance
3.10. Competitive Landscape, 2022
3.10.1. Player Positioning Analysis
3.10.2. Key Strategies Adopted By Leading Players
CHAPTER 4. Manufacturing Plant Analysis
4.1. Manufacturing Plant Platform Height and Establish Date of Major Manufacturers in 2022
4.2. R&D Status of Major Manufacturers in 2022
CHAPTER 5. Automotive Simulation Market By Deployment
5.1. Introduction
5.2. Automotive Simulation Revenue By Deployment
5.2.1. Automotive Simulation Revenue (USD Million) and Forecast, By Deployment, 2020-2032
5.2.2. On-Premise
5.2.2.1. On-Premise Market Revenue (USD Million) and Growth Rate (%), 2020-2032
5.2.3. Cloud
5.2.3.1. Cloud Market Revenue (USD Million) and Growth Rate (%), 2020-2032
CHAPTER 6. Automotive Simulation Market By Component
6.1. Introduction
6.2. Automotive Simulation Revenue By Component
6.2.1. Automotive Simulation Revenue (USD Million) and Forecast, By Component, 2020-2032
6.2.2. Software
6.2.2.1. Software Market Revenue (USD Million) and Growth Rate (%), 2020-2032
6.2.3. Services
6.2.3.1. Services Market Revenue (USD Million) and Growth Rate (%), 2020-2032
CHAPTER 7. Automotive Simulation Market By Application
7.1. Introduction
7.2. Automotive Simulation Revenue By Application
7.2.1. Automotive Simulation Revenue (USD Million) and Forecast, By Application, 2020-2032
7.2.2. Prototyping
7.2.2.1. Prototyping Market Revenue (USD Million) and Growth Rate (%), 2020-2032
7.2.3. Testing
7.2.3.1. Testing Market Revenue (USD Million) and Growth Rate (%), 2020-2032
CHAPTER 8. Automotive Simulation Market By Sales Channel
8.1. Introduction
8.2. Automotive Simulation Revenue By Sales Channel
8.2.1. Automotive Simulation Revenue (USD Million) and Forecast, By Sales Channel, 2020-2032
8.2.2. OEMs
8.2.2.1. OEMs Market Revenue (USD Million) and Growth Rate (%), 2020-2032
8.2.3. Component Manufacturers
8.2.3.1. Component Manufacturers Market Revenue (USD Million) and Growth Rate (%), 2020-2032
8.2.4. Regulatory Bodies
8.2.4.1. Regulatory Bodies Market Revenue (USD Million) and Growth Rate (%), 2020-2032
CHAPTER 9. North America Automotive Simulation Market By Country
9.1. North America Automotive Simulation Market Overview
9.2. U.S.
9.2.1. U.S. Automotive Simulation Revenue (USD Million) and Forecast By Deployment, 2020-2032
9.2.2. U.S. Automotive Simulation Revenue (USD Million) and Forecast By Component, 2020-2032
9.2.3. U.S. Automotive Simulation Revenue (USD Million) and Forecast By Application, 2020-2032
9.2.4. U.S. Automotive Simulation Revenue (USD Million) and Forecast By Sales Channel, 2020-2032
9.3. Canada
9.3.1. Canada Automotive Simulation Revenue (USD Million) and Forecast By Deployment, 2020-2032
9.3.2. Canada Automotive Simulation Revenue (USD Million) and Forecast By Component, 2020-2032
9.3.3. Canada Automotive Simulation Revenue (USD Million) and Forecast By Application, 2020-2032
9.3.4. Canada Automotive Simulation Revenue (USD Million) and Forecast By Sales Channel, 2020-2032
9.4. North America PEST Analysis
CHAPTER 10. Europe Automotive Simulation Market By Country
10.1. Europe Automotive Simulation Market Overview
10.2. U.K.
10.2.1. U.K. Automotive Simulation Revenue (USD Million) and Forecast By Deployment, 2020-2032
10.2.2. U.K. Automotive Simulation Revenue (USD Million) and Forecast By Component, 2020-2032
10.2.3. U.K. Automotive Simulation Revenue (USD Million) and Forecast By Application, 2020-2032
10.2.4. U.K. Automotive Simulation Revenue (USD Million) and Forecast By Sales Channel, 2020-2032
10.3. Germany
10.3.1. Germany Automotive Simulation Revenue (USD Million) and Forecast By Deployment, 2020-2032
10.3.2. Germany Automotive Simulation Revenue (USD Million) and Forecast By Component, 2020-2032
10.3.3. Germany Automotive Simulation Revenue (USD Million) and Forecast By Application, 2020-2032
10.3.4. Germany Automotive Simulation Revenue (USD Million) and Forecast By Sales Channel, 2020-2032
10.4. France
10.4.1. France Automotive Simulation Revenue (USD Million) and Forecast By Deployment, 2020-2032
10.4.2. France Automotive Simulation Revenue (USD Million) and Forecast By Component, 2020-2032
10.4.3. France Automotive Simulation Revenue (USD Million) and Forecast By Application, 2020-2032
10.4.4. France Automotive Simulation Revenue (USD Million) and Forecast By Sales Channel, 2020-2032
10.5. Spain
10.5.1. Spain Automotive Simulation Revenue (USD Million) and Forecast By Deployment, 2020-2032
10.5.2. Spain Automotive Simulation Revenue (USD Million) and Forecast By Component, 2020-2032
10.5.3. Spain Automotive Simulation Revenue (USD Million) and Forecast By Application, 2020-2032
10.5.4. Spain Automotive Simulation Revenue (USD Million) and Forecast By Sales Channel, 2020-2032
10.6. Rest of Europe
10.6.1. Rest of Europe Automotive Simulation Revenue (USD Million) and Forecast By Deployment, 2020-2032
10.6.2. Rest of Europe Automotive Simulation Revenue (USD Million) and Forecast By Component, 2020-2032
10.6.3. Rest of Europe Automotive Simulation Revenue (USD Million) and Forecast By Application, 2020-2032
10.6.4. Rest of Europe Automotive Simulation Revenue (USD Million) and Forecast By Sales Channel, 2020-2032
10.7. Europe PEST Analysis
CHAPTER 11. Asia Pacific Automotive Simulation Market By Country
11.1. Asia Pacific Automotive Simulation Market Overview
11.2. China
11.2.1. China Automotive Simulation Revenue (USD Million) and Forecast By Deployment, 2020-2032
11.2.2. China Automotive Simulation Revenue (USD Million) and Forecast By Component, 2020-2032
11.2.3. China Automotive Simulation Revenue (USD Million) and Forecast By Application, 2020-2032
11.2.4. China Automotive Simulation Revenue (USD Million) and Forecast By Sales Channel, 2020-2032
11.3. Japan
11.3.1. Japan Automotive Simulation Revenue (USD Million) and Forecast By Deployment, 2020-2032
11.3.2. Japan Automotive Simulation Revenue (USD Million) and Forecast By Component, 2020-2032
11.3.3. Japan Automotive Simulation Revenue (USD Million) and Forecast By Application, 2020-2032
11.3.4. Japan Automotive Simulation Revenue (USD Million) and Forecast By Sales Channel, 2020-2032
11.4. India
11.4.1. India Automotive Simulation Revenue (USD Million) and Forecast By Deployment, 2020-2032
11.4.2. India Automotive Simulation Revenue (USD Million) and Forecast By Component, 2020-2032
11.4.3. India Automotive Simulation Revenue (USD Million) and Forecast By Application, 2020-2032
11.4.4. India Automotive Simulation Revenue (USD Million) and Forecast By Sales Channel, 2020-2032
11.5. Australia
11.5.1. Australia Automotive Simulation Revenue (USD Million) and Forecast By Deployment, 2020-2032
11.5.2. Australia Automotive Simulation Revenue (USD Million) and Forecast By Component, 2020-2032
11.5.3. Australia Automotive Simulation Revenue (USD Million) and Forecast By Application, 2020-2032
11.5.4. Australia Automotive Simulation Revenue (USD Million) and Forecast By Sales Channel, 2020-2032
11.6. South Korea
11.6.1. South Korea Automotive Simulation Revenue (USD Million) and Forecast By Deployment, 2020-2032
11.6.2. South Korea Automotive Simulation Revenue (USD Million) and Forecast By Component, 2020-2032
11.6.3. South Korea Automotive Simulation Revenue (USD Million) and Forecast By Application, 2020-2032
11.6.4. South Korea Automotive Simulation Revenue (USD Million) and Forecast By Sales Channel, 2020-2032
11.7. Rest of Asia-Pacific
11.7.1. Rest of Asia-Pacific Automotive Simulation Revenue (USD Million) and Forecast By Deployment, 2020-2032
11.7.2. Rest of Asia-Pacific Automotive Simulation Revenue (USD Million) and Forecast By Component, 2020-2032
11.7.3. Rest of Asia-Pacific Automotive Simulation Revenue (USD Million) and Forecast By Application, 2020-2032
11.7.4. Rest of Asia-Pacific Automotive Simulation Revenue (USD Million) and Forecast By Sales Channel, 2020-2032
CHAPTER 12. Latin America Automotive Simulation Market By Country
12.1. Latin America Automotive Simulation Market Overview
12.2. Brazil
12.2.1. Brazil Automotive Simulation Revenue (USD Million) and Forecast By Deployment, 2020-2032
12.2.2. Brazil Automotive Simulation Revenue (USD Million) and Forecast By Component, 2020-2032
12.2.3. Brazil Automotive Simulation Revenue (USD Million) and Forecast By Application, 2020-2032
12.2.4. Brazil Automotive Simulation Revenue (USD Million) and Forecast By Sales Channel, 2020-2032
12.3. Mexico
12.3.1. Mexico Automotive Simulation Revenue (USD Million) and Forecast By Deployment, 2020-2032
12.3.2. Mexico Automotive Simulation Revenue (USD Million) and Forecast By Component, 2020-2032
12.3.3. Mexico Automotive Simulation Revenue (USD Million) and Forecast By Application, 2020-2032
12.3.4. Mexico Automotive Simulation Revenue (USD Million) and Forecast By Sales Channel, 2020-2032
12.4. Rest of Latin America
12.4.1. Rest of Latin America Automotive Simulation Revenue (USD Million) and Forecast By Deployment, 2020-2032
12.4.2. Rest of Latin America Automotive Simulation Revenue (USD Million) and Forecast By Component, 2020-2032
12.4.3. Rest of Latin America Automotive Simulation Revenue (USD Million) and Forecast By Application, 2020-2032
12.4.4. Rest of Latin America Automotive Simulation Revenue (USD Million) and Forecast By Sales Channel, 2020-2032
12.5. Latin America PEST Analysis
CHAPTER 13. Middle East & Africa Automotive Simulation Market By Country
13.1. Middle East & Africa Automotive Simulation Market Overview
13.2. GCC
13.2.1. GCC Automotive Simulation Revenue (USD Million) and Forecast By Deployment, 2020-2032
13.2.2. GCC Automotive Simulation Revenue (USD Million) and Forecast By Component, 2020-2032
13.2.3. GCC Automotive Simulation Revenue (USD Million) and Forecast By Application, 2020-2032
13.2.4. GCC Automotive Simulation Revenue (USD Million) and Forecast By Sales Channel, 2020-2032
13.3. South Africa
13.3.1. South Africa Automotive Simulation Revenue (USD Million) and Forecast By Deployment, 2020-2032
13.3.2. South Africa Automotive Simulation Revenue (USD Million) and Forecast By Component, 2020-2032
13.3.3. South Africa Automotive Simulation Revenue (USD Million) and Forecast By Application, 2020-2032
13.3.4. South Africa Automotive Simulation Revenue (USD Million) and Forecast By Sales Channel, 2020-2032
13.4. Rest of Middle East & Africa
13.4.1. Rest of Middle East & Africa Automotive Simulation Revenue (USD Million) and Forecast By Deployment, 2020-2032
13.4.2. Rest of Middle East & Africa Automotive Simulation Revenue (USD Million) and Forecast By Component, 2020-2032
13.4.3. Rest of Middle East & Africa Automotive Simulation Revenue (USD Million) and Forecast By Application, 2020-2032
13.4.4. Rest of Middle East & Africa Automotive Simulation Revenue (USD Million) and Forecast By Sales Channel, 2020-2032
13.5. Middle East & Africa PEST Analysis
CHAPTER 14. Player Analysis Of Automotive Simulation Market
14.1. Automotive Simulation Market Company Share Analysis
14.2. Competition Matrix
14.2.1. Competitive Benchmarking of key players by price, presence, market share, and R&D investment
14.2.2. New Product Launches and Product Enhancements
14.2.3. Mergers And Acquisition In Global Automotive Simulation Market
14.2.4. Partnership, Joint Ventures and Strategic Alliances/ Sales Agreements
CHAPTER 15. Company Profile
15.1. Arthrex, Inc.
15.1.1. Company Snapshot
15.1.2. Business Overview
15.1.3. Financial Overview
15.1.3.1. Revenue (USD Million), 2022
15.1.3.2. Arthrex, Inc. 2022 Automotive Simulation Business Regional Distribution
15.1.4. Product /Service and Specification
15.1.5. Recent Developments & Business Strategy
15.2. Isto Biologics
15.3. Zimmer Biomet Holdings, Inc.
15.4. Colfax Corporation (Djo Global, Inc)
15.5. Terumo Corporation
15.6. Johnson & Johnson (Depuy Synthes)
15.7. Essex Woodlands Healthcare Partners (Bioventus Llc)
15.8. Medtronic Plc.
15.9. Orthofix Medical Inc.
15.10. Stryker Corporation