Automotive Aluminum Market | Acumen Research and Consulting
Automotive Aluminum Market Size - Global Industry, Share, Analysis, Trends and Forecast 2024 - 2032
Published :
Report ID:
Pages :
Format : 
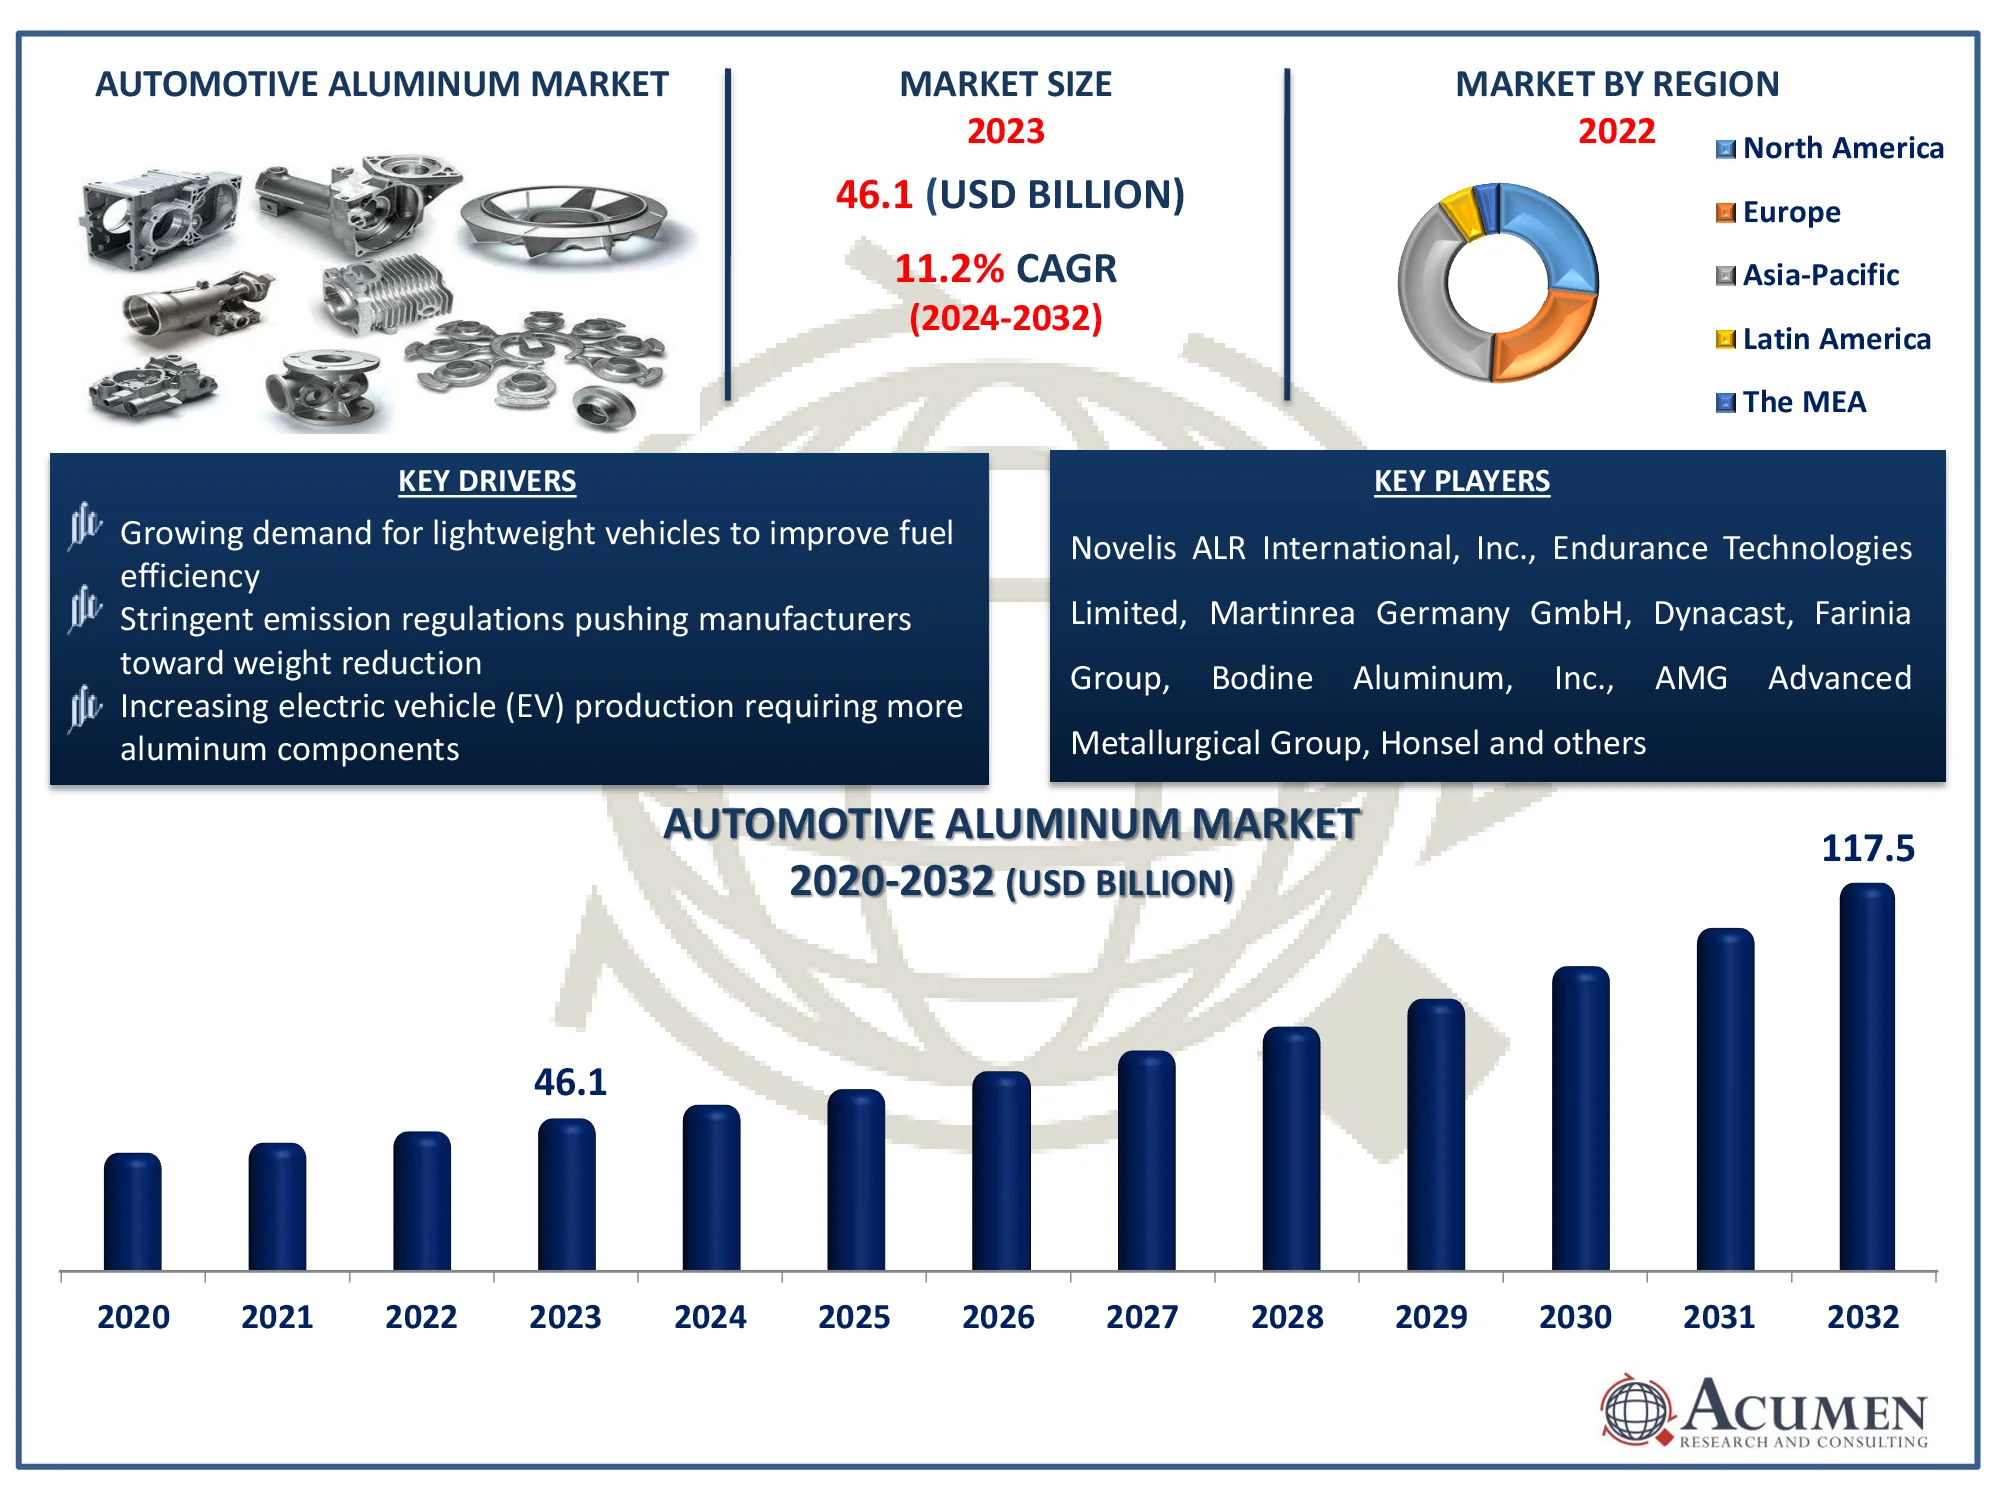
The Global Automotive Aluminum Market Size accounted for USD 46.1 Billion in 2023 and is estimated to achieve a market size of USD 117.5 Billion by 2032 growing at a CAGR of 11.2% from 2024 to 2032.
Automotive Aluminum Market Highlights
- The global automotive aluminum market is projected to reach USD 117.5 billion by 2032, with a CAGR of 11.2% from 2024 to 2032
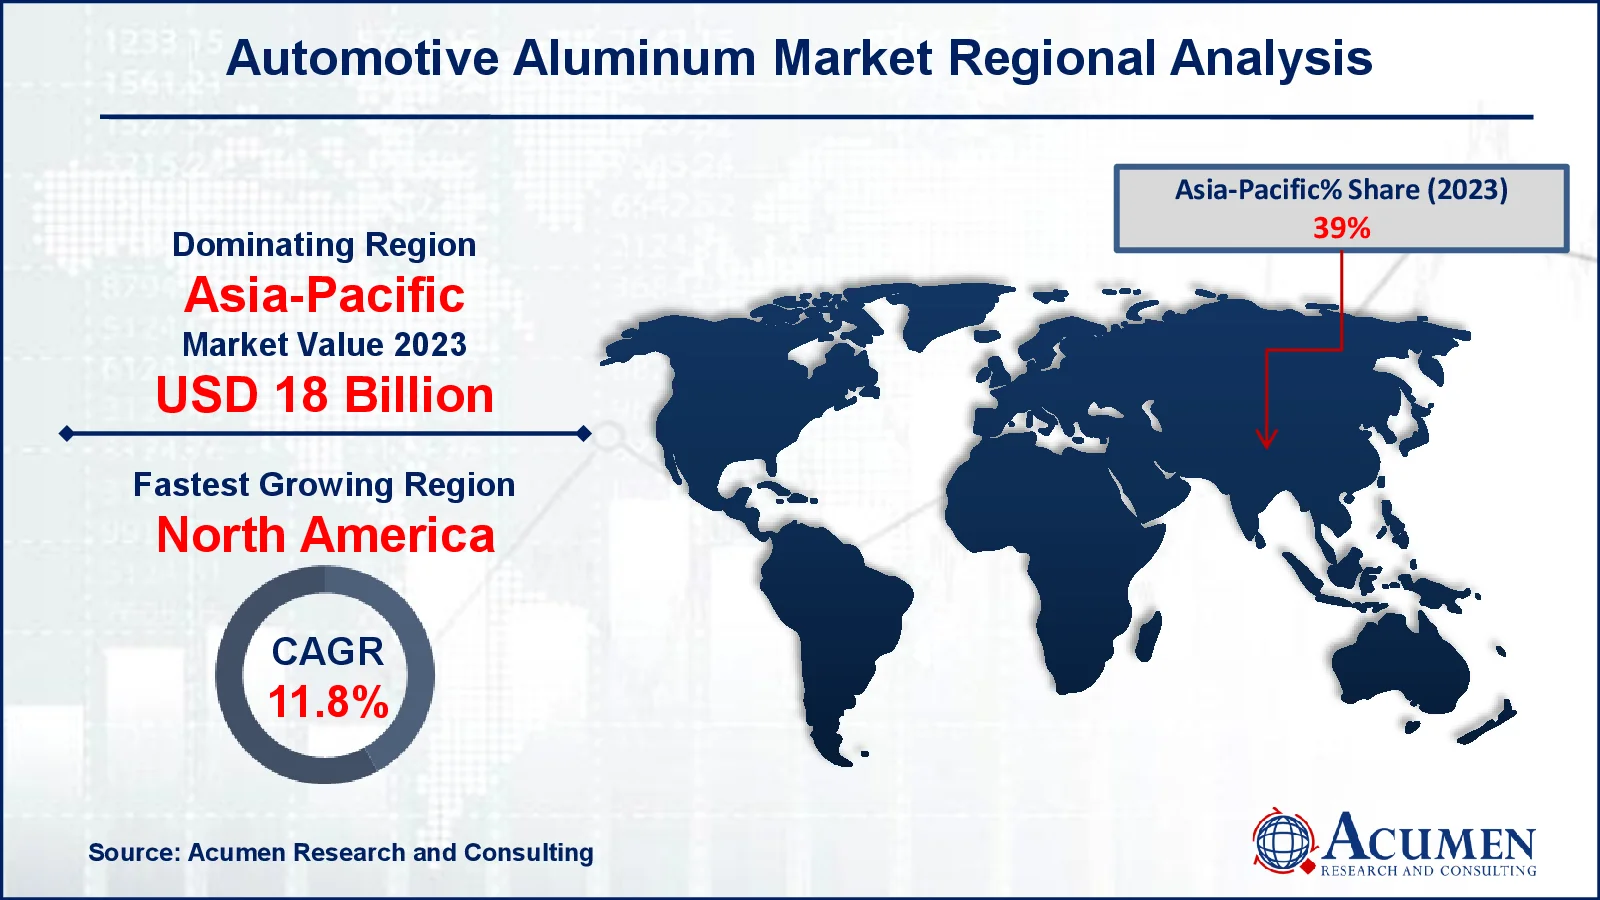
- The Asia-Pacific automotive aluminum market was valued at approximately USD 18 billion in 2023
- The North American automotive aluminum market is expected to grow at a CAGR of over 11.8% from 2024 to 2032
- The cast aluminum sub-segment accounted for a significant portion of the market share in 2023
- In terms of end use, the passenger cars sub-segment generated a notable share of the market in 2023
- Adoption of innovative manufacturing techniques like 3D printing for aluminum components is the automotive aluminum market trend that fuels the industry demand

Automotive aluminum is aluminum used in the production of automobiles, primarily to reduce weight and enhance fuel efficiency. It is employed in a variety of ways, including casting, rolling, and extrusion, for engine parts, body panels, and chassis structures. It provides excellent security and durability, as well as better fuel efficiency and reduced emissions. It is also the most commonly used metal in automobiles and commercial vehicles. Furthermore, because of its strength and environmental benefits, the demand for aluminum in automotive applications is increasing. The recovery from aluminum has generated demand, which is expected to grow significantly over the next several years.
Global Automotive Aluminum Market Dynamics
Market Drivers
- Growing demand for lightweight vehicles to improve fuel efficiency
- Stringent emission regulations pushing manufacturers toward weight reduction
- Increasing electric vehicle (EV) production requiring more aluminum components
Market Restraints
- High cost of aluminum compared to steel
- Complex manufacturing processes for aluminum parts
- Fluctuations in raw material prices affecting production costs
Market Opportunities
- Expanding use of aluminum in electric vehicle battery enclosures
- Technological advancements in aluminum processing techniques
- Rising demand for aluminum in emerging markets, especially in Asia-Pacific
Automotive Aluminum Market Report Coverage
| Market | Automotive Aluminum Market |
| Automotive Aluminum Market Size 2022 |
USD 46.1 Billion |
| Automotive Aluminum Market Forecast 2032 | USD 117.5 Billion |
| Automotive Aluminum Market CAGR During 2023 - 2032 | 11.2% |
| Automotive Aluminum Market Analysis Period | 2020 - 2032 |
| Automotive Aluminum Market Base Year |
2022 |
| Automotive Aluminum Market Forecast Data | 2023 - 2032 |
| Segments Covered | By Product Form, By Form, By Application, By End-User, And By Geography |
| Regional Scope | North America, Europe, Asia Pacific, Latin America, and Middle East & Africa |
| Key Companies Profiled | Novelis ALR International, Inc., Endurance Technologies Limited, Martinrea Honsel Germany GmbH, Dynacast, Farinia Group, Bodine Aluminum, Inc., AMG Advanced Metallurgical Group, Aluminium Bahrain (Alba), Dana Holding Corporation, Gibbs Die Casting Corporation, Constellium N. V., Norsk Hydro ASA, Ryobi Ltd, UACJ Corporation, and Kaiser Aluminum. |
| Report Coverage |
Market Trends, Drivers, Restraints, Competitive Analysis, Player Profiling, Covid-19 Analysis, Regulation Analysis |
Automotive Aluminum Market Insights
Growth drivers include the expansion of the automobile industry and greater automotive output. Increased automotive demand is expected to enhance demand for aluminum parts in North America, Europe, and Asia Pacific countries, specifically the United States, Germany, and China. Germany's close collaboration with Original Equipment Manufacturers (OEMs) of high-end passenger automobiles such as Audi, Mercedes, and BMW is projected to ensure long-term growth possibilities in the coming years.
Aluminium is primarily employed in the automobile industry due to its high strength, light weight, recyclability, corrosion and heat resistance, and electrical conductivity. It is frequently used in passenger cars, trucks, and buses. In addition, roughly 90% of used aluminum is recycled at the end of vehicle life. Aluminum has lately improved the effectiveness of automobiles manufactured by several automakers in a variety of areas, including the hybrid engine compartment, the roof, the damper strut console, and the doorframes.
The increasing usage of aluminum in electric vehicle (EV) battery casings creates a substantial opportunity for the automotive aluminum market. For instance, according to Ducker Carlisle's 2023 study of automakers and Tier 1 suppliers, desire for more sustainable transportation will help fuel an increase in market share for aluminum content by roughly 100 net pounds per light vehicle (PPV) between 2020 and 2030. According to the report, the use of aluminum in car manufacture is predicted to expand significantly. Aluminum's corrosion resistance and crashworthiness improve the safety and lifetime of electric vehicles, making it a perfect material for battery housings. As EV manufacturing increases, demand for aluminum in battery casings is likely to rise, propelling the industry forward.
Automotive Aluminum Market Segmentation
The worldwide market for automotive aluminum is split based on product form, form, application, end-user, and geography.
Automotive Aluminum Product Form
- Cast Aluminum
- Rolled Aluminum
- Extruded Aluminum
According to the automotive aluminum industry analysis, cast aluminum is the most popular product form due to its high strength-to-weight ratio, corrosion resistance, and cost-effectiveness in mass production. It is commonly utilized in the production of engine blocks, cylinder heads, and transmission housings, all of which require toughness and lightweight construction. The ease with which complicated designs may be created, as well as its recyclability, making it appealing to manufacturers looking to improve fuel efficiency and lower emissions.
Automotive Aluminum Form
- Sheet
- Plate
- Bar
- Tube
- Others
According to the automotive aluminum industry analysis, aluminum sheets are popular due to their adaptability and important function in car body structures such as hoods, doors, and panels. Their lightweight design helps to reduce overall vehicle weight, improve fuel efficiency, and fulfill severe pollution laws. Furthermore, aluminum sheets have exceptional formability, allowing automakers to create aerodynamic, high-strength structures that improve vehicle safety and performance.
Automotive Aluminum Application
- Chassis and Suspension
- Powertrain
- Body Structure
- Others
According to the automotive aluminum market forecast, the power train segment will rise in volume. The increased interest in hybrid technology and fuel usage has had a positive impact on the electric vehicle market, as has improved fuel efficiency and reduced fuel pollution. In light of the increasing demand for electric vehicles in the coming years, hybrid-electric powertrains using aluminum will have numerous applications. Aluminum components, including engine blocks, cylinder heads, and gearbox housings, help to reduce weight while preserving strength and longevity. As manufacturers strive to improve performance and meet tight regulatory criteria, the usage of aluminum in powertrain applications becomes increasingly popular.
Automotive Aluminum End-User
- Heavy Commercial Vehicles
- Light Commercial Vehicles
- Passenger Cars
According to the automotive aluminum market forecast, passenger automobiles accounted significant market's revenue. The increased demand for lightweight passenger automobile products is a result of the world's strict CO2 emission regulations. The usage of aluminum can drastically reduce the weight of various vehicle components, resulting in better fuel efficiency. As a result of changes in transportation and logistics, as well as tight fuel emission standards, growing demand for light commercial vehicles is likely to spur development in the production of cartons, tiny trucks, and electric tiny lorries. Using lightweight materials such as aluminum, security options, fuel costs, and efficient car transportation in light commercial vehicles. Government actions by automakers are expected to open up new market opportunities.
Automotive Aluminum Market Regional Outlook
North America
- U.S.
- Canada
Europe
- U.K.
- Germany
- France
- Spain
- Rest of Europe
Asia-Pacific
- India
- Japan
- China
- Australia
- South Korea
- Rest of Asia-Pacific
Latin America
- Brazil
- Mexico
- Rest of Latin America
The Middle East & Africa
- South Africa
- GCC Countries
- Rest of the Middle East & Africa (ME&A)

Automotive Aluminum Market Regional Analysis
For several reasons, Asia-Pacific is likely to remain the largest regional market throughout the forecast period. In 2023, the area accounted for more than 39% of share. The rising demand for automobiles, together with rising investments in the national automobile sector, is a crucial growth driver in countries such as China and India. For instance, according to International Trade Administration, China remains the largest automobile market by both annual sales and manufacturing output, with local production estimated to exceed 35 million vehicles by 2025.
North America is predicted to expand by approximately 11.8% CAGR during the forecast period. In the coming years, consumer preference for high-quality, fuel-efficient motor vehicles, combined with strict CAFE standards, will expand the usage of aluminum in the region's car industry to improve vehicle fuel efficiency.
The construction of new plants, legislation, and technologies are projected to propel the European automobile sector. The establishment of new production plants in the European automobile sector is expected to raise demand for aluminum. For instance, in 2022, Norsk Hydro ASA invested NOK 300 million in a new vehicle extrusion press at its Tonder, Denmark, facility. The new 12-inch, 6000-tonne extrusion press caters to the European automotive and EV segments.
Automotive Aluminum Market Players
Some of the top automotive aluminum companies offered in our report include Novelis ALR International, Inc., Endurance Technologies Limited, Martinrea Honsel Germany GmbH, Dynacast, Farinia Group, Bodine Aluminum, Inc., AMG Advanced Metallurgical Group, Aluminium Bahrain (Alba), Dana Holding Corporation, Gibbs Die Casting Corporation, Constellium N. V., Norsk Hydro ASA, Ryobi Ltd, UACJ Corporation, and Kaiser Aluminum.
Frequently Asked Questions
How big is the Automotive Aluminum market?
The automotive aluminum market size was valued at USD 46.1 Billion in 2023.
What is the CAGR of the global Automotive Aluminum market from 2024 to 2032?
The CAGR of automotive aluminum is 11.2% during the analysis period of 2024 to 2032.
Which are the key players in the Automotive Aluminum market?
The key players operating in the global market are including Novelis ALR International, Inc., Endurance Technologies Limited, Martinrea Honsel Germany GmbH, Dynacast, Farinia Group, Bodine Aluminum, Inc., AMG Advanced Metallurgical Group, Aluminium Bahrain (Alba), Dana Holding Corporation, Gibbs Die Casting Corporation, Constellium N. V., Norsk Hydro ASA, Ryobi Ltd, UACJ Corporation, Kaiser Aluminum.
Which region dominated the global Automotive Aluminum market share?
Asia-Pacific held the dominating position in Automotive Aluminum industry during the analysis period of 2024 to 2032.
Which region registered fastest growing CAGR from 2024 to 2032?
North American region exhibited fastest growing CAGR for market of automotive aluminum during the analysis period of 2024 to 2032.
What are the current trends and dynamics in the global Automotive Aluminum industry?
The current trends and dynamics in the automotive aluminum industry include growing demand for lightweight vehicles to improve fuel efficiency, stringent emission regulations pushing manufacturers toward weight reduction, and increasing electric vehicle (EV) production requiring more aluminum components.
Which Product Form held the maximum share in 2023?
The cast aluminum product form held the maximum share of the automotive aluminum industry.
Select Licence Type
Connect with our sales team
Why Acumen Research And Consulting
100%
Customer Satisfaction
24x7
Availability - we are always there when you need us
200+
Fortune 50 Companies trust Acumen Research and Consulting
80%
of our reports are exclusive and first in the industry
100%
more data and analysis
1000+
reports published till date


