Automated Liquid Handling Technology Market Size - Global Industry, Share, Analysis, Trends and Forecast 2024 - 2032
Published :
Report ID:
Pages :
Format :
Automated Liquid Handling Technology Market Size - Global Industry, Share, Analysis, Trends and Forecast 2024 - 2032
Report Coverage
- Industry Dynamics
- Market Size and Forecast Data
- Segment Analysis
- Competitive Landscape
- Regional Analysis with a Niche Focus on Country-Level Data
- High Level Analysis - Porter's, PESTEL, Value Chain, etc.
- Company Profiles of Key Players
- Option to Customize the Report As Per Your Specific Need
Request Sample Report
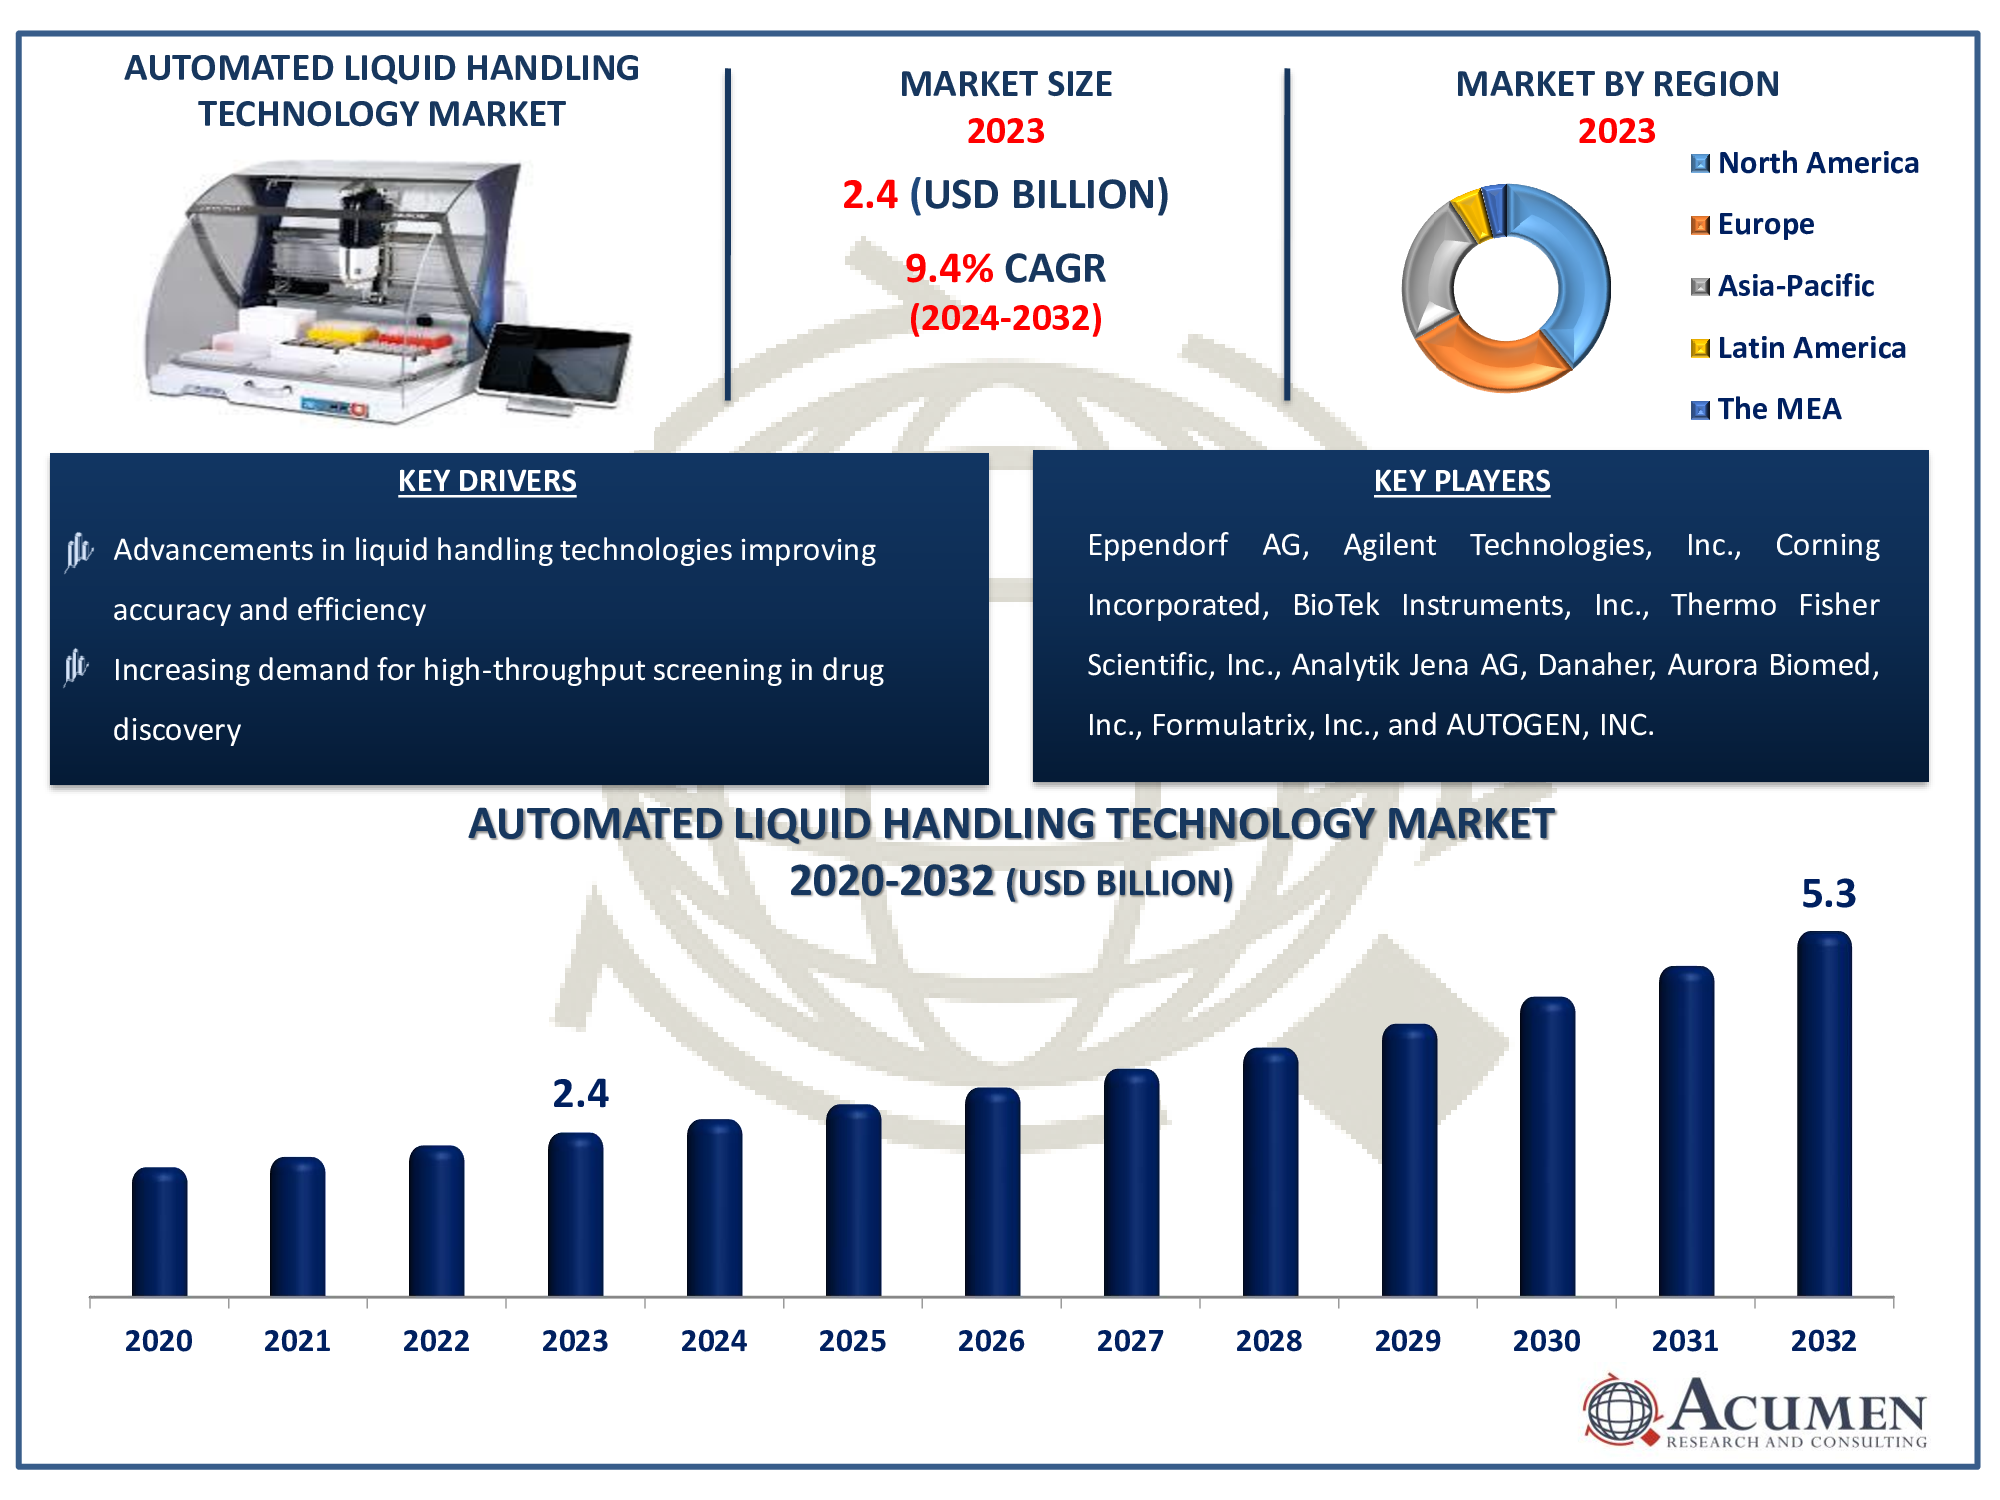
The Global Automated Liquid Handling Technology Market Size accounted for USD 2.4 Billion in 2023 and is estimated to achieve a market size of USD 5.3 Billion by 2032 growing at a CAGR of 9.4% from 2024 to 2032.
Automated Liquid Handling Technology Market Highlights
- Global automated liquid handling technology market revenue is poised to garner USD 5.3 billion by 2032 with a CAGR of 9.4% from 2024 to 2032
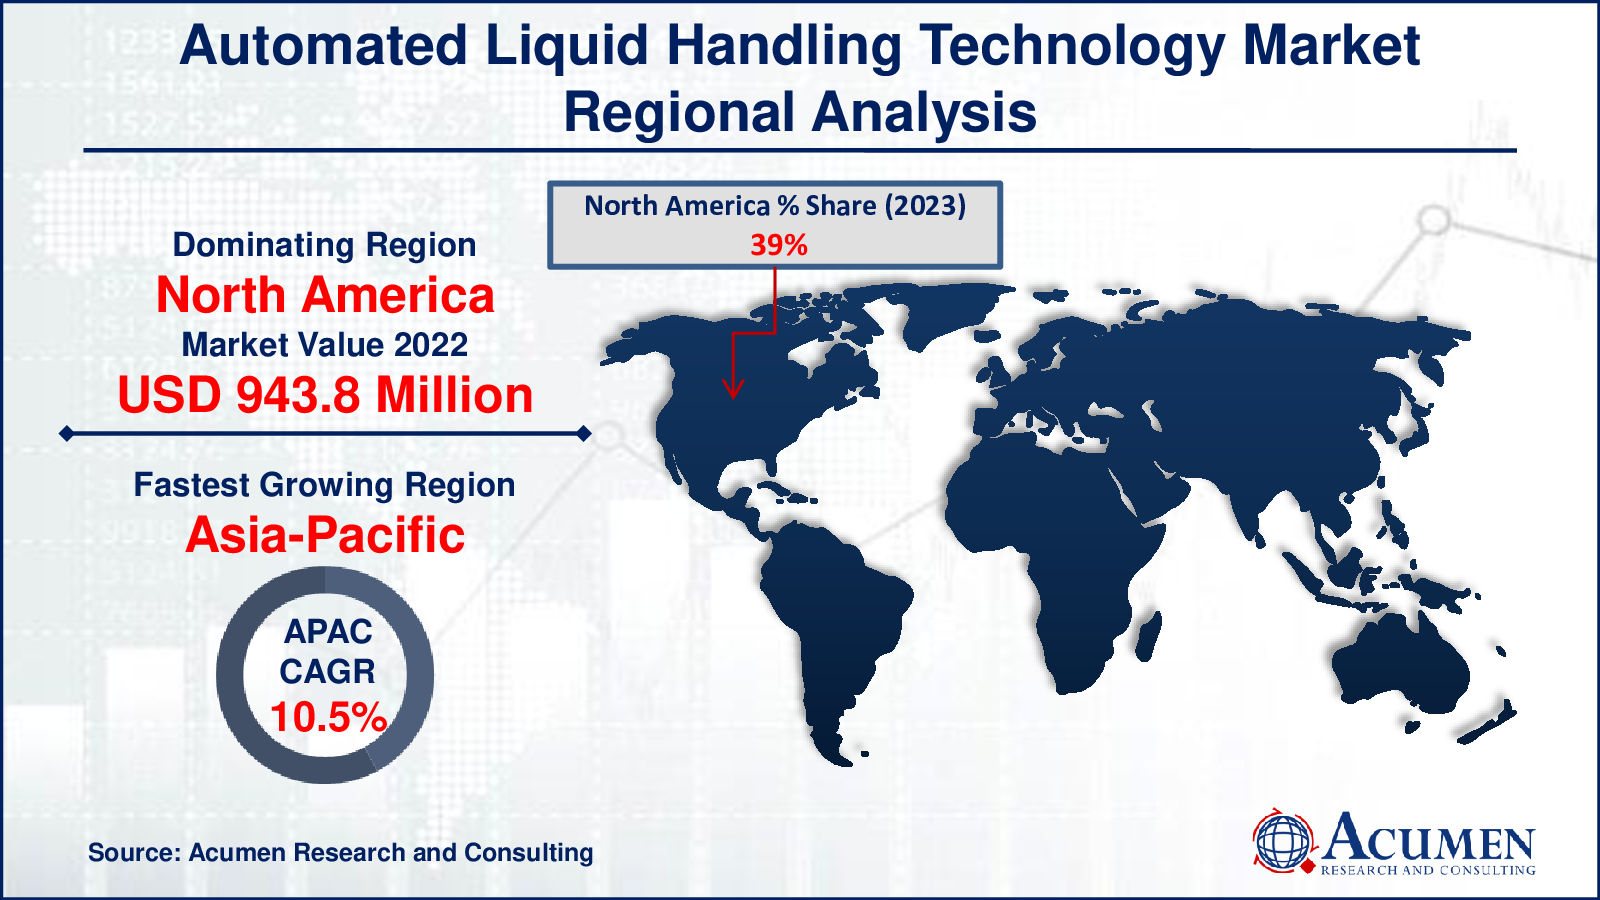
- North America automated liquid handling technology market value occupied around USD 943.8 million in 2023
- Asia-Pacific automated liquid handling technology market growth will record a CAGR of more than 10.5% from 2024 to 2032
- Among end-user, the pharmaceutical & biotechnology companies sub-segment generated notable revenue in 2023
- Based on product, the automated liquid handling workstations sub-segment generated around 57% market share in 2023
- Development of user-friendly and cost-effective automated liquid handling solutions is a popular automated liquid handling technology market trend that fuels the industry demand

Automated liquid handling technology is the use of robotic devices to make precise and accurate liquid transfers in laboratories. These systems are intended to handle operations like as pipetting, dispensing, and mixing liquids, lowering the danger of human mistake while enhancing efficiency. Automated liquid handlers are widely employed in a variety of fields, including drug development, genomics, proteomics, and clinical diagnosis. They provide advantages such as high throughput, repeatability, and the ability to handle small amounts of liquids accurately. These devices can be designed to follow complex protocols, allowing researchers to concentrate on data analysis and interpretation rather than manual pipetting. Overall, automated liquid handling technology improves both laboratory productivity and data accuracy.
Global Automated Liquid Handling Technology Market Dynamics
Market Drivers
- Increasing demand for high-throughput screening in drug discovery
- Growing adoption of automated systems in genomics and proteomics
- Advancements in liquid handling technologies improving accuracy and efficiency
- Rising need for minimizing human error in laboratory processes
Market Restraints
- High initial costs of automated liquid handling systems
- Technical complexities and maintenance requirements
- Limited flexibility for handling different types of liquids
Market Opportunities
- Expanding applications in clinical diagnostics and personalized medicine
- Growing interest in laboratory automation in emerging markets
- Integration of AI and machine learning for enhanced system performance
Automated Liquid Handling Technology Market Report Coverage
| Market | Automated Liquid Handling Technology Market |
| Automated Liquid Handling Technology Market Size 2022 |
USD 2.4 Billion |
| Automated Liquid Handling Technology Market Forecast 2032 | USD 5.3 Billion |
| Automated Liquid Handling Technology Market CAGR During 2023 - 2032 | 9.4% |
| Automated Liquid Handling Technology Market Analysis Period | 2020 - 2032 |
| Automated Liquid Handling Technology Market Base Year |
2022 |
| Automated Liquid Handling Technology Market Forecast Data | 2024 - 2032 |
| Segments Covered | By Product, By Application, By End-user, And By Geography |
| Regional Scope | North America, Europe, Asia Pacific, Latin America, and Middle East & Africa |
| Key Companies Profiled | Eppendorf AG, Agilent Technologies, Inc., Corning Incorporated, BioTek Instruments, Inc., Thermo Fisher Scientific, Inc., Analytik Jena AG, Danaher, Aurora Biomed, Inc., Formulatrix, Inc., and AUTOGEN, INC. |
| Report Coverage |
Market Trends, Drivers, Restraints, Competitive Analysis, Player Profiling, Covid-19 Analysis, Regulation Analysis |
Automated Liquid Handling Technology Market Insights
The automated liquid handling technology market is expected to grow significantly with the introduction of new workstations designed for non-contact dispensing. These advanced systems allow for the precise and efficient transfer of liquids without direct contact, addressing some of the limitations of traditional methods. In recent years, contact dispensing has been widely accepted due to its simplicity, reliability, and low cost. However, as the volume of samples being handled decreases, the demand for more precise liquid handling methods is increasing. Surface adhesion becomes a critical factor in ensuring accurate performance when dealing with very small sample volumes, such as in the micro- to nanoliter range.
Automated liquid handling technology has revolutionized the way wet lab research is conducted, particularly in the pharmaceutical and biotechnology industries. By enabling significant reorganization of research and development (R&D) facilities, these technologies have allowed companies to optimize their processes. The rapid adoption of liquid handling robots is replacing traditional 'wet lab' bench work, leading to increased efficiency and accuracy in laboratory tasks.
The ability to handle liquid samples effectively and precisely is crucial for maintaining overall efficiency in pharmaceutical and biotechnology operations. This has made these industries and research laboratories highly dependent on automated platforms. The use of customizable and pre-programmed processes in these systems reduces the need for manual administration, allowing researchers to focus more on data analysis and interpretation. This shift not only enhances productivity but also ensures higher accuracy and reproducibility in experimental results.
Automated Liquid Handling Technology Market Segmentation
The worldwide market for automated liquid handling technology is split based on product, application end-user, and geography.
Automated Liquid Handling Technology Market By Product
- Automated Liquid Handling Workstations
- By Assembly
- Standalone Workstations
- Integrated Workstations
- By Type
- Multipurpose Workstation
- Pipetting Workstation
- Specialized Liquid Handler
- Workstation Module
- By Assembly
- Reagents & Consumables
- Reagents
- Accessories
According to automated liquid handling technology industry analysis, the automated liquid handling workstations segment generates the largest revenue within the market. These workstations are integral to modern laboratories, offering advanced features that ensure precision, speed, and reproducibility in liquid handling tasks. They support a wide range of applications, from genomics and proteomics to drug discovery and clinical diagnostics, making them highly versatile and valuable. The demand for these workstations is driven by their ability to automate complex protocols, reduce human error, and handle small sample volumes with high accuracy. Their advanced capabilities, such as non-contact dispensing and customizable workflows, further enhance their appeal. Additionally, the continuous advancements in technology and the increasing adoption of automation in laboratories worldwide contribute to the significant revenue generation of this segment. As a result, automated liquid handling workstations remain a critical component in the growth of the automated liquid handling technology market.
Automated Liquid Handling Technology Market By Application
- Drug Discovery & ADME-Tox Research
- Cancer & Genomic Research
- Bioprocessing/Biotechnology
- Others
The drug discovery and ADME-Tox research segment is anticipated to take the largest share in the automated liquid handling technology market. This dominance is due to the critical role these technologies play in accelerating the drug discovery process and improving the accuracy of ADME-Tox studies. Automated liquid handling systems streamline high-throughput screening, compound management, and the preparation of assay plates, which are essential for identifying potential drug candidates. These systems also enhance the efficiency of ADME-Tox research by providing precise and reproducible liquid transfers, crucial for studying the absorption, distribution, metabolism, excretion, and toxicity of drugs. The increasing demand for new therapeutics and the need to reduce the time and cost of drug development further drive the adoption of automated liquid handling technologies in this segment. Consequently, the drug discovery and ADME-Tox research segment is expected to lead the market.
Automated Liquid Handling Technology Market By End-User
- Academic & Research Institutes
- Pharmaceutical & Biotechnology Companies
- Contract Research Organizations
Pharmaceutical and biotechnology companies dominate the industry and it is expected to increase over the automated liquid handling technology market forecast period. These organizations make significant investments in automated liquid handling systems to improve their R&D capabilities, streamline operations, and boost production. These technologies' precision and efficiency are crucial for high-throughput screening, compound management, and drug development at all stages. Automation reduces human error and ensures reproducibility, which is critical for regulatory compliance and successful clinical studies. The continual desire for innovation in drug discovery and bioprocessing, combined with the need to minimize time-to-market, is driving the adoption of automated systems. As a result, pharmaceutical and biotechnology businesses continue to lead the way in applying these cutting-edge technologies in order to maintain their competitive advantage.
Automated Liquid Handling Technology Market Regional Outlook
North America
- U.S.
- Canada
Europe
- U.K.
- Germany
- France
- Spain
- Rest of Europe
Asia-Pacific
- India
- Japan
- China
- Australia
- South Korea
- Rest of Asia-Pacific
Latin America
- Brazil
- Mexico
- Rest of Latin America
The Middle East & Africa
- South Africa
- GCC Countries
- Rest of the Middle East & Africa (ME&A)

Automated Liquid Handling Technology Market Regional Analysis
In terms of automated liquid handling technology market analysis, North America captured the largest industry share in 2023 due to the well-established distribution network of major market participants and the higher use of advanced automation solutions. The need for small volume genomic and proteomics analysis for life science research and development is further driving the growth of the regional automated liquid handling technology market. Participants in the region are integrating with large academic universities and research centers in Europe to increase their revenue.
Asia-Pacific is anticipated to record the highest CAGR in the automated liquid handling technology industry forecast period, due to conducive development parameters for biopharmaceutical and pharma businesses in the region. Growing investments in medicine, life sciences, and the pharmaceutical industry are also driving the development of the regional market.
Automated Liquid Handling Technology Market Players
Some of the top automated liquid handling technology companies offered in our report include Eppendorf AG, Agilent Technologies, Inc., Corning Incorporated, BioTek Instruments, Inc., Thermo Fisher Scientific, Inc., Analytik Jena AG, Danaher, Aurora Biomed, Inc., Formulatrix, Inc., and AUTOGEN, INC.
Frequently Asked Questions
How big is the automated liquid handling technology market?
The automated liquid handling technology market size was valued at USD 2.4 billion in 2023.
What is the CAGR of the global automated liquid handling technology market from 2024 to 2032?
The CAGR of automated liquid handling technology is 9.4% during the analysis period of 2024 to 2032.
Which are the key players in the automated liquid handling technology market?
The key players operating in the global market are including Eco Wave Power, OpenHydro, Aquamarine Power, CorPower Ocean, Ocean Power Technologies, Pelamis Wave Power, Wello, Wave Swell, Carnegie Clean Energy, Ocean Renewable Power Company, SIMEC Atlantis Energy, and Orbital Marine Power.
Which region dominated the global automated liquid handling technology market share?
North America held the dominating position in automated liquid handling technology industry during the analysis period of 2024 to 2032.
Which region registered fastest CAGR from 2024 to 2032?
Asia-Pacific region exhibited fastest growing CAGR for market of automated liquid handling technology during the analysis period of 2024 to 2032.
What are the current trends and dynamics in the global automated liquid handling technology industry?
The current trends and dynamics in the automated liquid handling technology industry include increasing demand for high-throughput screening in drug discovery, growing adoption of automated systems in genomics and proteomics, advancements in liquid handling technologies improving accuracy and efficiency, and rising need for minimizing human error in laboratory processes.
Which application held the maximum share in 2023?
The drug discovery & ADME-Tox research application held the maximum share of the automated liquid handling technology industry.?


