Armored Vehicle Market Size - Global Industry, Share, Analysis, Trends and Forecast 2023 - 2032
Published :
Report ID:
Pages :
Format :
Armored Vehicle Market Size - Global Industry, Share, Analysis, Trends and Forecast 2023 - 2032
Report Coverage
- Industry Dynamics
- Market Size and Forecast Data
- Segment Analysis
- Competitive Landscape
- Regional Analysis with a Niche Focus on Country-Level Data
- High Level Analysis - Porter's, PESTEL, Value Chain, etc.
- Company Profiles of Key Players
- Option to Customize the Report As Per Your Specific Need
Request Sample Report
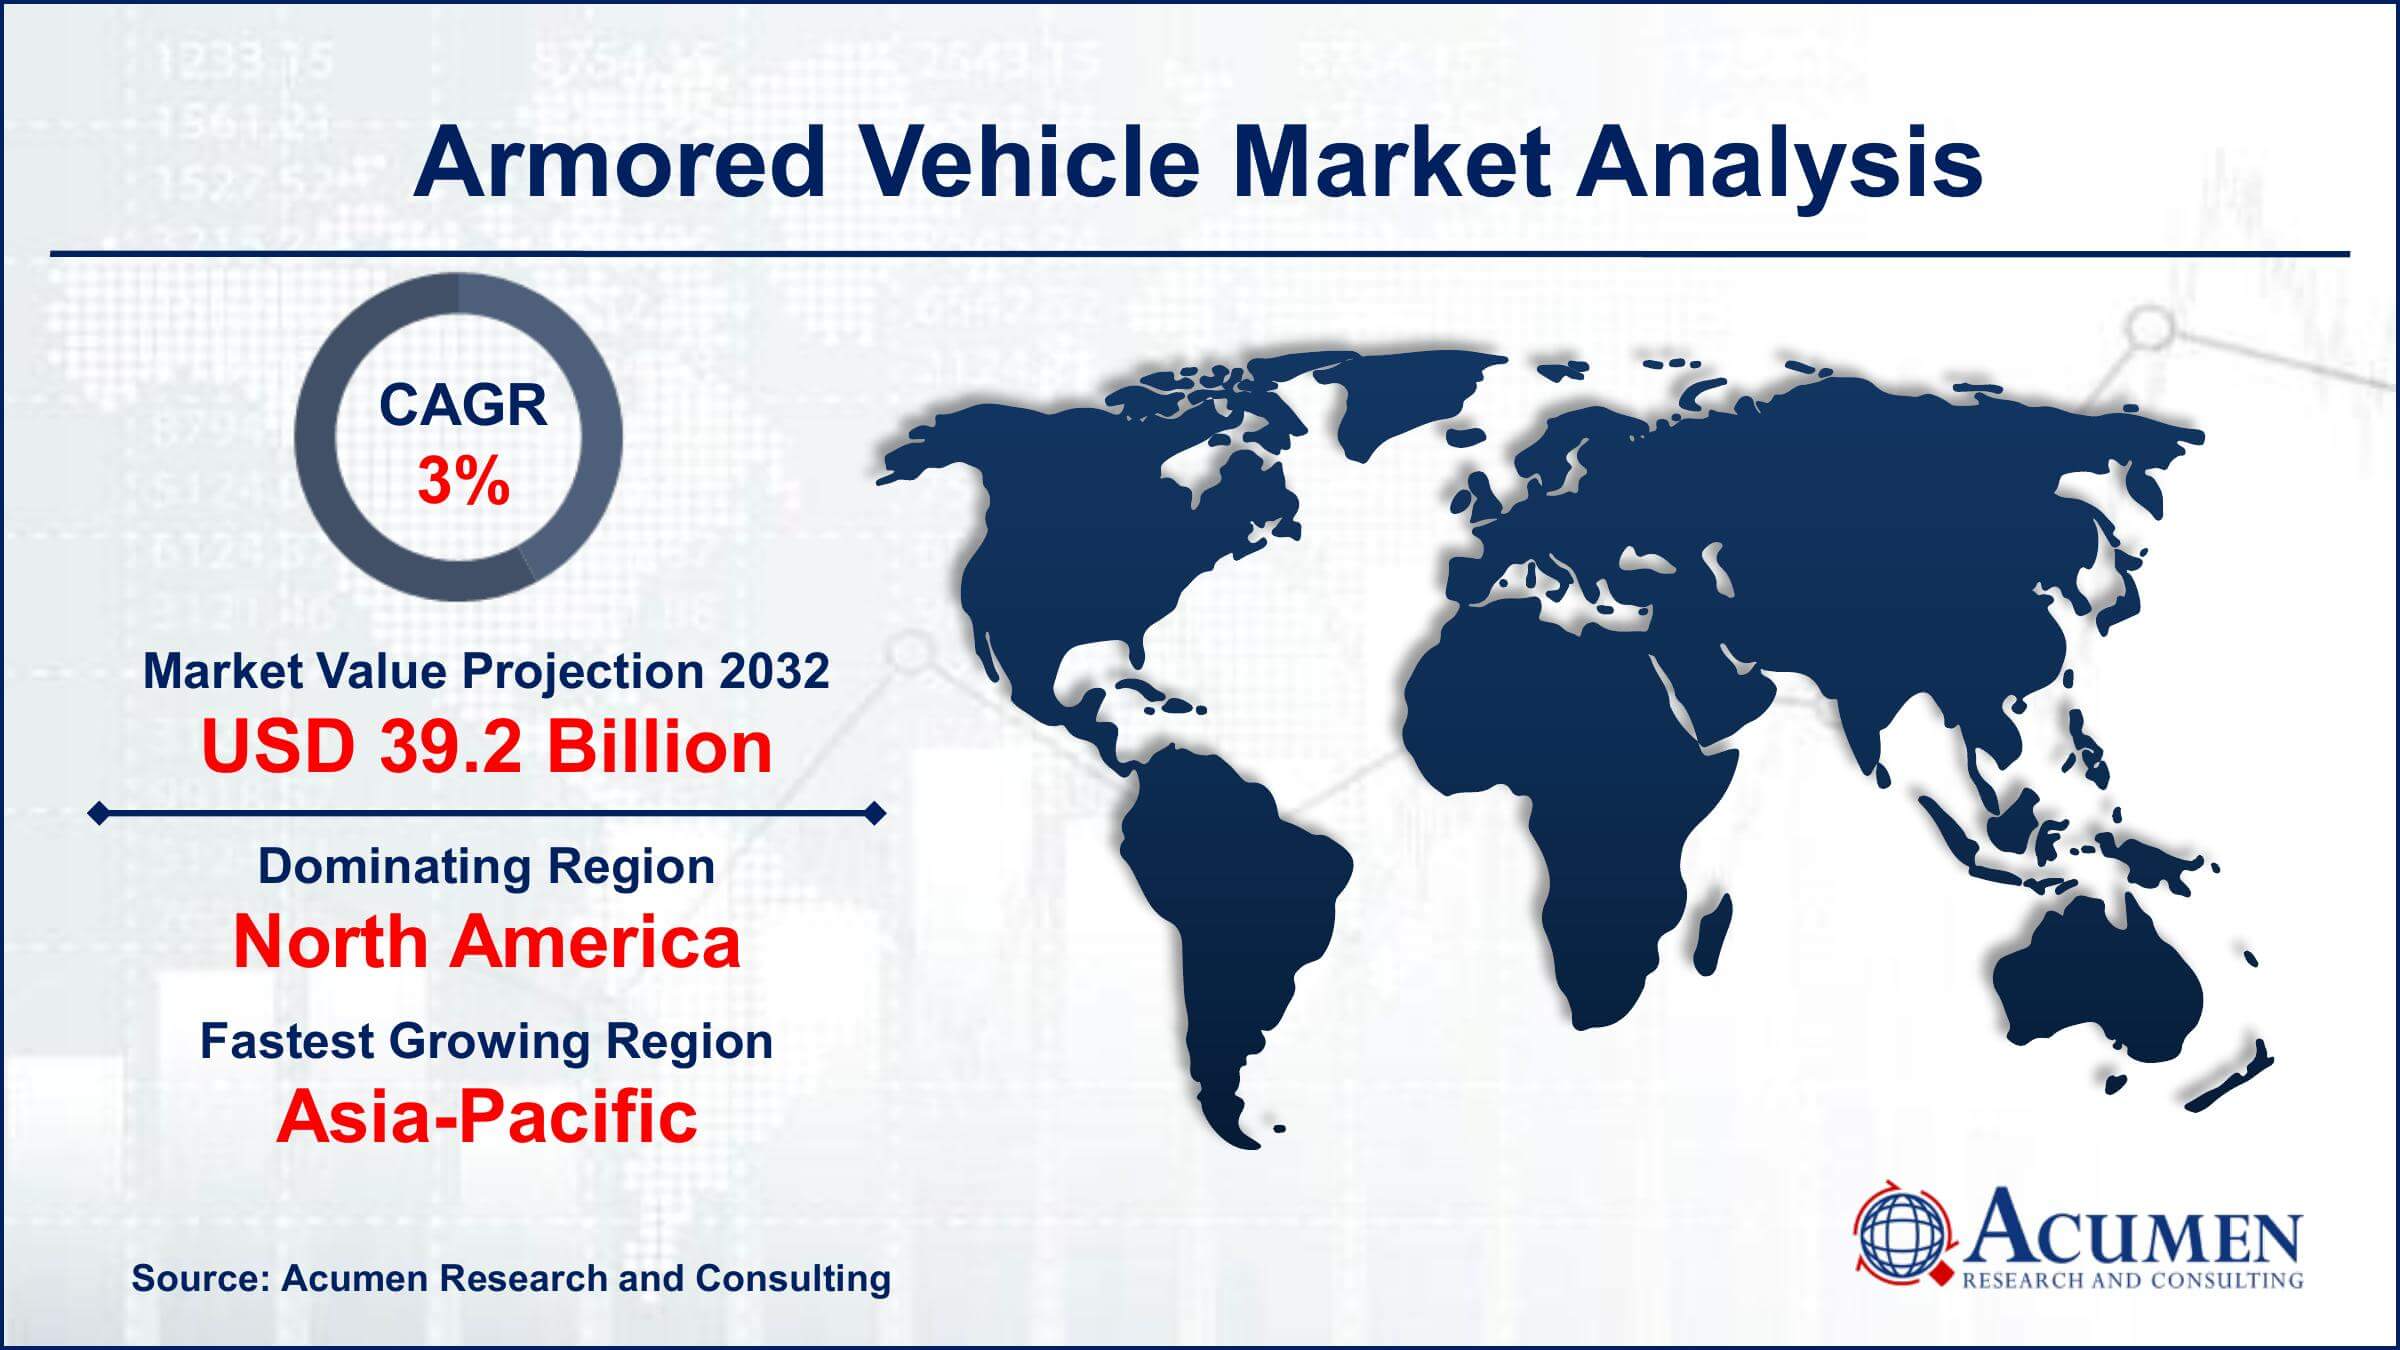
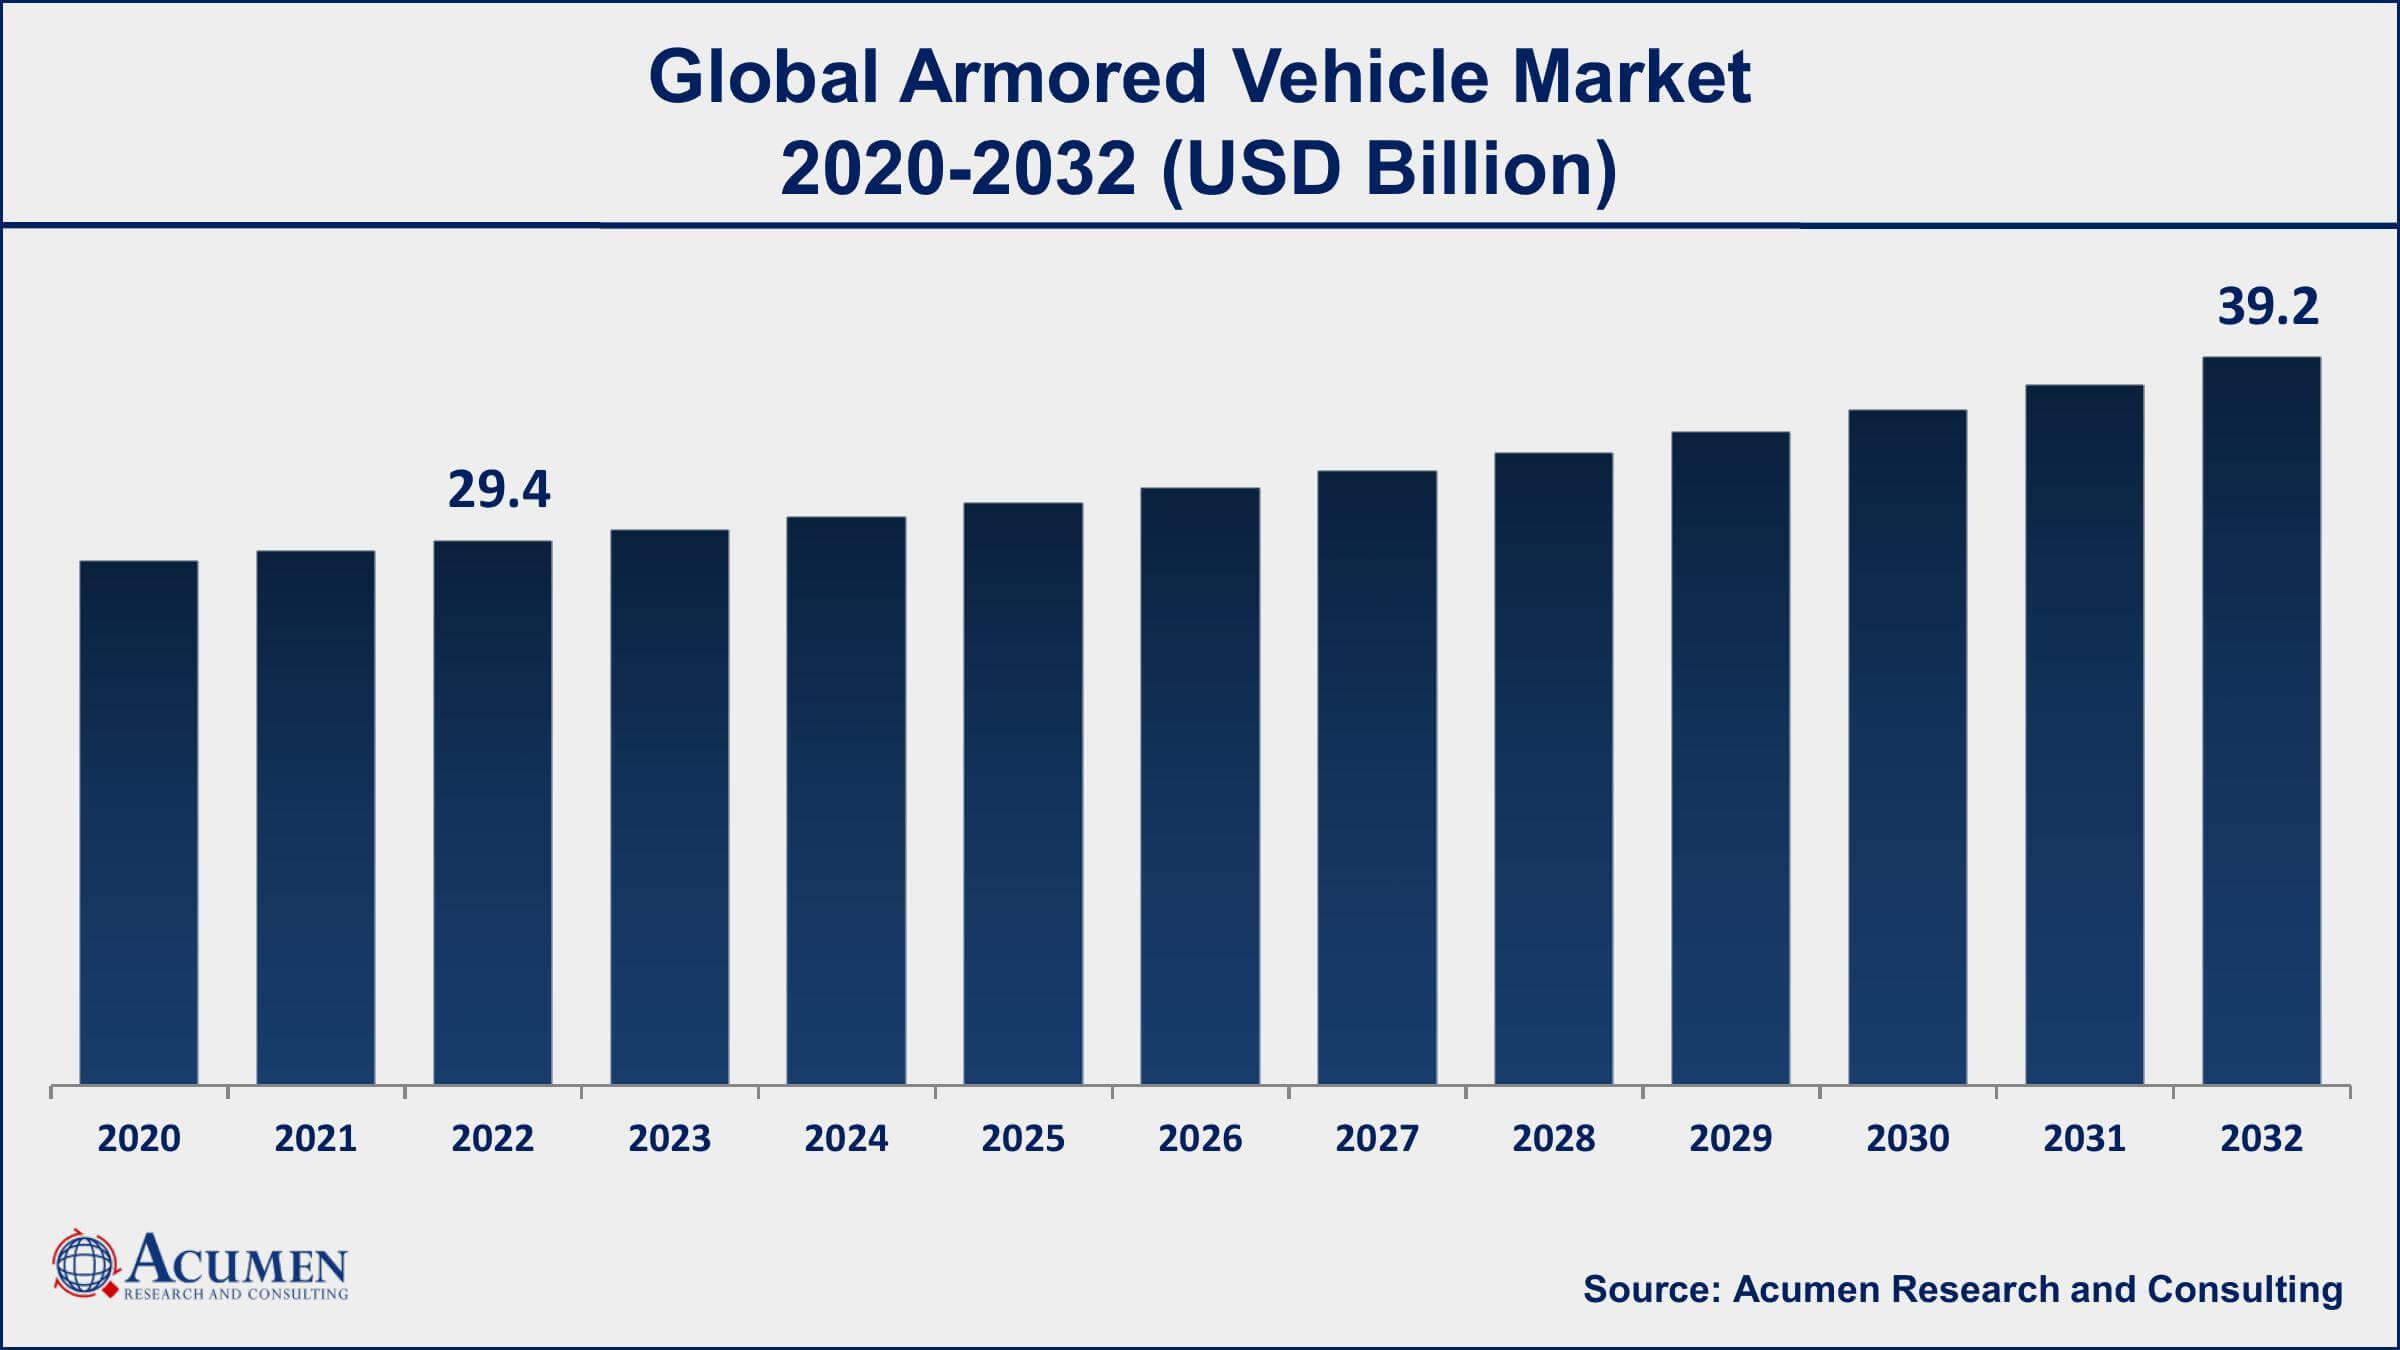
The Global Armored Vehicle Market Size accounted for USD 29.4 Billion in 2022 and is projected to achieve a market size of USD 39.2 Billion by 2032 growing at a CAGR of 3% from 2023 to 2032.
Armored Vehicle Market Report Key Highlights
- Global armored vehicle market revenue is expected to increase by USD 39.2 Billion by 2032, with a 3% CAGR from 2023 to 2032
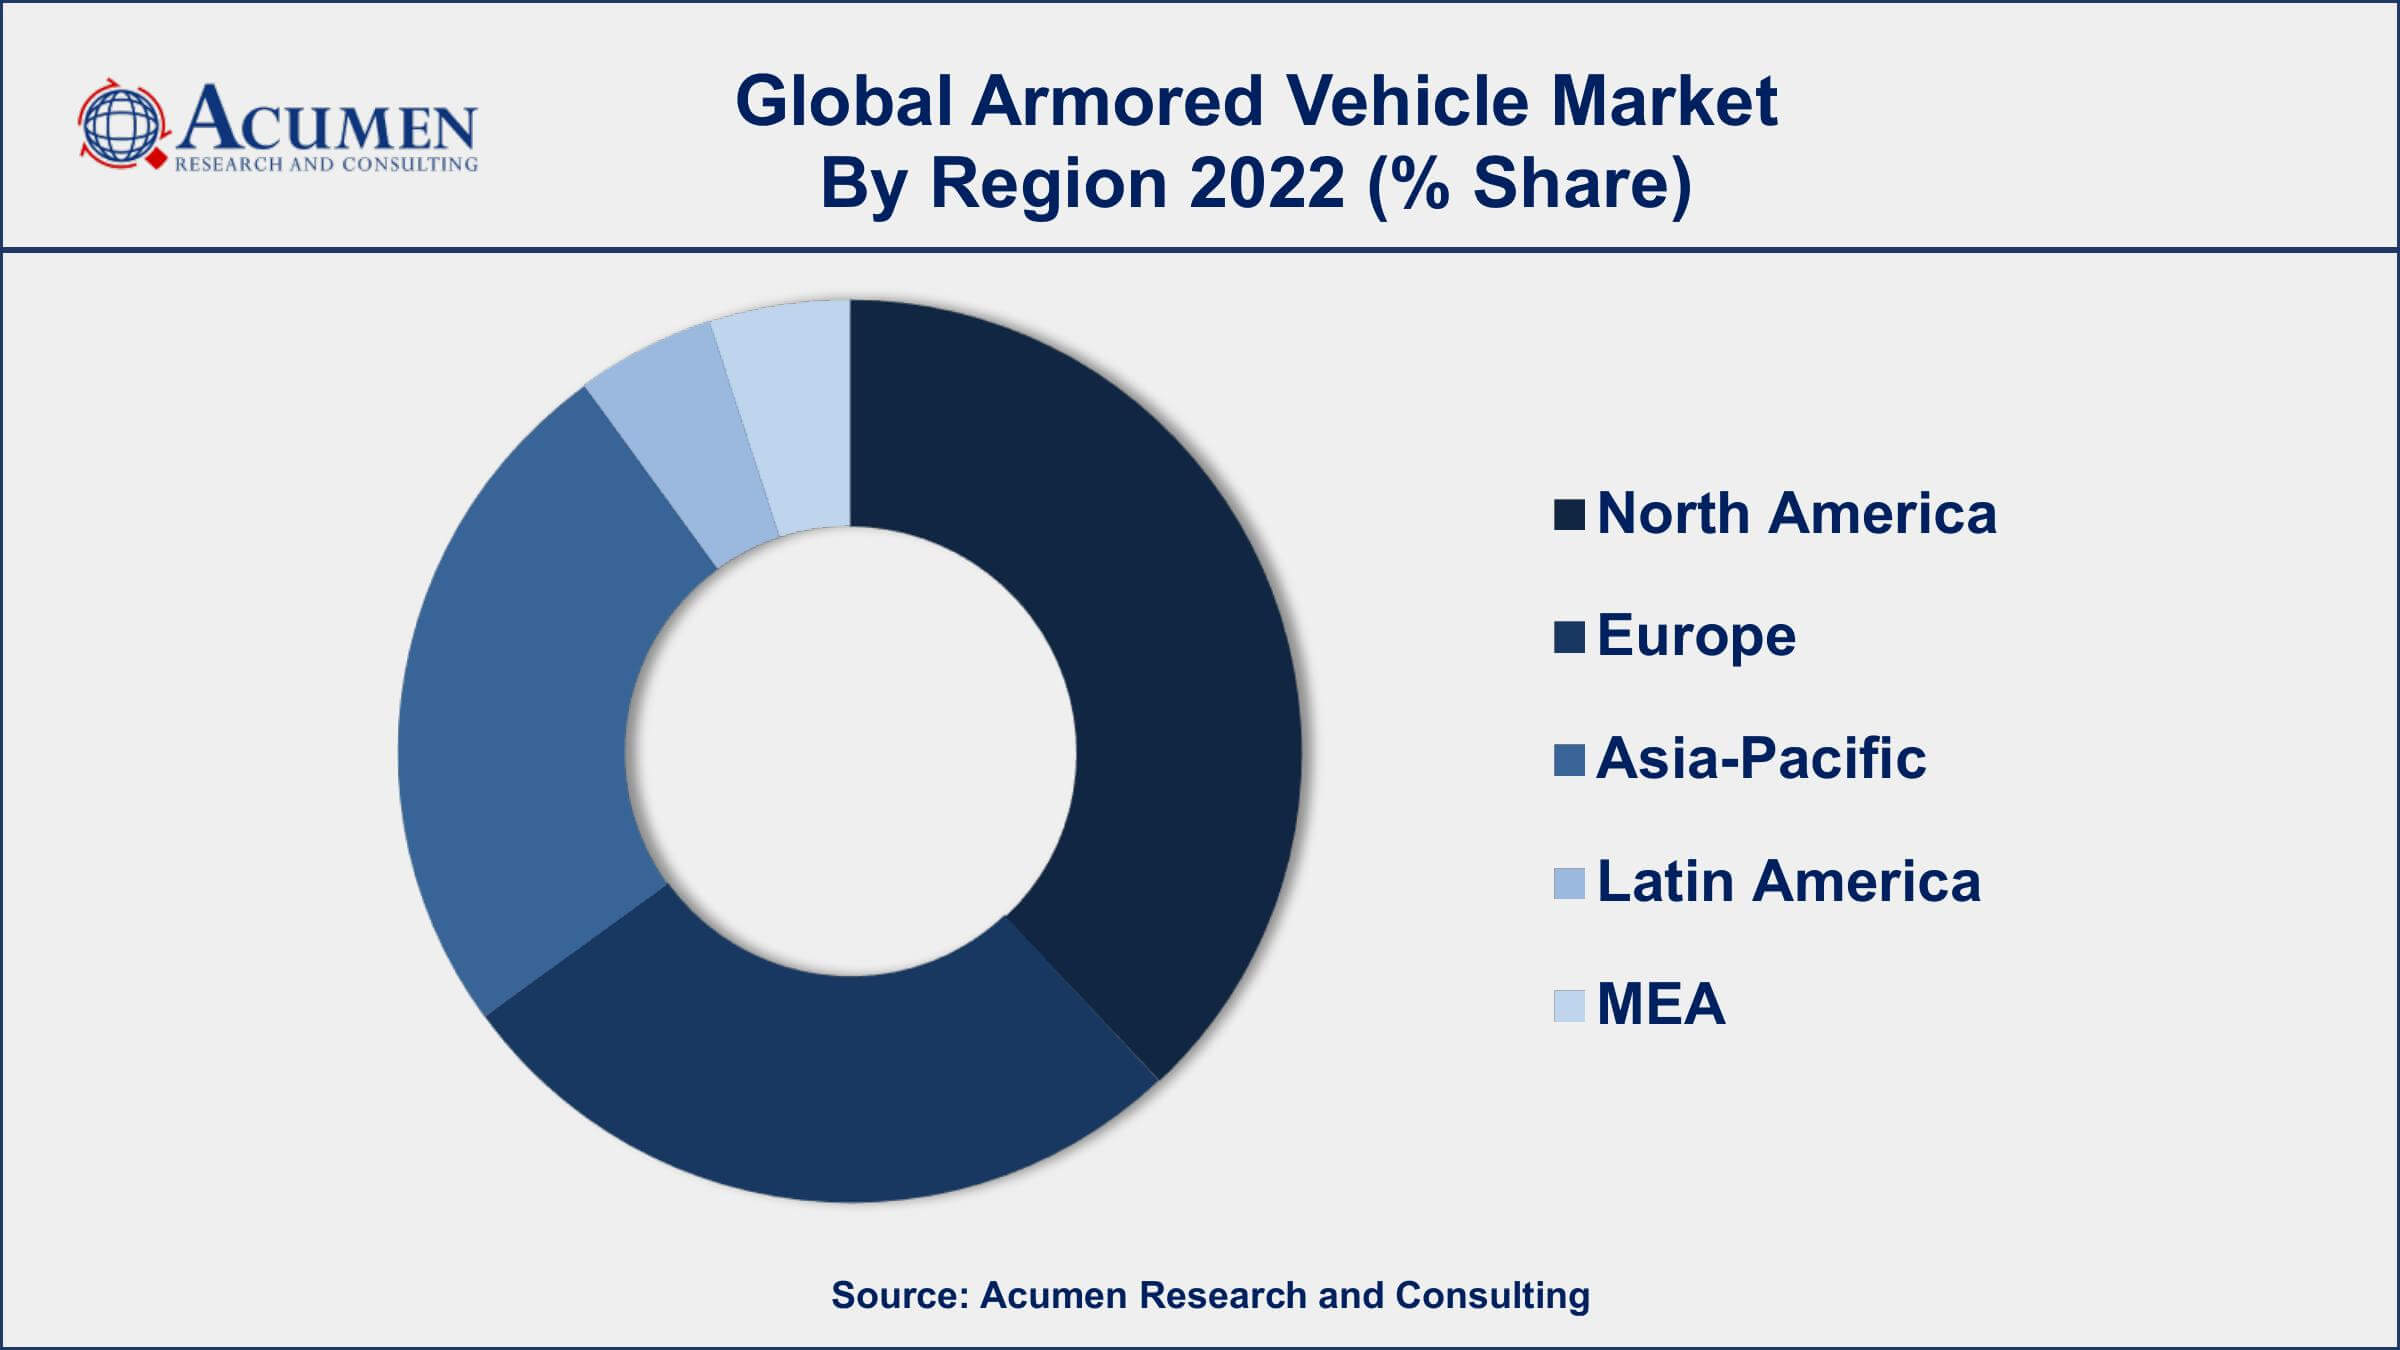
- North America region led with more than 39% of armored vehicle market share in 2022
- The United States has the largest number of armored vehicles in the world, with over 7,000 tanks and 10,000 APCs
- Russia has the second-largest fleet, with around 6,000 armored vehicles in service
- China has been rapidly increasing its armored vehicle capabilities in recent years, with a growing fleet of tanks and other armored vehicles
- Armored vehicles can weigh as much as 40 tons and have a top speed of up to 60 miles per hour
- Growing concerns about national security and internal conflicts, drives the armored vehicle market size
An armored vehicle is a type of military or security vehicle designed to provide protection to the occupants from various types of attacks such as ballistic, explosive, or mines. These vehicles can be used in a variety of situations such as military combat, law enforcement operations, and personal protection for high-profile individuals.
In recent years, the market for armored vehicles has grown significantly due to increasing geopolitical tensions, rising defense budgets, and the need for the modernization of existing military equipment. The demand for armored vehicles is expected to increase in the coming years, particularly in regions such as the Middle East, Asia Pacific, and Africa, where there are ongoing conflicts and security threats. Moreover, the rise in terrorist activities and organized crimes has also created a strong demand for armored vehicles for law enforcement agencies and private security firms.
In addition, the advancements in technology have led to the development of more advanced and sophisticated armored vehicles, which offer higher levels of protection, maneuverability, and firepower. The market for armored vehicles is expected to continue to grow in the future, driven by the increasing demand for these vehicles for military and non-military applications. However, the high cost of armored vehicles and the increasing focus on unmanned systems and drones may pose a challenge to the growth of the armored vehicle market value.
Global Armored Vehicle Market Trends
Market Drivers
- Increasing demand for armored vehicles in military and defense sectors
- Growing concerns about national security and internal conflicts
- The rising threat of terrorism and organized crime
- Advancements in technology led to the development of advanced armored vehicles
- Increasing focus on the modernization of military equipment
- Growing investments by governments in defense budgets
Market Restraints
- High cost of manufacturing and maintenance of armored vehicles
- Stringent government regulations regarding the export of armored vehicles
- Limited production capacity of armored vehicles
Market Opportunities
- Increasing use of armored vehicles in civilian applications such as transportation and mining
- Rising demand for lightweight and fuel-efficient armored vehicles
Armored Vehicle Market Report Coverage
| Market | Armored Vehicle Market |
| Armored Vehicle Market Size 2022 | USD 29.4 Billion |
| Armored Vehicle Market Forecast 2032 | USD 39.2 Billion |
| Armored Vehicle Market CAGR During 2023 - 2032 | 3% |
| Armored Vehicle Market Analysis Period | 2020 - 2032 |
| Armored Vehicle Market Base Year | 2022 |
| Armored Vehicle Market Forecast Data | 2023 - 2032 |
| Segments Covered | By Platform, By Mobility, By System, And By Geography |
| Regional Scope | North America, Europe, Asia Pacific, Latin America, and Middle East & Africa |
| Key Companies Profiled | BAE Systems, General Dynamics Corporation, IVECO Defence Vehicles, Krauss-Maffei Wegmann, L3Harris Technologies, Inc., Navistar Defense, Nexter Group, Oshkosh Defense, Rheinmetall AG, Science Applications International Corporation (SAIC), Textron Inc., and Thales Group. |
| Report Coverage |
Market Trends, Drivers, Restraints, Competitive Analysis, Player Profiling, Covid-19 Analysis, Regulation Analysis |
An armored vehicle is an automobile plated with armor plates. These are specialized vehicles that provide immunity to commuters from any kind of serious attacks and also facilitate integrated armed equipment in order to provide security. Presently, the armored vehicle market growth has been witnessing a certain downfall globally, despite of steady rise in new opportunities and budgets provided by the countries. Nonetheless, the market is anticipated to foresee a gradual uplift in its growth in the coming few years.
Furthermore, the climbing demands from non-combatant applications that include commercial applications are predicted to fuel the growth of armored vehicles in nearing future. In the past few years, the rate of terrorism and armed violence, such as the Paris attack, the 26/11 incident in India, Islamabad attacks among others have encouraged more civilians to opt for armored vehicles for commercial purposes. Also, looking at the scenario, the government and the VIPs, embassy officials, and banks worldwide are more focused on capitalizing on the procurement of advanced armored vehicles that comprise major vehicles such as Sedans, SUVs, Buses, Vans, and many more. These are the factors that are anticipated to escalate the growth of the armored vehicles market during the forecast period. Although, restricted budget allotment for national military expenses can hinder the growth of the market, specifically in Europe and North America. Despite it, the goodwill of the industry participants in the allotment of contracts can generate new opportunities for the market players in the future.
Armored Vehicle Market Segmentation
The global armored vehicle market segmentation is based on platform, mobility, system, and geography.
Armored Vehicle Market By Platform
- Combat Vehicles
- Infantry Fighting Vehicles
- Main Battle Tanks
- Armored Mortar Carriers
- Armored Amphibious Vehicles
- Armored Personal Carriers
- Light Armored Vehicles
- Mine-Resistant Ambush Protected Vehicles
- Air Defense Vehicles
- Self-Propelled Howitzers
- Combat Support Vehicles
- Repair and Recovery Vehicles
- Armored Command and Control Vehicles
- Armored Supply Trucks
- Others
- Unmanned Armored Ground Vehicles
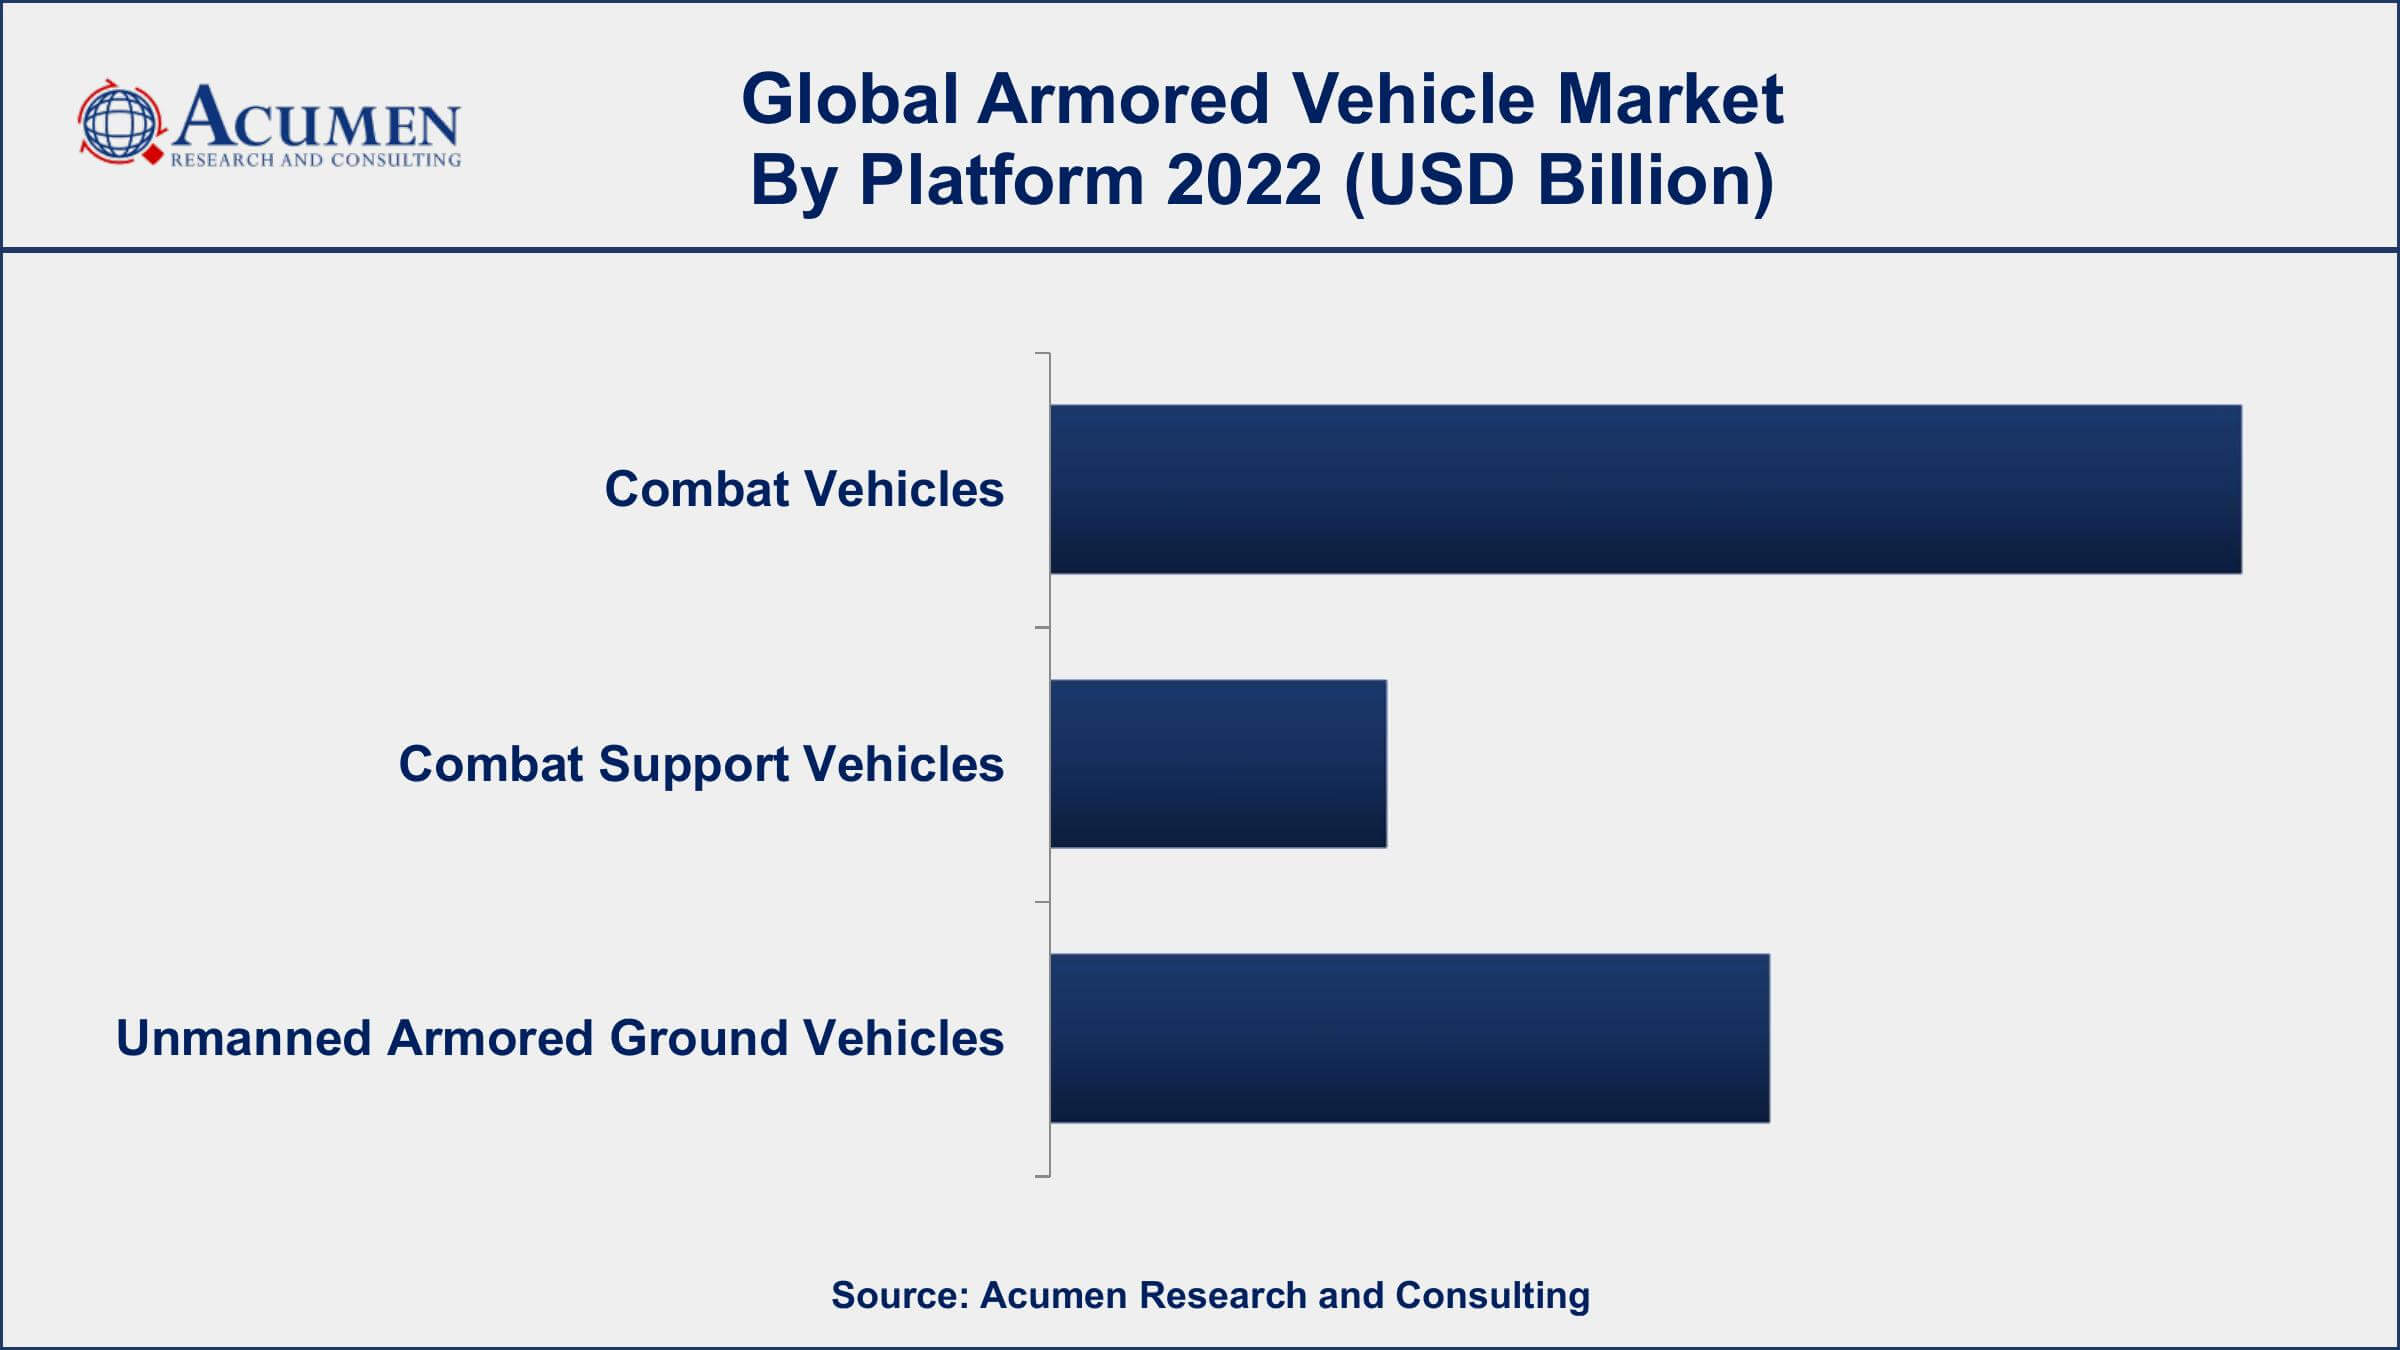
According to armored vehicle industry analysis, the combat vehicles segment accounted for the largest market share in 2022. Combat vehicles are designed and developed for use in military operations, with a focus on offensive and defensive capabilities. They are heavily armored and equipped with advanced weapons systems, communication equipment, and other technologies to ensure maximum performance and protection for the troops. The market for combat vehicles is driven by the increasing demand for advanced military equipment and the rising need for national security. Governments around the world are investing heavily in the development of combat vehicles to improve their military capabilities and protect their borders. The increasing use of combat vehicles in modern warfare is also driving market growth.
Armored Vehicle Market By Mobility
- Tracked
- Wheeled
In terms of mobility, the wheeled segment dominates the armored vehicle market in 2022. Wheeled armored vehicles offer higher speed, mobility, and maneuverability, making them suitable for a wide range of military and security applications. These vehicles are used for reconnaissance, border patrol, and security operations, among other things. The wheeled segment is driven by several factors, including the increasing demand for modern military equipment, rising internal conflicts and terrorism, and the need for border security. The growing demand for wheeled armored vehicles is also driven by their versatility and ability to operate in a variety of terrains, including urban environments.
Armored Vehicle Market By System
- Drive System
- Engine
- Turret Drives
- Ballistic Armor
- Fire Control Systems (FCS)
- Ammunition Handling System
- Countermeasure System
- Armaments
- Power System
- Command & Control (C2) System
- Observation & Display System
- Navigation System
- Hulls/Frames
According to the armored vehicle market forecast, the armaments segment in armored vehicles is expected to continue to grow in the coming years. This growth is driven by the increasing demand for modern military equipment and the advancements in technology. The armaments segment of the armored vehicle market includes vehicles that are equipped with advanced armament systems such as guns, missiles, and other weapons. These vehicles are designed for offensive and defensive capabilities and are used in a wide range of military operations. The market for armaments in armored vehicles is driven by several factors, including the increasing demand for modern military equipment, rising internal conflicts and terrorism, and the need for border security. The growing demand for armored vehicles with advanced armament systems is also driven by their ability to engage and neutralize enemy targets with greater accuracy and precision.
Armored Vehicle Market Regional Outlook
North America
- U.S.
- Canada
Europe
- U.K.
- Germany
- France
- Spain
- Rest of Europe
Asia-Pacific
- India
- Japan
- China
- Australia
- South Korea
- Rest of Asia-Pacific
Latin America
- Brazil
- Mexico
- Rest of Latin America
The Middle East & Africa
- South Africa
- GCC Countries
- Rest of the Middle East & Africa (ME&A)
Armored Vehicle Market Regional Analysis
North America dominates the armored vehicle market due to several factors, including its large military budget, technological advancements, and strong defense industry. The United States, in particular, is the largest market for armored vehicles in North America, with a significant portion of its military budget allocated toward the acquisition and development of advanced military equipment, including armored vehicles. The US also has a strong defense industry, with major players such as General Dynamics and Lockheed Martin developing and manufacturing advanced armored vehicles.
Another factor contributing to North America's dominance in the armored vehicle market is the high level of technological advancement in the region. The US and Canada are home to some of the world's most advanced technology companies, which have developed cutting-edge technologies for use in armored vehicles. These technologies include advanced materials, sensors, and communication systems, which have greatly enhanced the capabilities of armored vehicles.
Armored Vehicle Market Player
Some of the top armored vehicle market companies offered in the professional report include BAE Systems, General Dynamics Corporation, IVECO Defence Vehicles, Krauss-Maffei Wegmann, L3Harris Technologies, Inc., Navistar Defense, Nexter Group, Oshkosh Defense, Rheinmetall AG, Science Applications International Corporation (SAIC), Textron Inc., and Thales Group.
Frequently Asked Questions
What was the market size of the global armored vehicle in 2022?
The market size of armored vehicle was USD 29.4 Billion in 2022.
What is the CAGR of the global armored vehicle market during forecast period of 2023 to 2032?
The CAGR of armored vehicle market is 3% during the analysis period of 2023 to 2032.
Which are the key players operating in the market?
The key players operating in the global armored vehicle market are BAE Systems, General Dynamics Corporation, IVECO Defence Vehicles, Krauss-Maffei Wegmann, L3Harris Technologies, Inc., Navistar Defense, Nexter Group, Oshkosh Defense, Rheinmetall AG, Science Applications International Corporation (SAIC), Textron Inc., and Thales Group.
Which region held the dominating position in the global armored vehicle market?
North America held the dominating position in armored vehicle market during the analysis period of 2023 to 2032.
Which region registered the fastest growing CAGR for the forecast period of 2023 to 2032?
Asia-Pacific region exhibited fastest growing CAGR for armored vehicle market during the analysis period of 2023 to 2032.
What are the current trends and dynamics in the global armored vehicle market?
The current trends and dynamics in the armored vehicle industry include the rising threat of terrorism and organized crime, and increasing focus on the modernization of military equipment.
Which platform held the maximum share in 2022?
The combat vehicles platform held the maximum share of the armored vehicle market.


