Anticoagulants Market | Acumen Research and Consulting
Anticoagulants Market Size - Global Industry, Share, Analysis, Trends and Forecast 2024 - 2032
Published :
Report ID:
Pages :
Format :
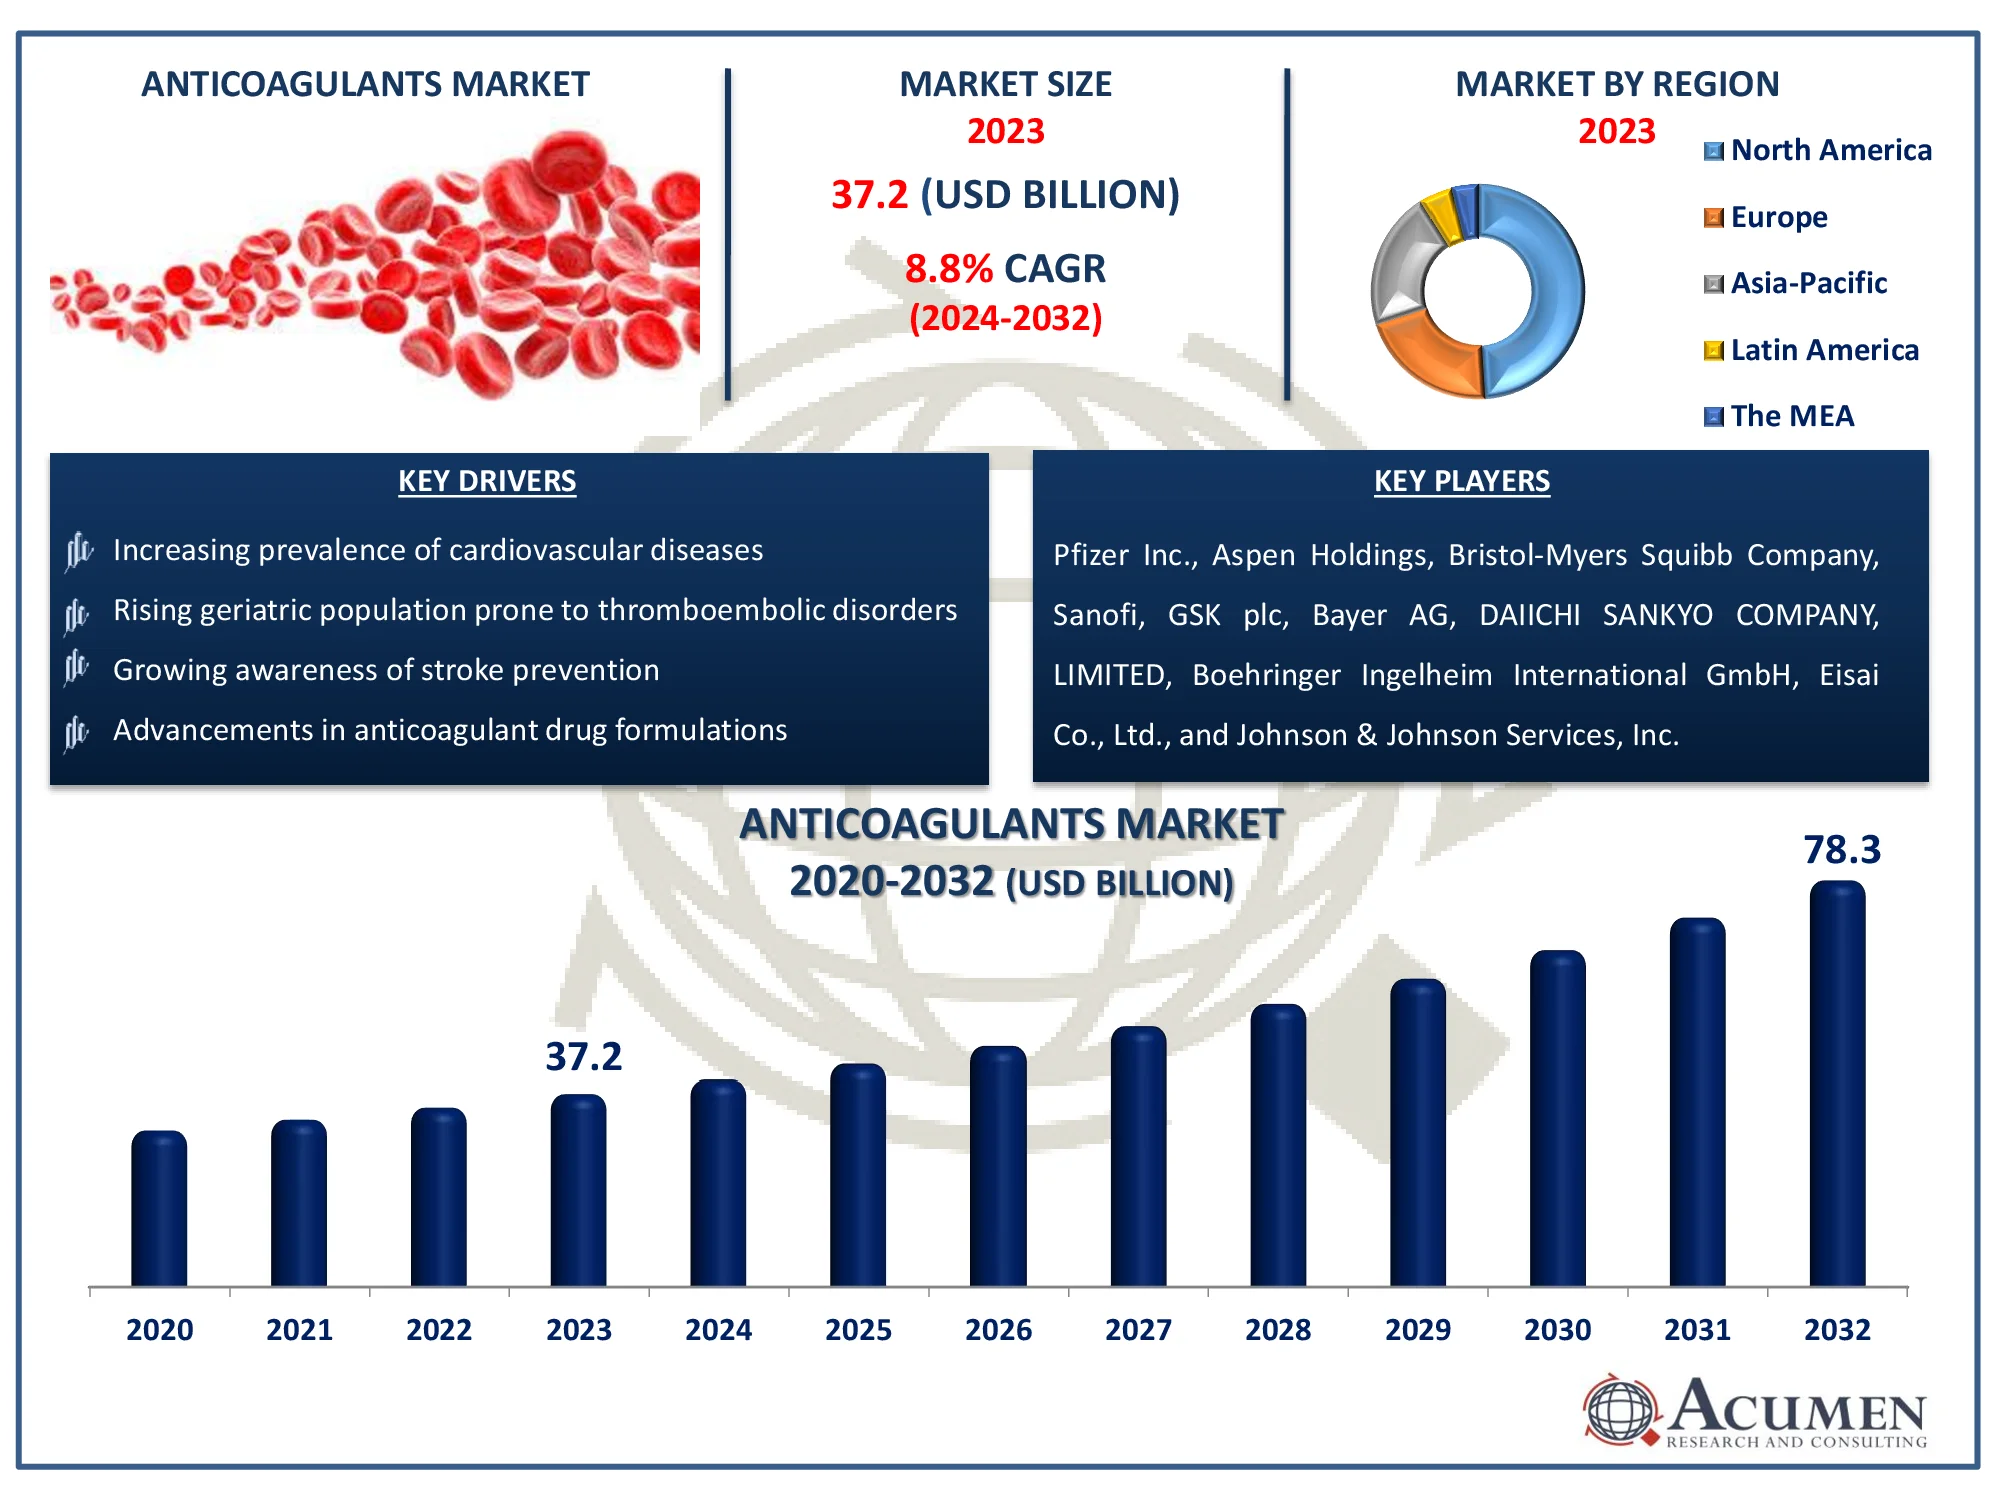
The Global Anticoagulants Market Size accounted for USD 37.2 Billion in 2023 and is estimated to achieve a market size of USD 78.3 Billion by 2032 growing at a CAGR of 8.8% from 2024 to 2032.
Anticoagulants Market Highlights
- Global anticoagulants market revenue is poised to garner USD 78.3 billion by 2032 with a CAGR of 8.8% from 2024 to 2032
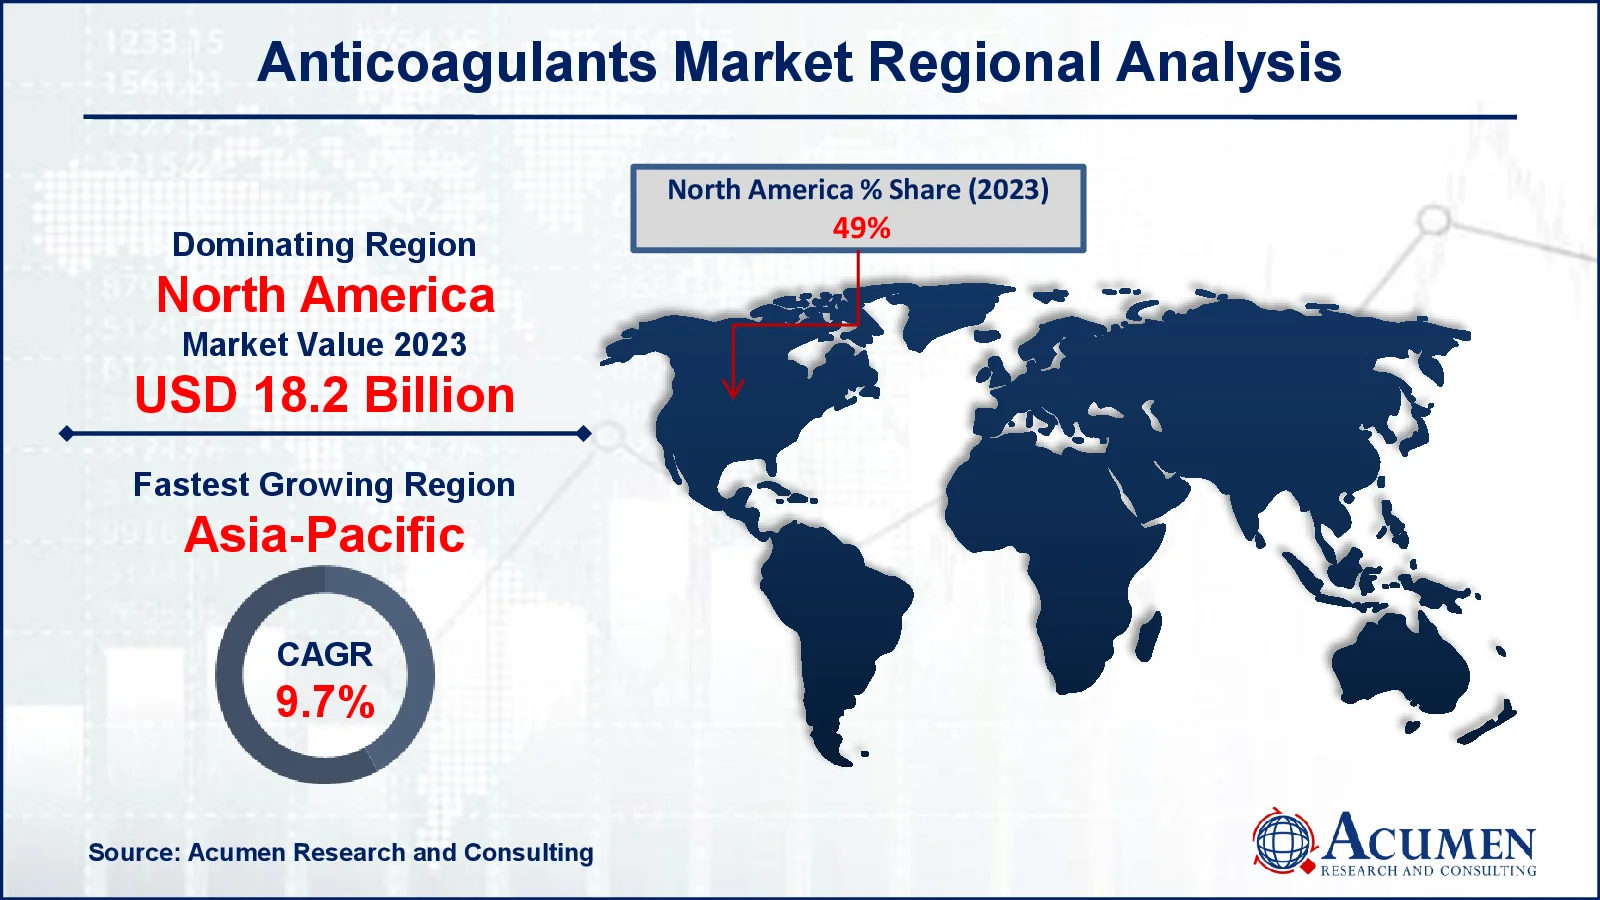
- North America anticoagulants market value occupied around USD 18.2 billion in 2023
- Asia-Pacific anticoagulants market growth will record a CAGR of more than 9.7% from 2024 to 2032
- Among drug class, the factor XA inhibitors (NOAC/DOAC) sub-segment generated more than USD 20.5 billion revenue in 2023
- Based on application, the pulmonary embolism sub-segment generated around 73% market anticoagulants share in 2023
- Increasing investment in anticoagulant research and development is a popular anticoagulants market trend that fuels the industry demand

Anticoagulants are medications that prevent blood clots from forming or growing larger by inhibiting the body's clotting process. They are commonly prescribed for individuals at risk of conditions such as deep vein thrombosis, pulmonary embolism, and stroke, especially in patients with atrial fibrillation or those who have undergone surgeries like hip or knee replacements. Anticoagulants work by targeting various factors in the blood clotting cascade, with common types including warfarin, heparin, and newer direct oral anticoagulants (DOACs) like rivaroxaban and apixaban. While effective in reducing the risk of dangerous clots, they carry a risk of bleeding complications, so their use requires careful monitoring, especially in patients with certain medical conditions or those taking other medications.
Global Anticoagulants Market Dynamics
Market Drivers
- Increasing prevalence of cardiovascular diseases
- Rising geriatric population prone to thromboembolic disorders
- Growing awareness of stroke prevention
- Advancements in anticoagulant drug formulations
Market Restraints
- High cost of novel anticoagulant therapies
- Risk of bleeding complications associated with anticoagulants
- Stringent regulatory approval processes
Market Opportunities
- Development of safer and more effective anticoagulants
- Expansion of anticoagulant use in emerging markets
- Growing demand for personalized anticoagulation therapy
Anticoagulants Market Report Coverage
|
Market |
Anticoagulants Market |
|
Anticoagulants Market Size 2023 |
USD 37.2 Billion |
|
Anticoagulants Market Forecast 2032 |
USD 78.3 Billion |
|
Anticoagulants Market CAGR During 2024 - 2032 |
8.8% |
|
Anticoagulants Market Analysis Period |
2020 - 2032 |
|
Anticoagulants Market Base Year |
2023 |
|
Anticoagulants Market Forecast Data |
2024 - 2032 |
|
Segments Covered |
By Route of Administration, By Drug Class, By Application, By Distribution Channel, and By Geography |
|
Regional Scope |
North America, Europe, Asia Pacific, Latin America, and Middle East & Africa |
|
Key Companies Profiled |
Pfizer Inc., Aspen Holdings, Bristol-Myers Squibb Company, Sanofi, GSK plc, Bayer AG, DAIICHI SANKYO COMPANY, LIMITED, Boehringer Ingelheim International GmbH, Eisai Co., Ltd., and Johnson & Johnson Services, Inc. |
|
Report Coverage |
Market Trends, Drivers, Restraints, Competitive Analysis, Player Profiling, Covid-19 Analysis, Regulation Analysis |
Anticoagulants Market Insights
Growing need for controlling the diseases such as kidney diseases and cardiovascular diseases is expected to propel the market growth over forecast period. In addition to this, rise in obesity patient and hence related disorders is another factor which is ultimately boosting the adoption of anticoagulants in the healthcare areas and hence driving the market growth.
The worldwide anticoagulants market is anticipated to show significant growth during the forecast period, due to the increasing prevalence of cardiovascular disorders, venous thromboembolism (VTE), and others. Also, increasing adoption of novel oral anticoagulants (NOACs), and rising awareness of NOACs and it’s benefits in the emerging regions are boosting the market growth. The increasing obesity issues and rising population of elderly people, and rise in demand of novel therapeutics are some of the other factors driving the market growth. On the other hand, higher price of NOACs and lack of awareness about the anticoagulants to hamper the market growth.
The anticoagulant are drugs which functions as a blood thinners. The anticoagulants are used for preventing or reducing the coagulation of blood also used to prolong the blood clotting time. These drugs are majorly used for high risk of blood clots in various medical conditions. The importance of anticoagulants in preventing the clot formation in the human body is foreseen to be prime factor driving the market growth. Also, anticoagulants are used in the prevention of enlargement of the existing clots in the vein or arteries so that the health hazards are reduced to significant level.
Such properties of anticoagulants are making them one of the irreplaceable part in the operational areas associated with the heart attack, stroke, deep venous thrombosis (DVT), pulmonary embolism (PE), angina, dialysis, atrial fibrillation (AF), thrombocytopenia, and myocardial infarction. In addition, anticoagulants plays an outstanding role while performing the surgery. The anticoagulants anre used for preventing or redducing the coagualtion of blood also used to prolong the blood clotting time.
The anticoagulants are used for preventing or reducing the coagulation of blood also used to prolong the blood clotting time.
Anticoagulants Market Segmentation
The worldwide market for anticoagulants is split based on route of administration, drug class, application, distribution channel, and geography.
Anticoagulant Market By Route of Administration
- Oral
- Injectable
According to anticoagulants industry analysis, among the two routes of administration, oral anticoagulants are the largest subsegment due to patient preference for ease of use. Oral anticoagulants, such as Factor Xa inhibitors, have gained traction because they are convenient, do not require regular hospital visits for administration, and are easy to manage for long-term conditions. Additionally, oral drugs allow for better compliance and are increasingly prescribed for chronic conditions like atrial fibrillation and deep vein thrombosis (DVT). This has led to their dominance over injectables, which, although effective, require professional administration, making them less appealing for long-term use. The rapid adoption of direct oral anticoagulants (DOACs) has further propelled this subsegment's growth.
Anticoagulant Market By Drug Class
- Factor XA Inhibitors (NOAC/DOAC)
- Heparins
- Direct Thrombin Inhibitors
- Vitamin K Antagonists
Within the drug class segment, Factor Xa inhibitors (NOAC/DOAC) dominate. These drugs have seen significant growth due to their efficacy, safety profile, and convenience over traditional options like Vitamin K antagonists. They offer predictable pharmacokinetics, reducing the need for frequent blood monitoring, which is a major drawback of older anticoagulants like warfarin. Factor Xa inhibitors are also associated with fewer dietary restrictions and lower risk of adverse reactions. The rise of NOACs/DOACs has been fueled by their increased use in conditions such as atrial fibrillation and DVT, where they provide better outcomes and patient adherence, solidifying their position as the largest subsegment.
Anticoagulant Market By Applications
- Deep Vein Thrombosis (DVT)
- Atrial Fibrillation/Myocardial Infarction (Heart Attack)
- Pulmonary Embolism
- Others
In terms of application, the pulmonary embolism segment is leading in the industry, also the atrial fibrillation (AF)/myocardial infarction (MI) is the notable subsegment. The high prevalence of AF, particularly among the aging population, significantly drives the demand for anticoagulants. These conditions are major risk factors for thromboembolic events such as strokes, necessitating long-term anticoagulation therapy. With millions affected globally, the use of anticoagulants in managing AF has outpaced other applications like DVT and pulmonary embolism. The necessity for continuous anticoagulation to reduce stroke risk in AF patients has bolstered this subsegment, with ongoing innovations in drug formulations enhancing patient outcomes and further expanding its market share.
Anticoagulant Market By Distribution Channels
- Hospital Pharmacies
- Retail Pharmacies
- Online Pharmacies
Retail pharmacies represent the leading subsegment within the distribution channel category. As anticoagulants are often prescribed for chronic conditions that require long-term treatment, retail pharmacies offer the convenience of refilling prescriptions without frequent hospital visits. The accessibility and widespread presence of retail pharmacies ensure that patients have continuous access to their medications, contributing to the dominance of this subsegment. Hospital pharmacies are essential for acute settings and initial prescriptions, but retail pharmacies take over for long-term management. Additionally, the rise in generic versions of anticoagulants has further increased their availability in retail outlets, making them the preferred option for patients.
Anticoagulants Market Regional Outlook
North America
- U.S.
- Canada
Europe
- U.K.
- Germany
- France
- Spain
- Rest of Europe
Asia-Pacific
- India
- Japan
- China
- Australia
- South Korea
- Rest of Asia-Pacific
Latin America
- Brazil
- Mexico
- Rest of LATAM
The Middle East & Africa
- South Africa
- GCC Countries
- Rest of the Middle East & Africa (ME&A)

Anticoagulants Market Regional Analysis
In terms of anticoagulants market analysis, the North America was the dominant region in the year 2023 and the similar trend is expected to continue over forecast period due to rapid increase in the surgeries such as hip and knee surgeries in this region. Europe region is following the North America in terms of demand for anticoagulants. Increase in geriatric population is expected to be one of the key factors boosting the demand for anticoagulant in this region.
On the other hand, APAC region is expected to register significant CAGR growth rate over anticoagulants market forecast period. The increasing health issues due to changing lifestyle as well as increasing surgical operations in this region are some of the prime factors accelerating the demand for anticoagulants in this region. Also, increasing network of healthcare facilities is expected to be another factor creating a demand for anticoagulants.
Anticoagulants Market Players
Some of the top anticoagulants companies offered in our report include Pfizer Inc., Aspen Holdings, Bristol-Myers Squibb Company, Sanofi, GSK plc, Bayer AG, DAIICHI SANKYO COMPANY, LIMITED, Boehringer Ingelheim International GmbH, Eisai Co., Ltd., and Johnson & Johnson Services, Inc.
Frequently Asked Questions
How big is the anticoagulants market?
The anticoagulants market size was valued at USD 37.2 billion in 2023.
What is the CAGR of the global anticoagulants market from 2024 to 2032?
The CAGR of anticoagulants is 8.8% during the analysis period of 2024 to 2032.
Which are the key players in the anticoagulants market?
The key players operating in the global market are including Pfizer Inc., Aspen Holdings, Bristol-Myers Squibb Company, Sanofi, GSK plc, Bayer AG, DAIICHI SANKYO COMPANY, LIMITED, Boehringer Ingelheim International GmbH, Eisai Co., Ltd., and Johnson & Johnson Services, Inc.
Which region dominated the global anticoagulants market share?
North America held the dominating position in anticoagulants industry during the analysis period of 2024 to 2032.
Which region registered fastest CAGR from 2024 to 2032?
Asia-Pacific region exhibited fastest growing CAGR for market of anticoagulants during the analysis period of 2024 to 2032.
What are the current trends and dynamics in the global anticoagulants industry?
The current trends and dynamics in the anticoagulants industry include increasing prevalence of cardiovascular diseases, rising geriatric population prone to thromboembolic disorders, growing awareness of stroke prevention, and advancements in anticoagulant drug formulations.
Which drug class held the maximum share in 2023?
The factor XA inhibitors (NOAC/DOAC) drug class held the maximum share of the anticoagulants industry.


