Anti-Rheumatics Market Size - Global Industry, Share, Analysis, Trends and Forecast 2023 - 2032
Published :
Report ID:
Pages :
Format :
Anti-Rheumatics Market Size - Global Industry, Share, Analysis, Trends and Forecast 2023 - 2032
Report Coverage
- Industry Dynamics
- Market Size and Forecast Data
- Segment Analysis
- Competitive Landscape
- Regional Analysis with a Niche Focus on Country-Level Data
- High Level Analysis - Porter's, PESTEL, Value Chain, etc.
- Company Profiles of Key Players
- Option to Customize the Report As Per Your Specific Need
Request Sample Report
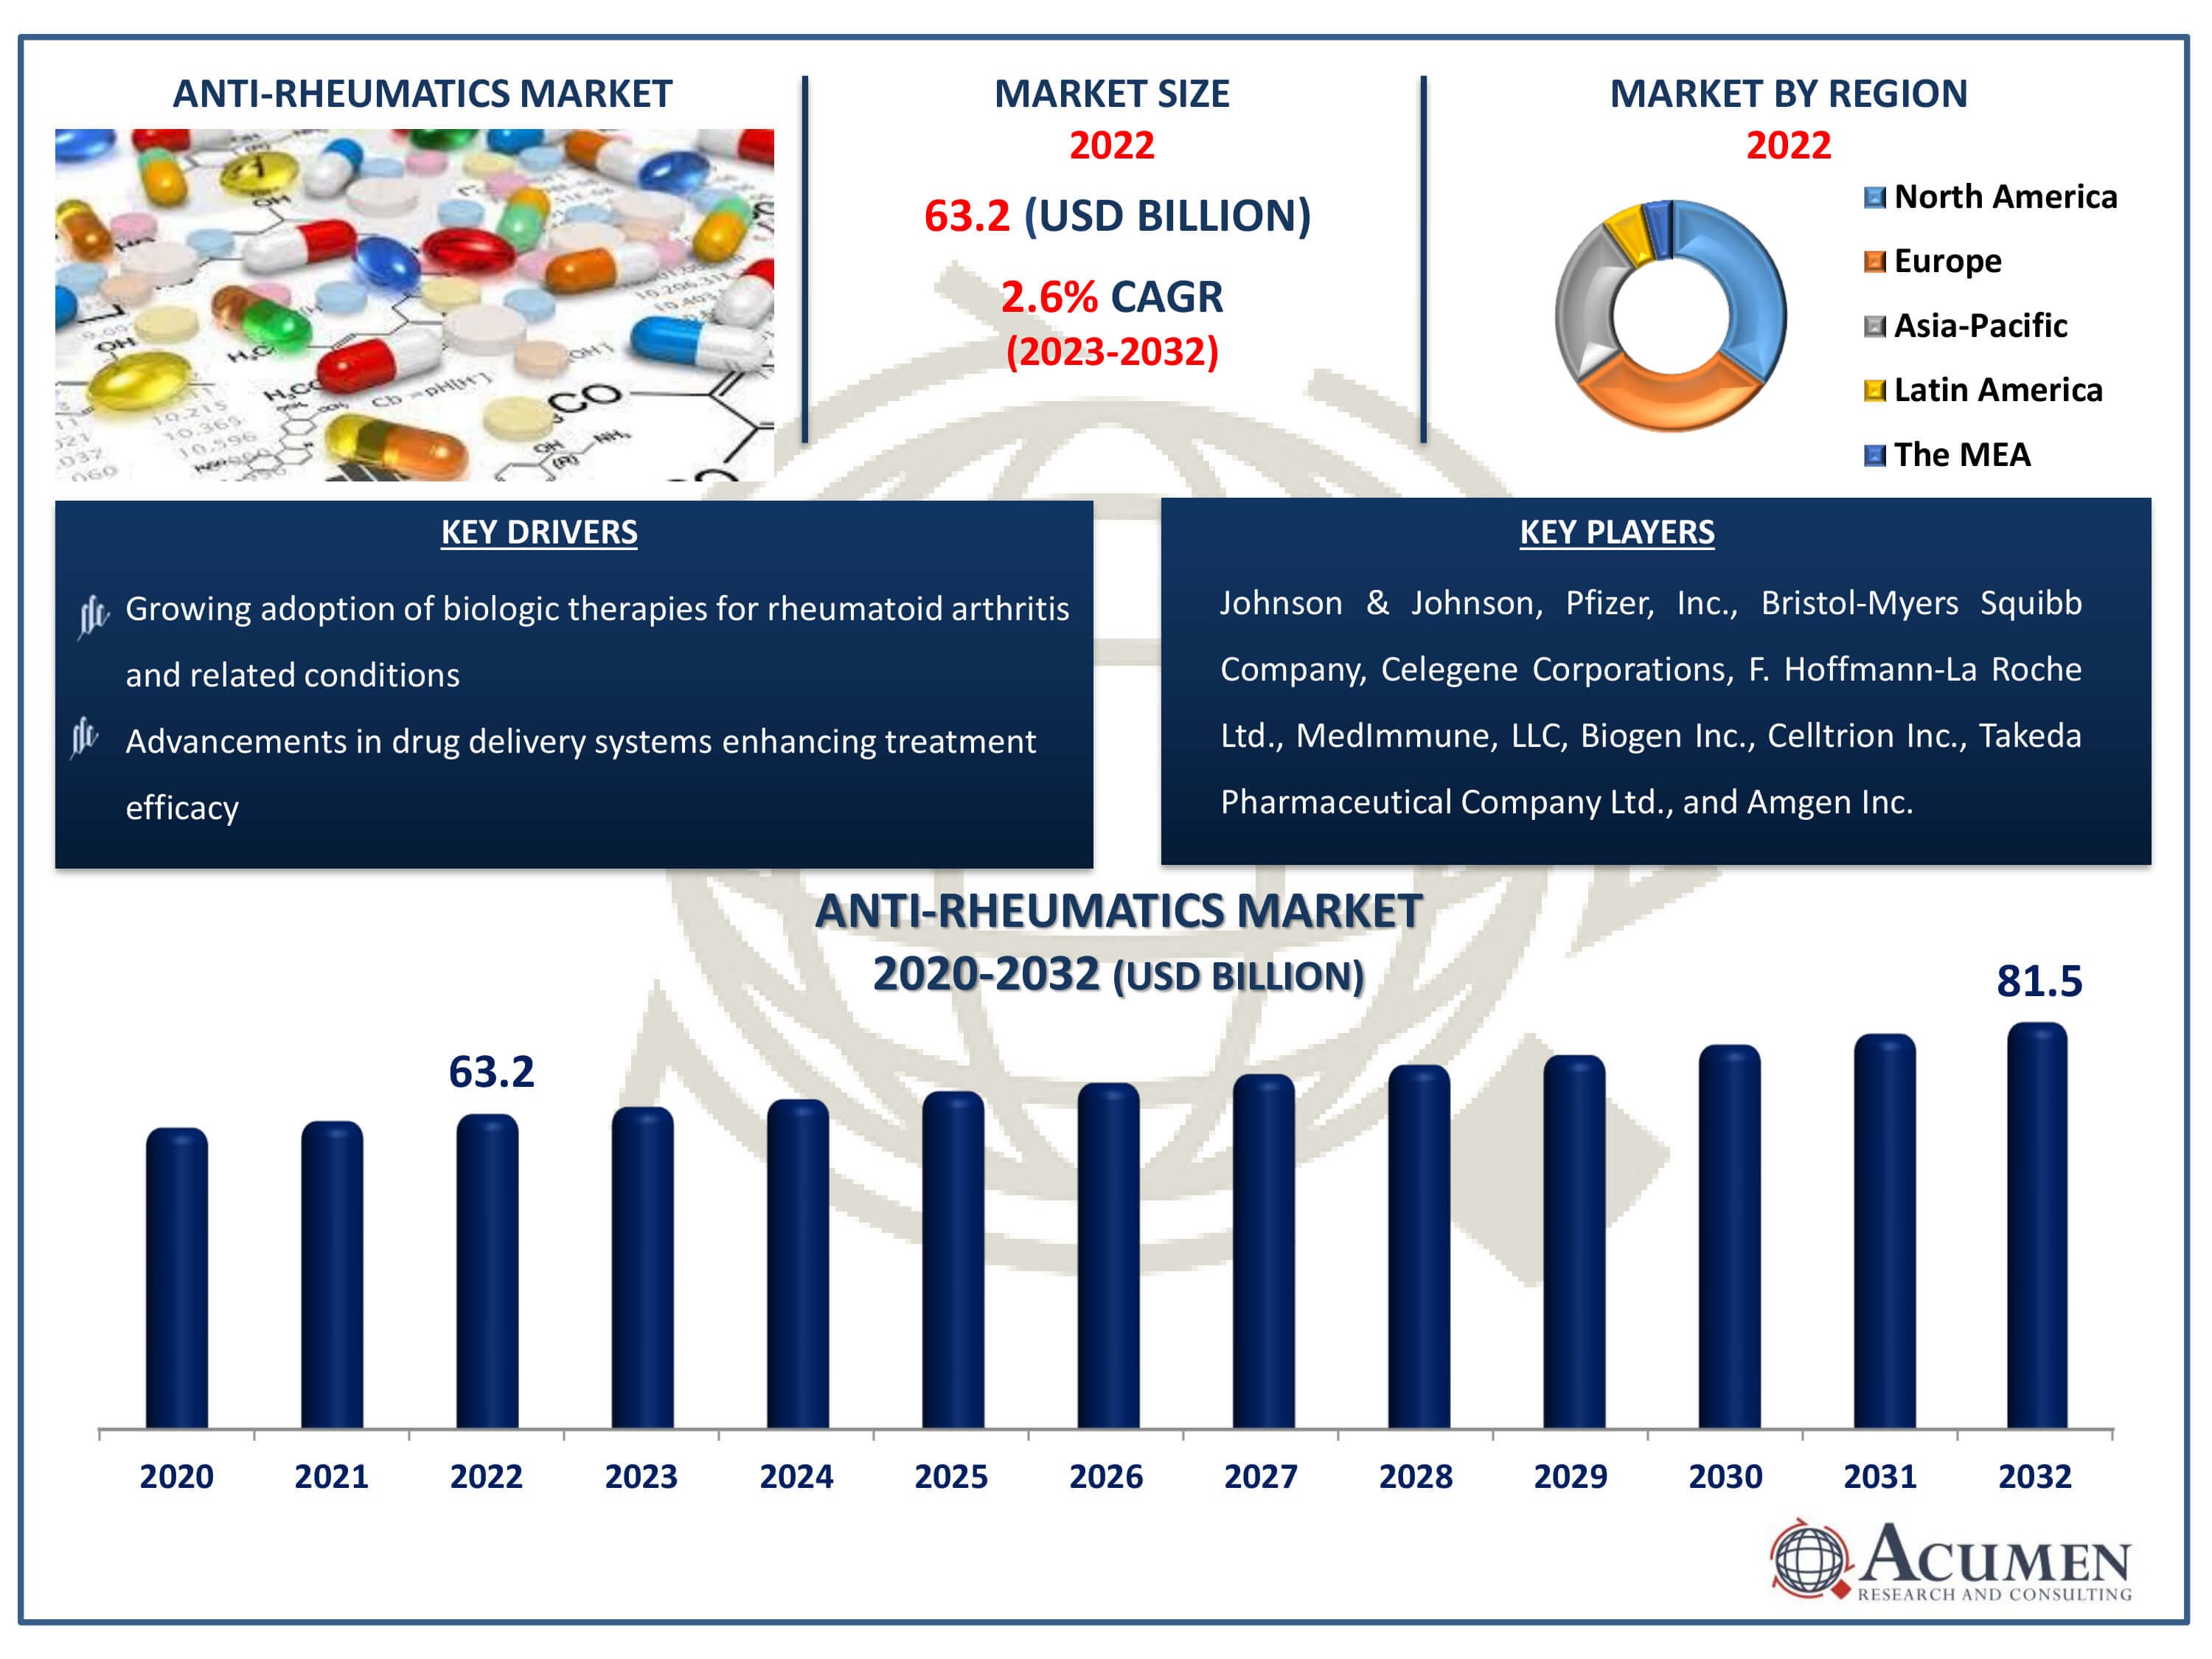
The Anti-Rheumatics Market Size accounted for USD 63.2 Billion in 2022 and is estimated to achieve a market size of USD 81.5 Billion by 2032 growing at a CAGR of 2.6% from 2023 to 2032.
Anti-Rheumatics Market Highlights
- Global anti-rheumatics market revenue is poised to garner USD 81.5 billion by 2032 with a CAGR of 2.6% from 2023 to 2032
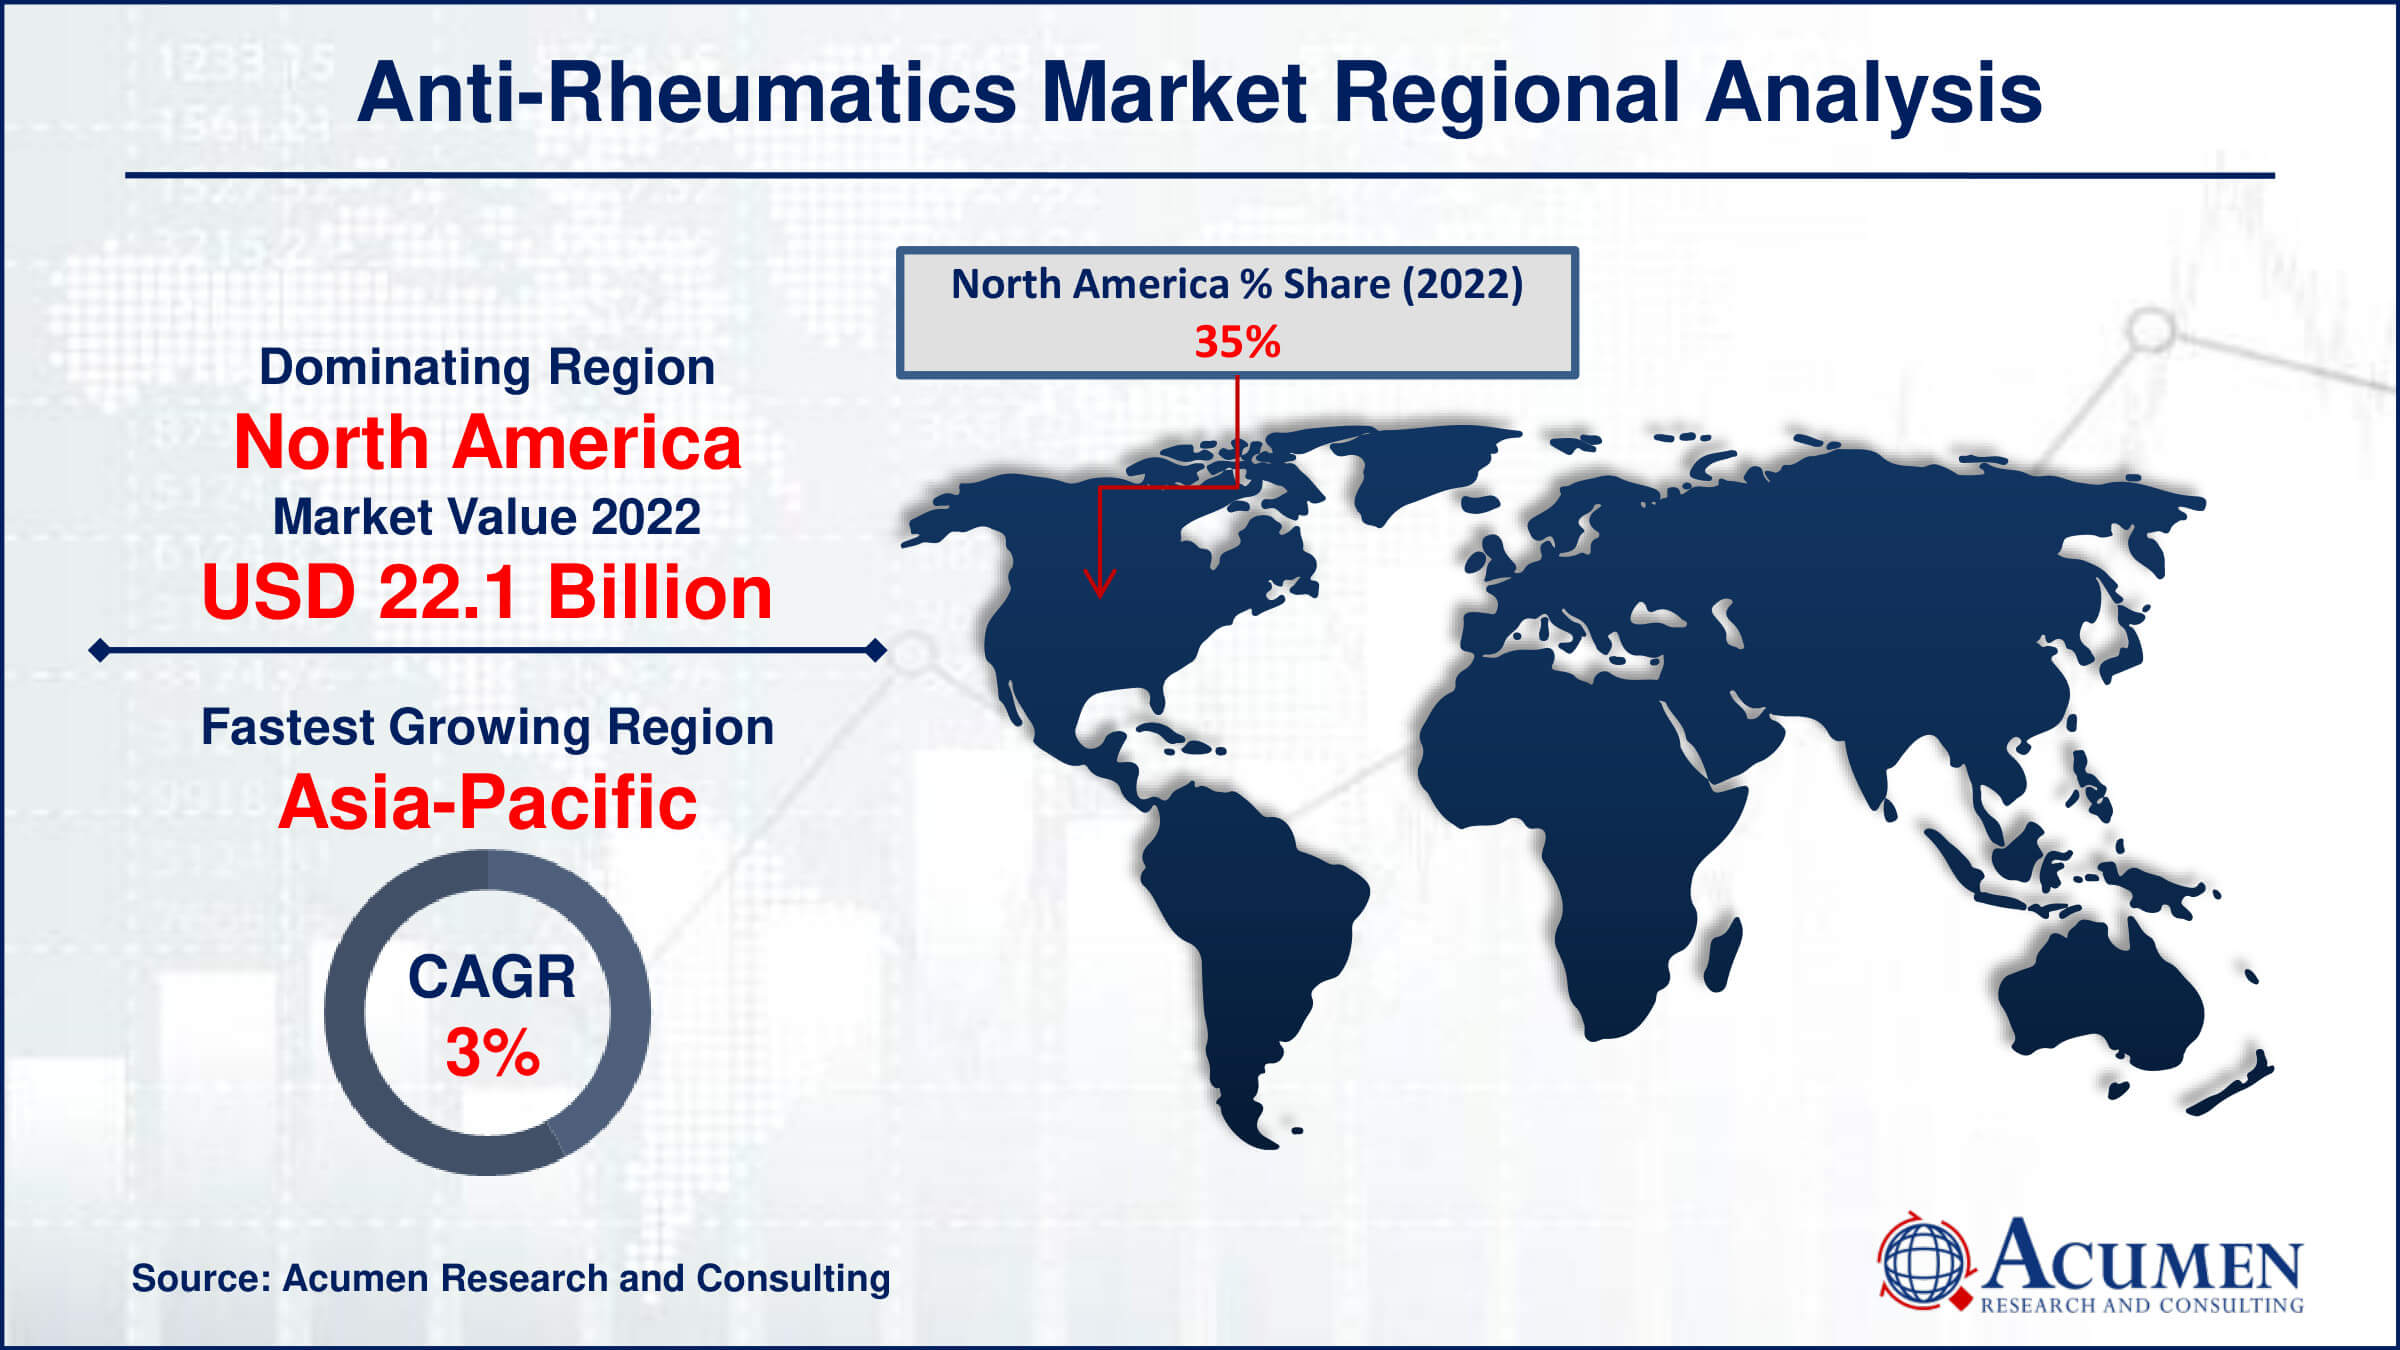
- North America anti-rheumatics market value occupied around USD 22.1 billion in 2022
- Asia-Pacific anti-rheumatics market growth will record a CAGR of more than 3% from 2023 to 2032
- Among type, the prescription-based drugs sub-segment generated more than USD 37.9 billion revenue in 2022
- Based on distribution channel, the hospital pharmacies sub-segment generated around 45% market share in 2022
- Integration of telemedicine for improved access to rheumatic care is a popular anti-rheumatics market trend that fuels the industry demand

Treatment for rheumatic diseases is a multidisciplinary specialty that deals with a range of conditions that affect the limbs, cartilage, ligaments, tendons, muscles, and bones. These conditions are characterized by reduced activity and persistent discomfort. Although the main strategy is to use generic pain management medicines, their effectiveness is still restricted because there aren't any effective treatments for the common indications at this time. This deficiency therefore greatly aggravates patients as well as healthcare professionals, highlighting the vital necessity for the creation of cutting-edge disease-modifying medications. With the potential to both reduce symptoms and change the course of the disease, these medications, which attempt to address the underlying pathophysiology of rheumatic diseases, provide renewed hope for better patient outcomes and quality of life. Therefore, it is critical to continue research projects and develop novel treatment approaches in order to meet the unmet requirements of those suffering from rheumatic illnesses.
Global Anti-Rheumatics Market Dynamics
Market Drivers
- Increasing prevalence of rheumatic diseases globally
- Growing adoption of biologic therapies for rheumatoid arthritis and related conditions
- Advancements in drug delivery systems enhancing treatment efficacy
- Rising geriatric population prone to rheumatic ailments
Market Restraints
- High cost associated with biologic drugs limiting accessibility
- Stringent regulatory requirements for drug approval
- Potential side effects and safety concerns associated with anti-rheumatic medications
Market Opportunities
- Expanding research into novel targets for rheumatic disease treatment
- Emerging markets presenting untapped growth opportunities
- Development of biosimilar drugs offering cost-effective alternatives
Anti-Rheumatics Market Report Coverage
| Market | Anti-Rheumatics Market |
| Anti-Rheumatics Market Size 2022 | USD 63.2 Billion |
| Anti-Rheumatics Market Forecast 2032 | USD 81.5 Billion |
| Anti-Rheumatics Market CAGR During 2023 - 2032 | 2.6% |
| Anti-Rheumatics Market Analysis Period | 2020 - 2032 |
| Anti-Rheumatics Market Base Year |
2022 |
| Anti-Rheumatics Market Forecast Data | 2023 - 2032 |
| Segments Covered | By Drug Class, By Type, By Distribution Channel, By End-User, And By Geography |
| Regional Scope | North America, Europe, Asia Pacific, Latin America, and Middle East & Africa |
| Key Companies Profiled | Johnson & Johnson, Pfizer, Inc., Bristol-Myers Squibb Company, Celegene Corporations, F. Hoffmann-La Roche Ltd., MedImmune, LLC, Biogen Inc., Celltrion Inc., Takeda Pharmaceutical Company Ltd., and Amgen Inc. |
| Report Coverage |
Market Trends, Drivers, Restraints, Competitive Analysis, Player Profiling, Covid-19 Analysis, Regulation Analysis |
Anti-Rheumatics Market Insights
The growth of rheumatoid arthritis and the aging population worldwide are significant drivers in propelling the development of the global rheumatic industry. Another substantial factor contributing to the expansion of the anti-rheumatic industry is the increasing prevalence of malnutrition in various regions. However, market development faces challenges such as adverse drug-related effects and the escalating costs associated with biologics and biosimilars. Despite these hurdles, biosimilars and other biological technologies are anticipated to offer lucrative growth opportunities for the anti-rheumatic market.
One significant barrier to entry in the anti-rheumatoid arthritis market is the high cost of biologic medications, which many patients cannot afford. Despite being very successful in treating rheumatic disorders, biologic treatments can be expensive to produce and develop. Patients may face severe financial hardships as a result, particularly in areas with inadequate healthcare services or coverage. Consequently, access to these cutting-edge treatment choices may be difficult for a significant segment of the patient population, impeding optimum disease management and exacerbating inequities in healthcare outcomes.
There are several chances for research and development activities focused on finding new therapeutic targets and treatment techniques in the anti-rheumatoid arthritis industry. Pharma firms may be able to open up new paths for more individualized and successful therapies for rheumatic disorders by investing in cutting-edge strategies like tailored drug delivery systems and precision medicine. Furthermore, advances in genetics and biotechnology present opportunities for the creation of customized treatments that target the underlying causes of rheumatic illnesses, enhancing patient outcomes and quality of life.
Rising healthcare spending, growing healthcare awareness, and rising disposable incomes are all contributing factors to the anti-rheumatic drug market's strong growth prospects in emerging economies. Countries in regions such as Asia-Pacific, Latin America, and the Middle East are witnessing a growing prevalence of rheumatic disorders due to demographic shifts and changing lifestyles. A favorable environment for market development is created by this demographic trend, more access to healthcare services, and an increasing need for cutting-edge treatment alternatives. Pharma firms may take advantage of the unrealized potential and drive additional growth in the anti-rheumatism industry by carefully focusing on these developing regions and customizing product offers to suit regional demands and preferences.
Anti-Rheumatics Market Segmentation
The worldwide market for anti-rheumatics is split based on drug class, type, distribution channel, end-user, and geography.
Anti-Rheumatics Drug Classes
- Disease Modifying Anti-rheumatics Drugs (DMARD’S)
- Nonsteroidal Anti-inflammatory Drugs (NSAID’S)
- Corticosteroids
- Uric Acid Drugs
- Others
According to anti-rheumatics industry analysis, the disease modifying anti-rheumatic drugs (DMARDs) is the largest sector because of its critical role in treating chronic inflammatory disorders such as rheumatoid arthritis. Instead of only treating symptoms, DMARDs work by changing the underlying illness process. Since they delay the advancement of the illness and maintain joint function, they are regarded as the cornerstone of treatment for rheumatic disorders, providing long-term benefits. DMARDs continue to be the first option for rheumatologists globally due to their efficaciousness in enhancing patient outcomes and decreasing disability, which has led to their substantial market presence.
Anti-Rheumatics Types
- Prescription-Based Drugs
- Over-The-Counter Drugs
For a number of reasons, the prescription-based drugs category has the maximum share of the market and it is expected to grow over the anti-rheumatics industry forecast period. First of all, patients with rheumatic disorders frequently need individualized treatment plans based on their unique condition and medical background, which makes the experience of healthcare experts essential for accurate diagnosis and prescription writing. Second, because many anti-rheumatic drugs including biologics and disease-modifying medications are strong, it's important to regulate their use and their adverse effects through prescription-based channels. Prescription-based medications are also more readily available and more reasonably priced for patients due to insurance coverage, which furthers their market dominance.
Anti-Rheumatics Distribution Channels
- Retail Pharmacies
- Online Pharmacies
- Hospital Pharmacies
There are several reasons why hospital pharmacies are the top distribution channel in the anti-rheumatoid arthritis industry. Hospitals are the first choice for the diagnosis and treatment of rheumatic disorders because they offer both inpatients and outpatients access to a large variety of anti-rheumatic drugs. Hospital pharmacies are also well-equipped with specialized rheumatology departments manned by medical personnel with the expertise to customise treatment regimens to meet the specific needs of clients. Hospitals are also outfitted to manage complicated situations that call for sophisticated drugs and treatments, which increases the market for antirheumatics. Hospital pharmacies are the go-to option for many people undergoing rheumatoid arthritis therapy because of their extensive offerings, knowledge, and accessibility.
Anti-Rheumatics End-Users
- Hospitals & Clinics
- Ambulatory Surgical Centers
- Healthcare Specialty Process
In terms of market analysis, hospitals & clinics is the top end-user sector. Patients seeking rheumatic disease diagnosis, treatment, and management typically make their way to hospitals or clinics. They provide all-encompassing care, which includes access to a variety of anti-rheumatic drugs, diagnostic testing, and consultations with rheumatologists. Furthermore, hospitals frequently have dedicated rheumatology departments with state-of-the-art equipment and infrastructure for delivering sophisticated medical treatments including infusion therapy and biologics. Hospitals and clinics are the major choice for addressing rheumatic disorders due to their extensive and specialised services, however ambulatory surgical centres and healthcare specialist procedures also have important roles to play.
Anti-Rheumatics Market Regional Outlook
North America
- U.S.
- Canada
Europe
- U.K.
- Germany
- France
- Spain
- Rest of Europe
Asia-Pacific
- India
- Japan
- China
- Australia
- South Korea
- Rest of Asia-Pacific
Latin America
- Brazil
- Mexico
- Rest of Latin America
The Middle East & Africa
- South Africa
- GCC Countries
- Rest of the Middle East & Africa (ME&A)

Anti-Rheumatics Market Regional Analysis
In 2022, North America held the biggest market share in the global industry; this trend is anticipated to be true over the course of the anti-rheumatics market forecast period. The ageing population in North America is a significant driver of the market's expansion for anti-rheumatic medications. Rheumatoid arthritis is more common in the aged population, which increases the need for anti-rheumatic drugs and therapies. On the other hand, it is anticipated that during the course of the forecast period, anti-rheumatics awareness would rise most significantly in the Asia-Pacific area. The vibrant and changing life science sector, especially in developing nations like Malaysia, China, and India, is what is driving this expansion. The swift economic progress in these nations, along with improvements in healthcare facilities and heightened availability of medical data, has led to a surge in the recognition and use of antirheumatic medications.
Anti-Rheumatics Market Players
Some of the top anti-rheumatics companies offered in our report includes Johnson & Johnson, Pfizer, Inc., Bristol-Myers Squibb Company, Celegene Corporations, F. Hoffmann-La Roche Ltd., MedImmune, LLC, Biogen Inc., Celltrion Inc., Takeda Pharmaceutical Company Ltd., and Amgen Inc.
Frequently Asked Questions
How big is the anti-rheumatics market?
The anti-rheumatics market size was valued at USD 63.2 billion in 2022.
What is the CAGR of the global anti-rheumatics market from 2023 to 2032?
The CAGR of anti-rheumatics is 2.6% during the analysis period of 2023 to 2032.
Which are the key players in the anti-rheumatics market?
The key players operating in the global market are including Johnson & Johnson, Pfizer, Inc., Bristol-Myers Squibb Company, Celegene Corporations, F. Hoffmann-La Roche Ltd., MedImmune, LLC, Biogen Inc., Celltrion Inc., Takeda Pharmaceutical Company Ltd., and Amgen Inc.
Which region dominated the global anti-rheumatics market share?
North America held the dominating position in anti-rheumatics industry during the analysis period of 2023 to 2032.
Which region registered fastest CAGR from 2023 to 2032?
Asia-Pacific region exhibited fastest growing CAGR for market of anti-rheumatics during the analysis period of 2023 to 2032.
What are the current trends and dynamics in the global anti-rheumatics industry?
The current trends and dynamics in the anti-rheumatics industry include increasing prevalence of rheumatic diseases globally, growing adoption of biologic therapies for rheumatoid arthritis and related conditions, advancements in drug delivery systems enhancing treatment efficacy, and rising geriatric population prone to rheumatic ailments.
Which type held the maximum share in 2022?
The prescription-based drugs type the maximum share of the anti-rheumatics industry.


