Anthraquinone Market Size - Global Industry, Share, Analysis, Trends and Forecast 2024 - 2032
Published :
Report ID:
Pages :
Format :
Anthraquinone Market Size - Global Industry, Share, Analysis, Trends and Forecast 2024 - 2032
Report Coverage
- Industry Dynamics
- Market Size and Forecast Data
- Segment Analysis
- Competitive Landscape
- Regional Analysis with a Niche Focus on Country-Level Data
- High Level Analysis - Porter's, PESTEL, Value Chain, etc.
- Company Profiles of Key Players
- Option to Customize the Report As Per Your Specific Need
Request Sample Report
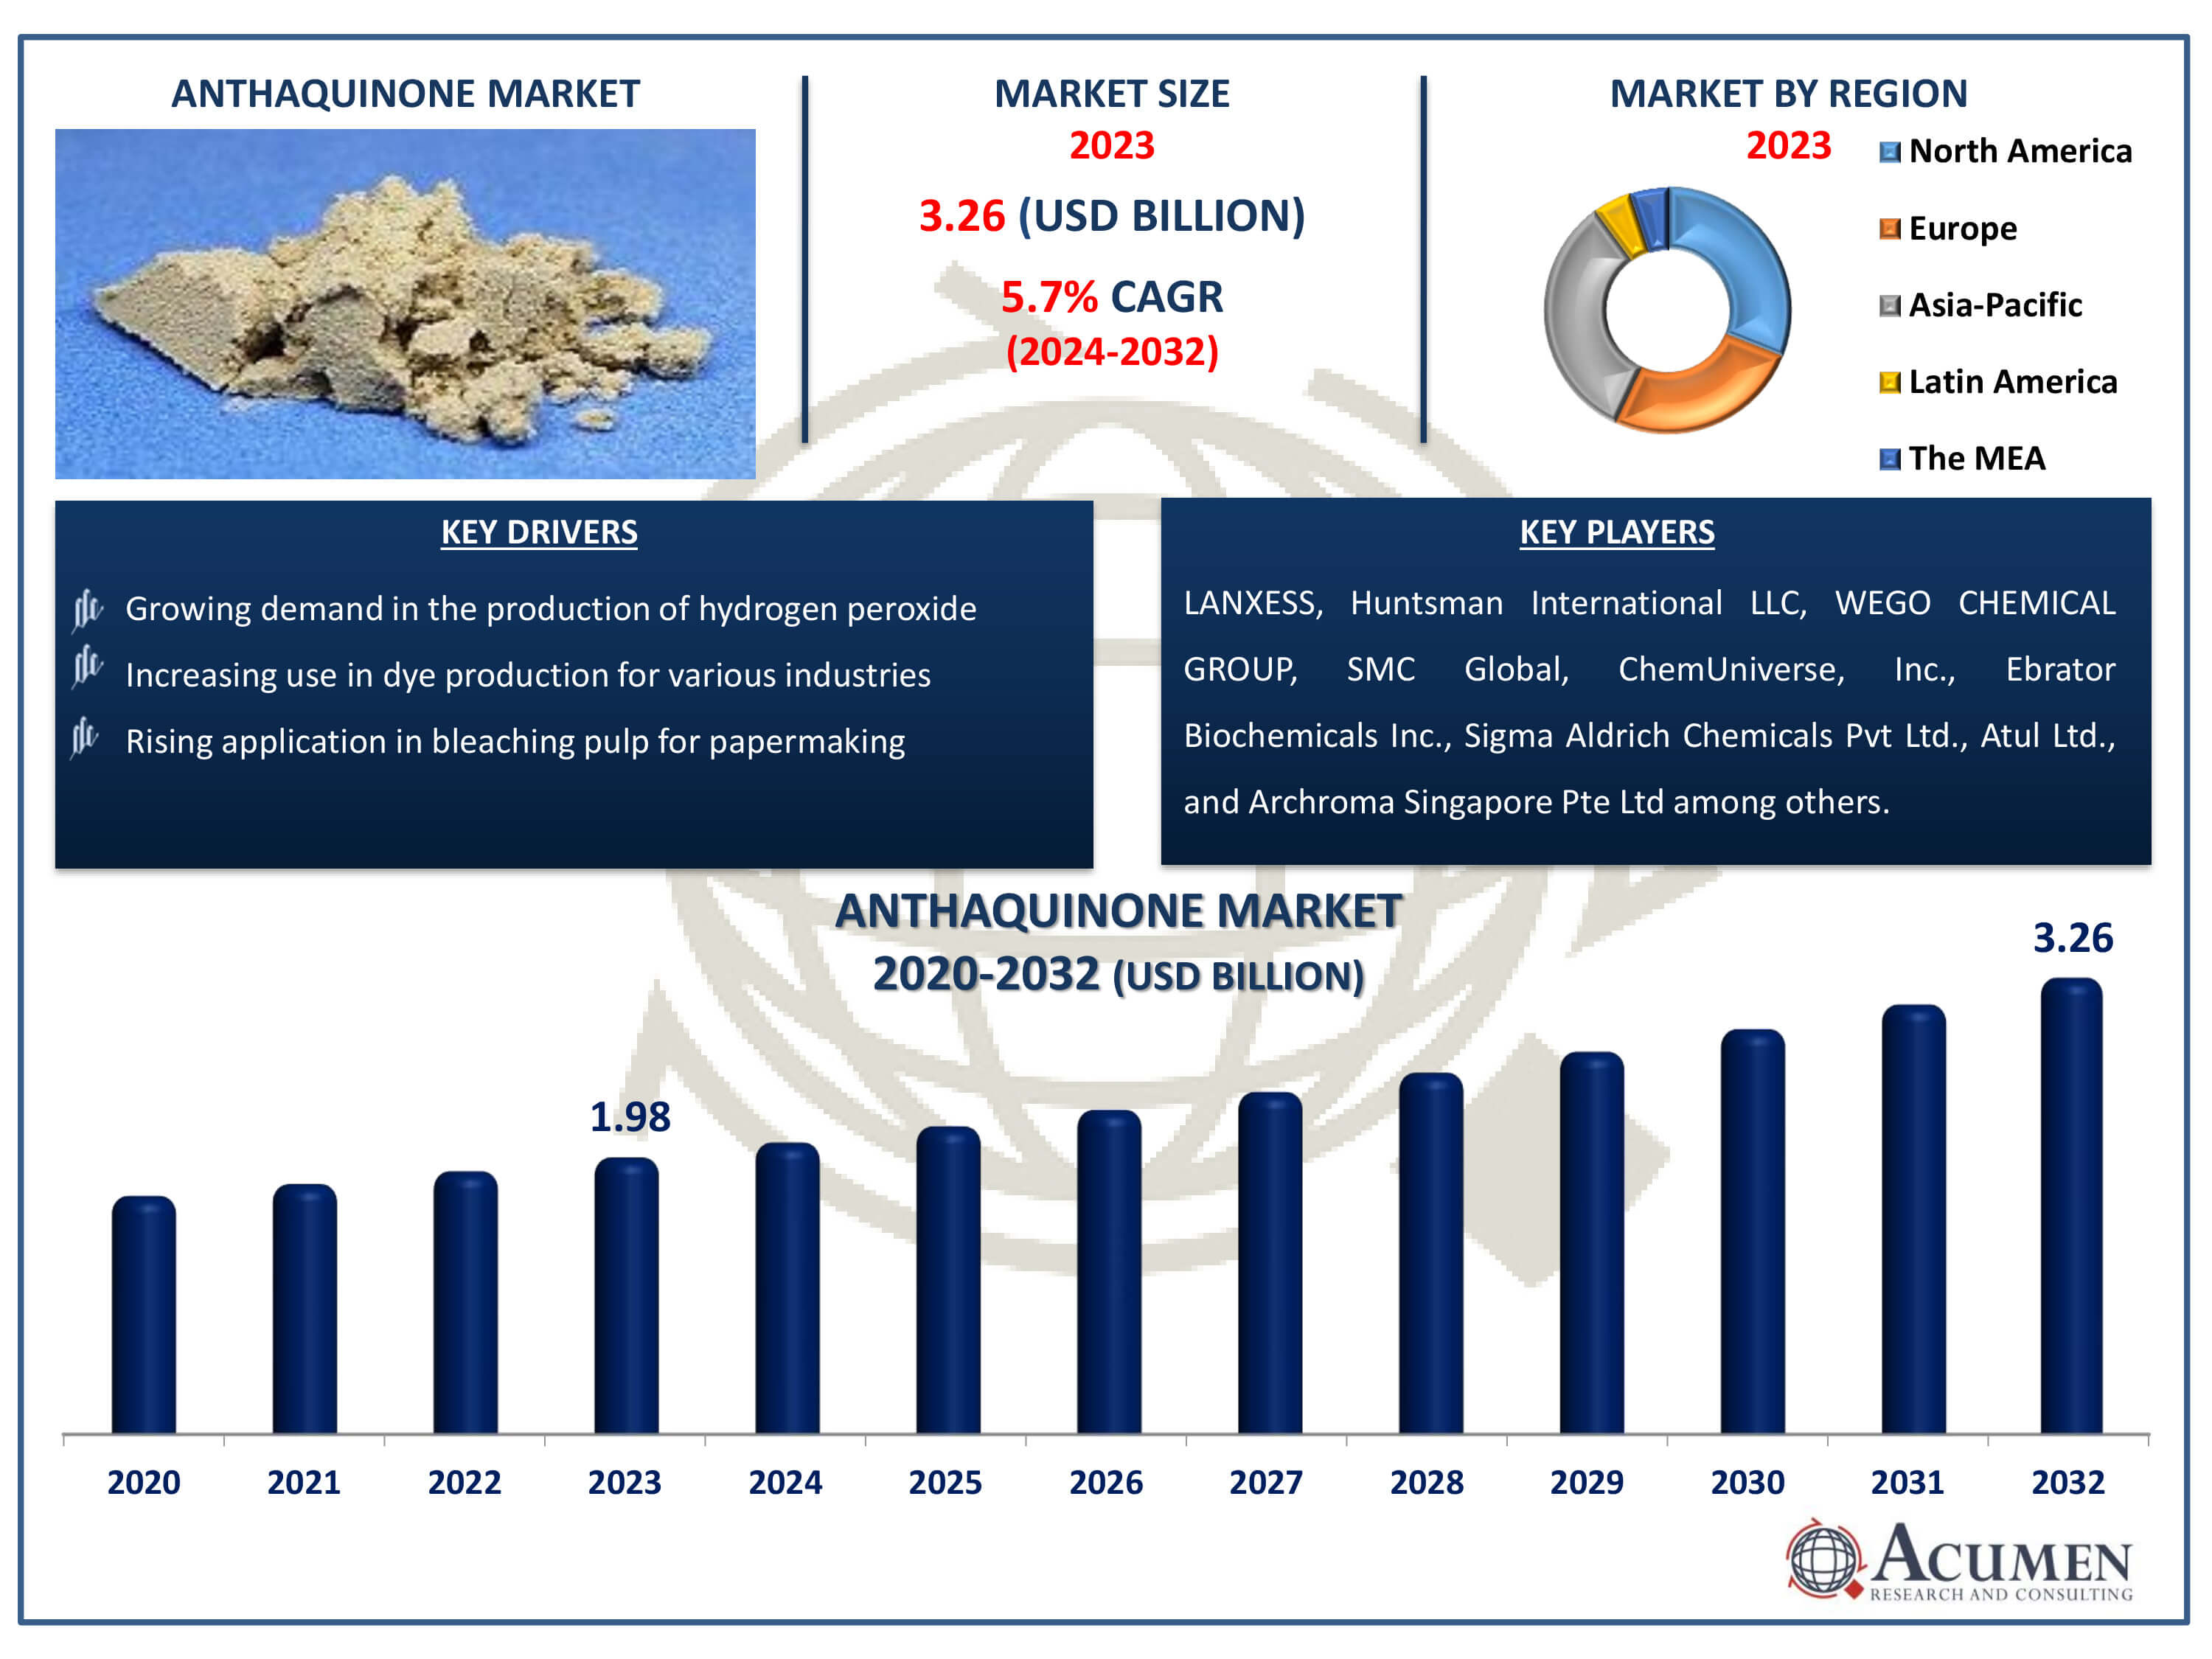
The Anthraquinone Market Size accounted for USD 1.98 Billion in 2023 and is estimated to achieve a market size of USD 3.26 Billion by 2032 growing at a CAGR of 5.7% from 2024 to 2032.
Anthraquinone Market Highlights
- Global anthraquinone market revenue is poised to garner USD 3.26 billion by 2032 with a CAGR of 5.7% from 2024 to 2032
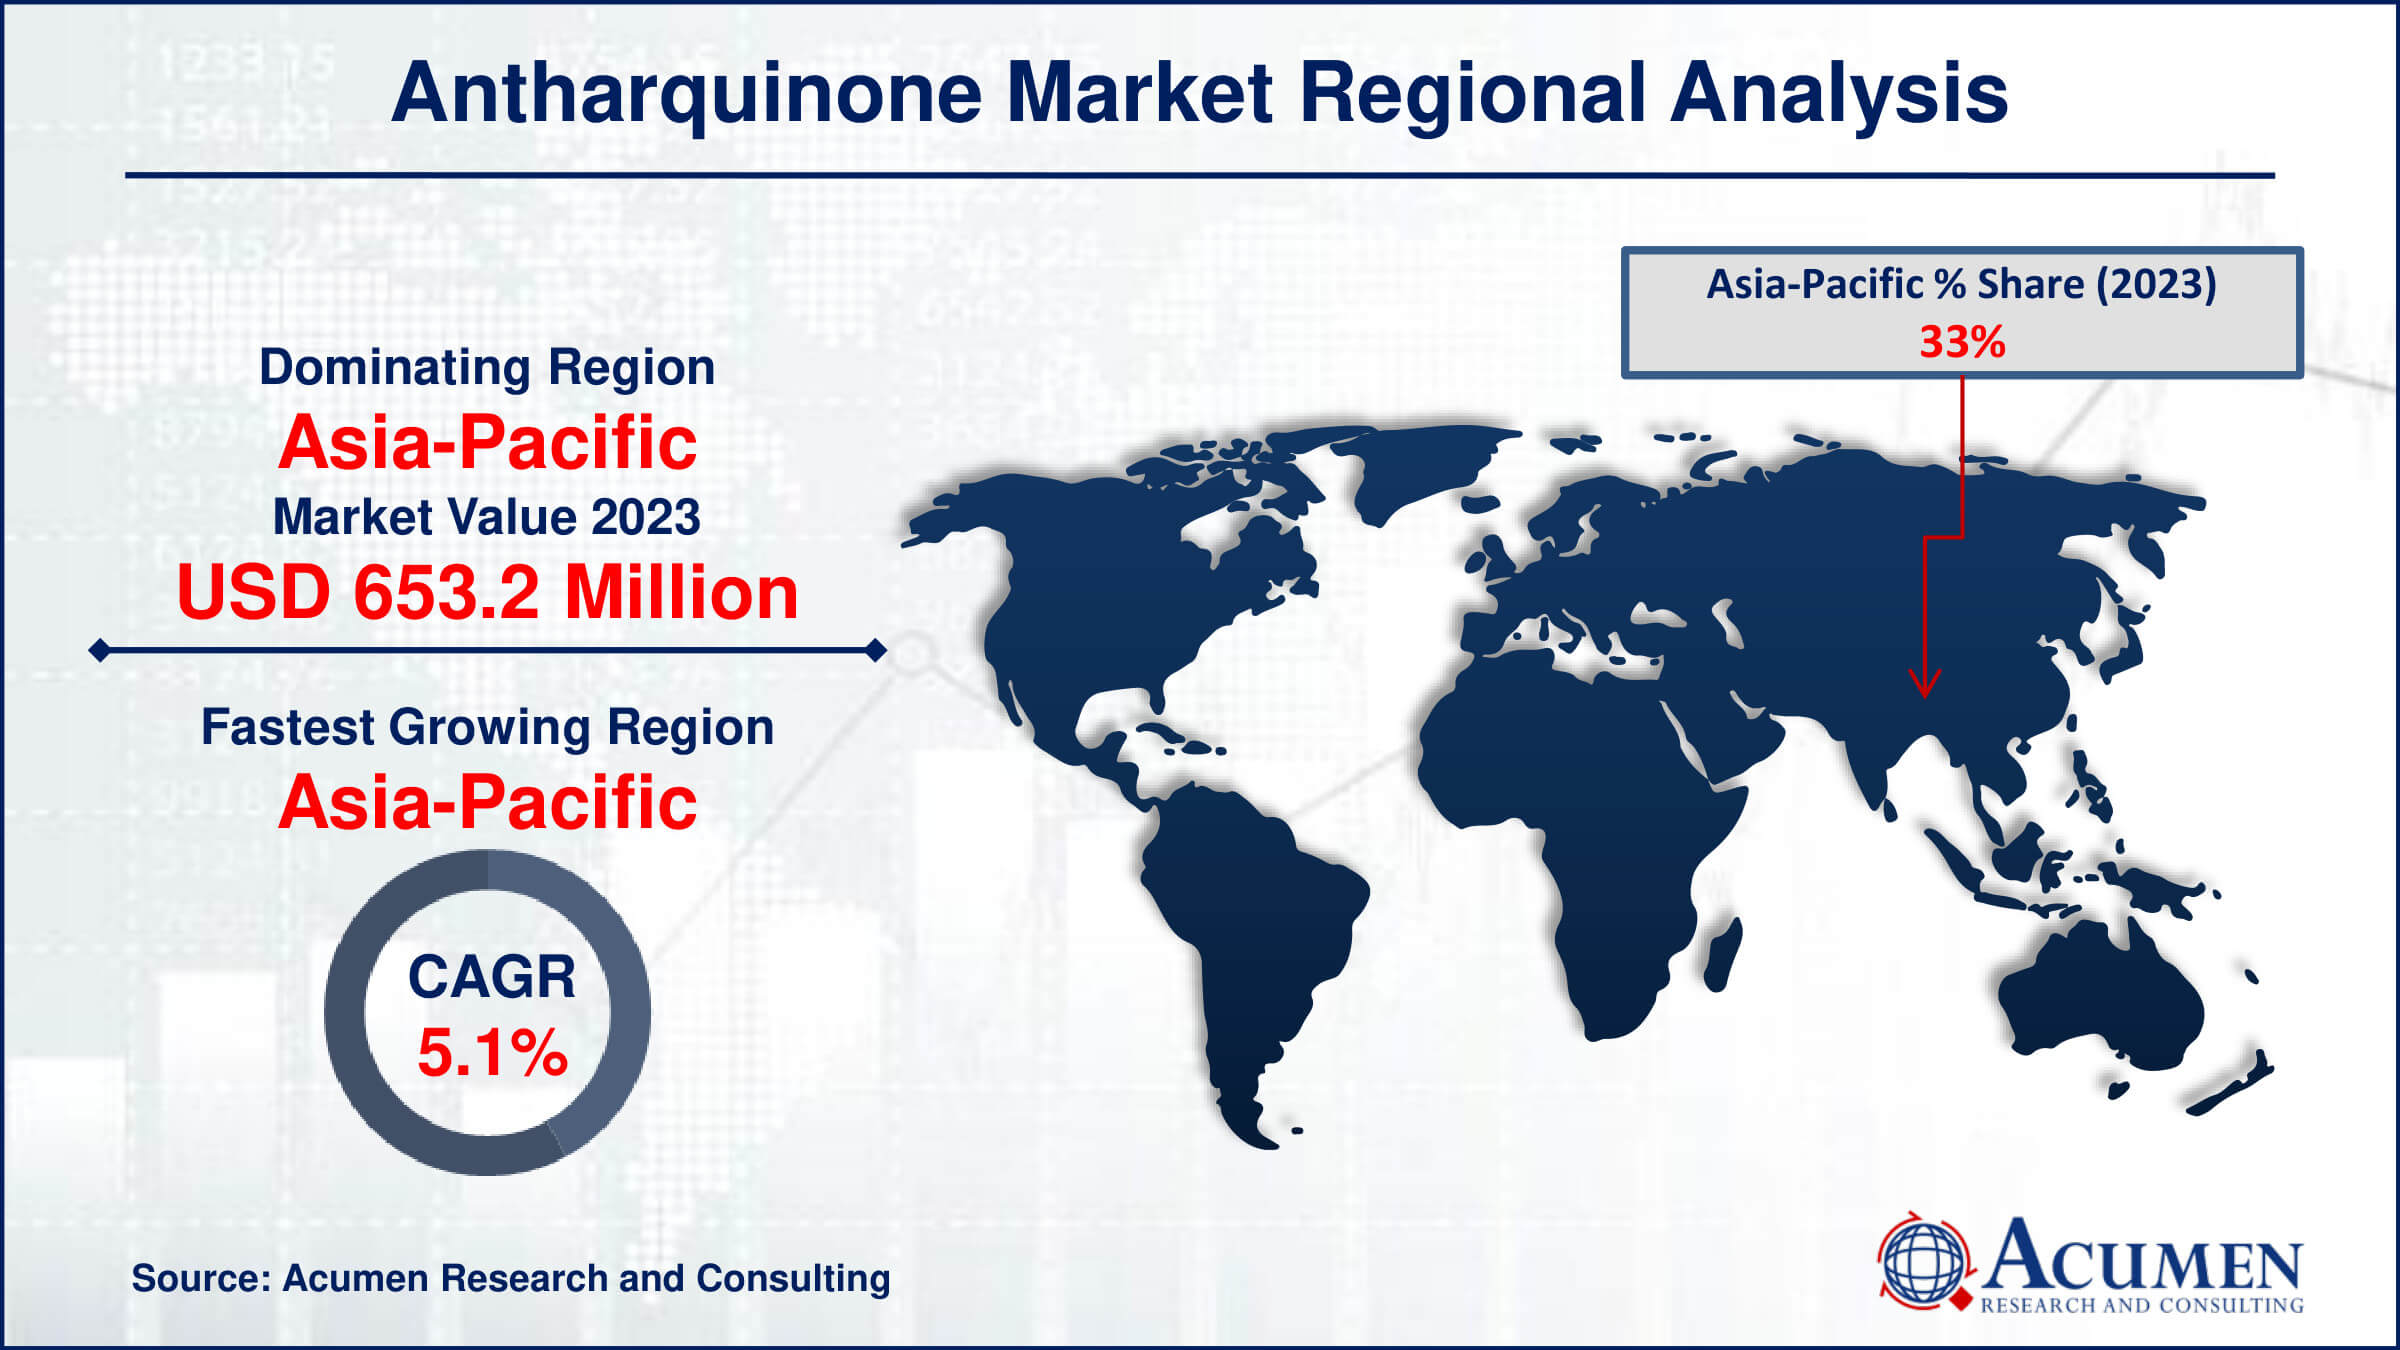
- Asia-Pacific anthraquinone market value occupied around USD 653.2 million in 2023
- Asia-Pacific anthraquinone market growth will record a CAGR of more than 6% from 2024 to 2032
- Among form, the synthetic sub-segment gathered more than 50% market share in 2023
- Based on application, the hydrogen peroxide production sub-segment occupied around 20% market share in 2023
- Increasing demand from the textile and dyeing industry is a popular anthraquinone market trend that fuels the industry demand

Anthraquinone, also known as anthracenedione or dioxoanthracene, is a fragrant characteristic compound. It is primarily represented by one specific isomer, 9,10-anthraquinone, with the International Union of Pure and Applied Chemistry (IUPAC) name anthracene-9,10-dione. Anthraquinone forms the largest group of quinones, which are found in purple or red shades. This particular substance is produced using two distinct methods. The first method involves oxidizing anthracene in the presence of chromic acid or fusing benzene. The second method involves oxidizing phthalic anhydride and dehydrating the product. Anthraquinone is a crystalline solid that appears yellow in color. Although it is sparingly soluble in water, it readily dissolves in various hot organic solvents.
Anthraquinone is one of the most important components used in the manufacturing of hydrogen peroxide. It is also a key element used in the production of various dyes and is utilized in bleaching pulp for papermaking. Additionally, anthraquinone is used as a bird repellent on farms and as a gas generator in weather balloons. In New Zealand, anthraquinone is mixed with a substance called lanolin and used as a wool spray to protect sheep from kea strikes. Anthraquinone can cause tumors in humans if ingested orally. It can also cause dermatitis, skin irritation, and allergic reactions when applied to the skin. It is found in fungi, certain plants, and insects and contributes to their color pigmentation.
Global Anthraquinone Market Dynamics
Market Drivers
- Growing demand for anthraquinone in the production of hydrogen peroxide
- Increasing use of anthraquinone in dye production for various industries
- Rising application of anthraquinone in bleaching pulp for papermaking
- Expanding utilization of anthraquinone as a bird repellent and gas generator in agricultural and aerospace sectors
Market Restraints
- Health concerns related to anthraquinone consumption, including the risk of tumors in humans
- Environmental regulations restricting the use of anthraquinone due to its potential ecological impact
- Limited availability of anthraquinone resources, leading to supply chain challenges and price fluctuations
Market Opportunities
- Development of anthraquinone-based formulations for novel applications in pharmaceuticals and cosmetics
- Exploration of sustainable production methods for anthraquinone to address environmental concerns
- Expansion of anthraquinone markets in emerging economies with growing industrial sectors
Anthraquinone Market Report Coverage
| Market | Anthraquinone Market |
| Anthraquinone Market Size 2022 | USD 1.98 Billion |
| Anthraquinone Market Forecast 2032 | USD 3.26 Billion |
| Anthraquinone Market CAGR During 2023 - 2032 | 5.7% |
| Anthraquinone Market Analysis Period | 2020 - 2032 |
| Anthraquinone Market Base Year |
2022 |
| Anthraquinone Market Forecast Data | 2023 - 2032 |
| Segments Covered | By Form, By Type, By Application, By End-User Industry, And By Geography |
| Regional Scope | North America, Europe, Asia Pacific, Latin America, and Middle East & Africa |
| Key Companies Profiled | LANXESS, Huntsman International LLC, WEGO CHEMICAL GROUP, SMC Global, ChemUniverse, Inc., Ebrator Biochemicals Inc., Sigma Aldrich Chemicals Pvt Ltd., Atul Ltd., Archroma Singapore Pte Ltd, Tokyo Chemical Industry Co Ltd, and Nanjing Skyfly Chemical Co Ltd. |
| Report Coverage |
Market Trends, Drivers, Restraints, Competitive Analysis, Player Profiling, Regulation Analysis |
Anthraquinone Market Insights
Certain factors, such as the increasing demand for eco-friendly and less harmful products, are driving the anthraquinone market forward. Additionally, the demand for medications that are effective in treating various diseases, such as diabetes and cancer, is contributing to market growth, although these medications contain lower amounts of anthraquinone.
However, excessive doses of anthraquinone can harm aquatic animals and cause long-term changes in aquatic environments, negatively affecting the entire ecosystem. Furthermore, anthraquinone exposure can lead to serious health issues, including cancer and eye irritation. High doses can cause gastrointestinal disturbances and exhibit toxic side effects such as nausea, vomiting, bloody diarrhea, dermatitis, dizziness, severe abdominal pain, and cramping. In extreme cases, it can lead to kidney damage. These significant health and environmental risks are major factors that could hamper market growth.
On the other hand, the need to develop drugs for treating gastrointestinal, chronic liver, kidney diseases, and type 2 diabetes presents opportunities for the anthraquinone industry. The growth of the textile and fashion industries will drive the integrated dye industry, maintaining the demand for anthraquinone. Additionally, the increasing production of medications that can treat severe illnesses like cancer and diabetes, and that use anthraquinone as a key component, will further boost market growth in the near future.
Anthraquinone Market Segmentation
The worldwide market for anthraquinone is split based on form, type, application, end-user industry, and geography.
Anthraquinone Market By Form
- Natural
- Synthetic
According to the anthraquinone industry analysis, the synthetic anthraquinone has dominated the market due to its low cost, consistency, and ease of production. Synthetic anthraquinone can be produced in large quantities, ensuring a consistent supply for a variety of industrial applications such as dyes, pharmaceuticals, and hydrogen peroxide. Furthermore, synthetic methods provide greater control over purity and quality, which is critical for their use in sensitive applications. These advantages make synthetic anthraquinone the preferred choice over natural anthraquinone, contributing to its market dominance.
Anthraquinone Market By Type
- 9,10-Anthraquinone
- 1,2-Anthraquinone
- 1,4-Anthraquinone,
- Others
According to the anthraquinone market analysis, the 9,10-Anthraquinone is one of the leading types. This is due to its broad use in a variety of applications, including medications, dyes and pigments. Its unusual features, such as its propensity to form complexes with metal ions, make it a popular choice in many sectors. Furthermore, its low cost and availability help to solidify its market leadership.
Anthraquinone Market By Application
- Textile Dyeing
- Printing Inks
- Paints and Coatings
- Bleaching Agent
- Laxatives
- Antimalarials
- Hydrogen Peroxide Production
- Bird Repellents
- Others
As per the anthraquinone market forecast, hydrogen peroxide production is expected to dominate the market due to its high demand in a variety of industrial applications. Hydrogen peroxide is commonly used as a bleaching agent in the pulp and paper industry, a disinfectant in water treatment, and in a variety of chemical synthesis processes. The use of anthraquinone in the hydrogen peroxide production process, also known as the anthraquinone process, increases production efficiency and cost-effectiveness, making it an important application. The dominance of hydrogen peroxide in the anthraquinone market can be attributed to its widespread and essential use in various industries.
Anthraquinone Market By End-User Industry
- Textile Industry
- Pulp and Paper Industry
- Pharmaceutical Industry
- Chemical Industry
- Agriculture Industry
- Electronics Industry
- Others
The pulp and paper industry dominated the anthraquinone market because it used it extensively as a bleaching agent. Anthraquinone is required for the production of hydrogen peroxide, a key component in the pulp and paper bleaching process. This application significantly increases the efficiency and environmental friendliness of the bleaching process, making it a necessary chemical in this industry. The pulp and paper industry has cemented its position as the leading end-user of anthraquinone due to the widespread and ongoing demand for bleached paper products.
Anthraquinone Market Regional Outlook
North America
- U.S.
- Canada
Europe
- U.K.
- Germany
- France
- Spain
- Rest of Europe
Asia-Pacific
- India
- Japan
- China
- Australia
- South Korea
- Rest of Asia-Pacific
Latin America
- Brazil
- Mexico
- Rest of Latin America
The Middle East & Africa
- South Africa
- GCC Countries
- Rest of the Middle East & Africa (ME&A)

Anthraquinone Market Regional Analysis
The anthraquinone market varies significantly by region, owing to the wide range of industrial applications and production capabilities. Asia-Pacific has the largest market share, owing to the strong textile and pulp and paper industries in countries such as China, India, and Japan. The region's rapid industrialization and urbanization have increased the demand for anthraquinone in textile dyeing and paper bleaching. Furthermore, the presence of numerous chemical manufacturing companies, as well as the availability of raw materials, contribute to Asia-Pacific's dominant position in the anthraquinone market. Government initiatives and investments in infrastructure development help to drive market growth in this region.
Anthraquinone markets in North America and Europe are also significant, thanks to advances in the pharmaceutical, chemical, and agricultural industries. The United States is a major contributor in North America because of its well-established pharmaceutical industry, which uses anthraquinone to produce laxatives and antimalarials. Europe's stringent environmental regulations have resulted in a steady demand for environmentally friendly and sustainable bleaching agents in the pulp and paper industry. Furthermore, the growing emphasis on renewable energy sources and advanced manufacturing technologies in these regions supports the ongoing demand for anthraquinone, ensuring consistent market growth.
Anthraquinone Market Players
Some of the top anthraquinone companies offered in our report includes LANXESS, Huntsman International LLC, WEGO CHEMICAL GROUP, SMC Global, ChemUniverse, Inc., Ebrator Biochemicals Inc., Sigma Aldrich Chemicals Pvt Ltd., Atul Ltd., Archroma Singapore Pte Ltd, Tokyo Chemical Industry Co Ltd, and Nanjing Skyfly Chemical Co Ltd.
Frequently Asked Questions
How big is the anthraquinone market?
The anthraquinone market size was valued at USD 1.98 billion in 2023.
What is the CAGR of the global anthraquinone market from 2024 to 2032?
The CAGR of anthraquinone industry is 5.7% during the analysis period of 2024 to 2032.
Which are the key players in the anthraquinone market?
The key players operating in the global market are including LANXESS, Huntsman International LLC, WEGO CHEMICAL GROUP, SMC Global, ChemUniverse, Inc., Ebrator Biochemicals Inc., Sigma Aldrich Chemicals Pvt Ltd., Atul Ltd., Archroma Singapore Pte Ltd, Tokyo Chemical Industry Co Ltd, and Nanjing Skyfly Chemical Co Ltd.
Which region dominated the global anthraquinone market share?
Asia-Pacific held the dominating position in anthraquinone industry during the analysis period of 2024 to 2032.
Which region registered fastest CAGR from 2024 to 2032?
North America region exhibited fastest growing CAGR for market of anthraquinone during the analysis period of 2024 to 2032.
What are the current trends and dynamics in the global anthraquinone industry?
The current trends and dynamics in the anthraquinone industries include growing demand for anthraquinone in the production of hydrogen peroxide, increasing use of anthraquinone in dye production for various industries, and rising application of anthraquinone in bleaching pulp for papermaking.
Which component held the maximum share in 2023?
The synthetic component held the maximum share of the anthraquinone industry.


