Ammonium Nitrate Market Size - Global Industry, Share, Analysis, Trends and Forecast 2023 - 2032
Published :
Report ID:
Pages :
Format :
Ammonium Nitrate Market Size - Global Industry, Share, Analysis, Trends and Forecast 2023 - 2032
Report Coverage
- Industry Dynamics
- Market Size and Forecast Data
- Segment Analysis
- Competitive Landscape
- Regional Analysis with a Niche Focus on Country-Level Data
- High Level Analysis - Porter's, PESTEL, Value Chain, etc.
- Company Profiles of Key Players
- Option to Customize the Report As Per Your Specific Need
Request Sample Report
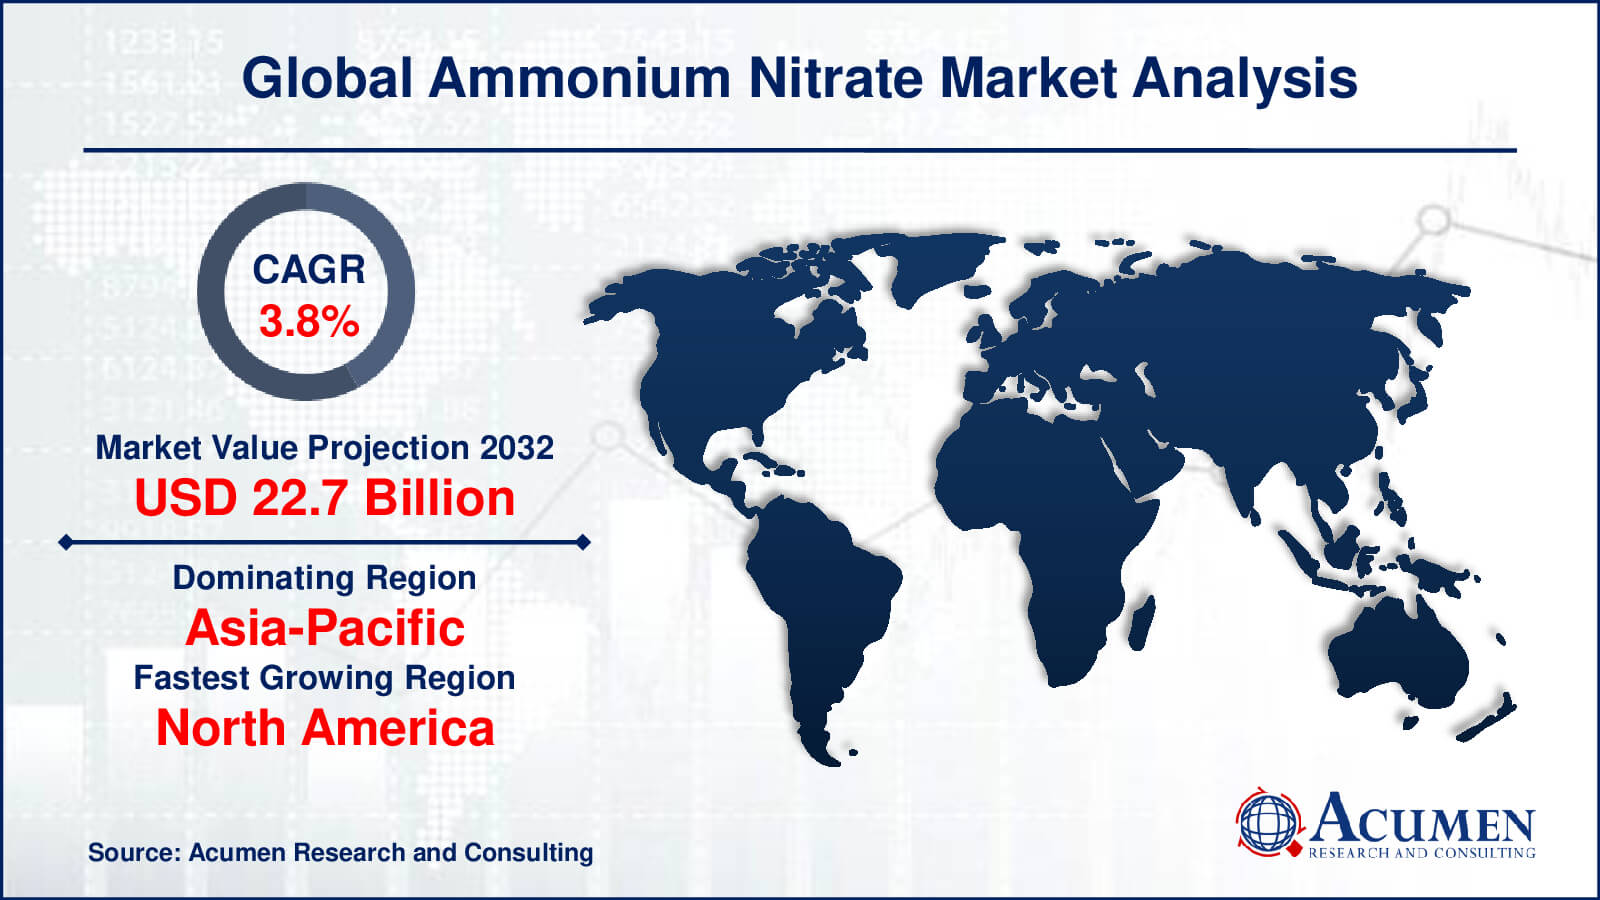
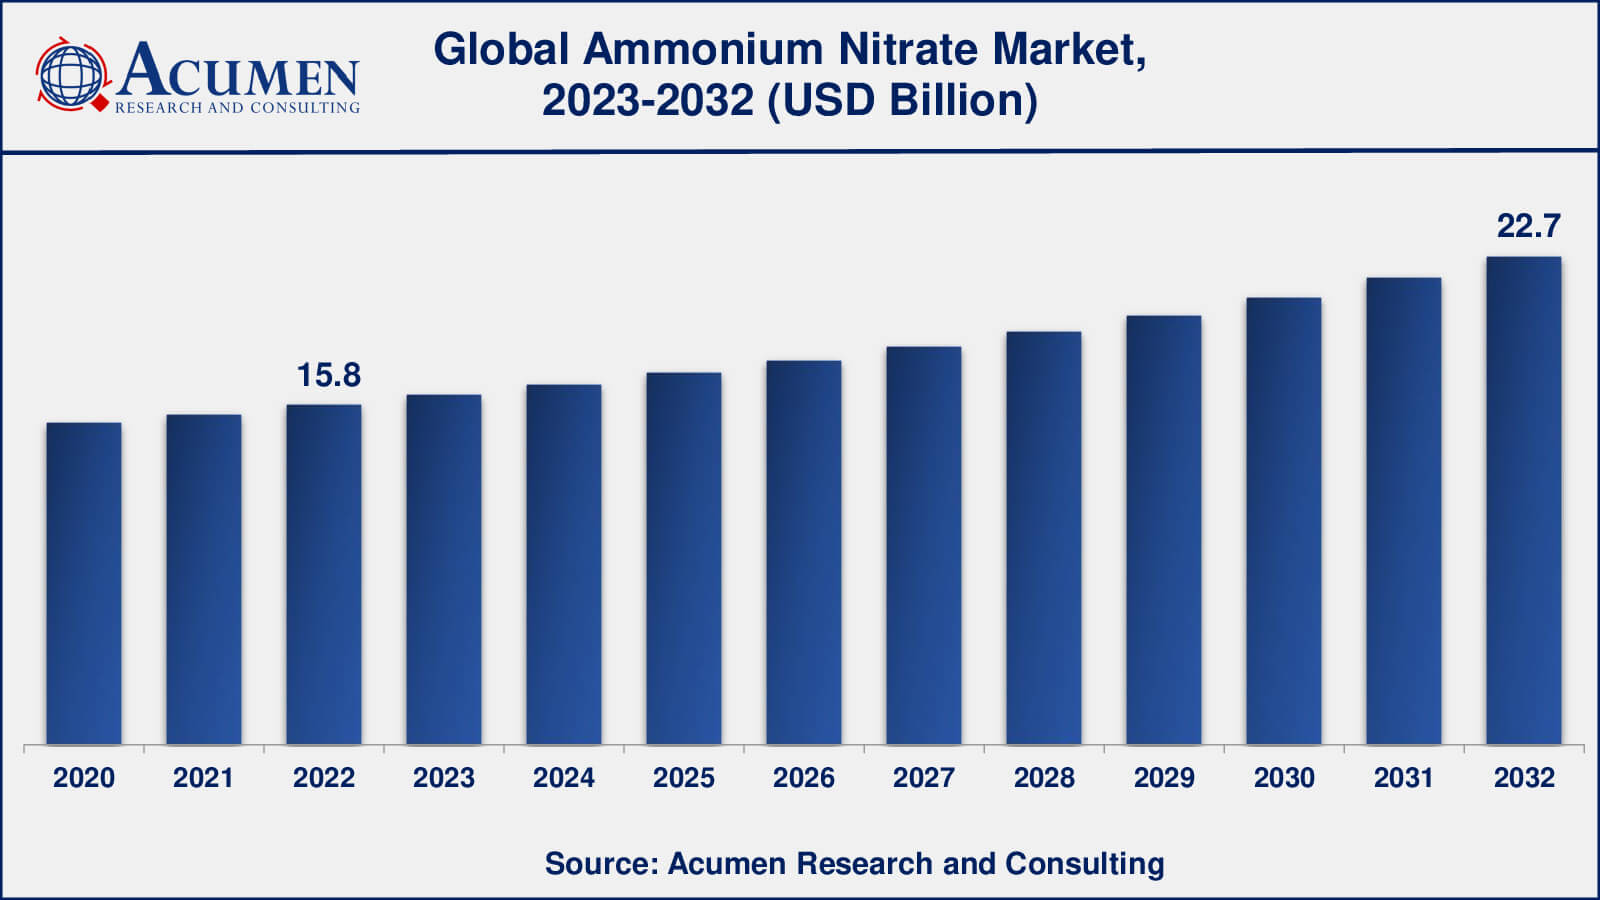
The Global Ammonium Nitrate Market Size accounted for USD 15.8 Billion in 2022 and is estimated to achieve a market size of USD 22.7 Billion by 2032 growing at a CAGR of 3.8% from 2023 to 2032.
Ammonium Nitrate Market Highlights
- Global ammonium nitrate market revenue is poised to garner USD 22.7 billion by 2032 with a CAGR of 3.8% from 2023 to 2032
- Asia-Pacific ammonium nitrate market value occupied around USD 5.53 billion in 2022
- North America ammonium nitrate market growth will record a CAGR of more than 4% from 2023 to 2032
- Among product, the high density sub-segment generated over US$ 9.6 billion revenue in 2022
- Based on application, the fertilizer sub-segment generated around 57% share in 2022
- The increasing population and demand for food is a popular ammonium nitrate market trend that fuels the industry's demand
Ammonium nitrate is a chemical compound represented by the formula NH4NO3. It results from the combination of nitric acid and ammonia salt. At room temperature, it appears as white, colorless crystals. However, when exposed to temperatures above 32 degrees Celsius, it transforms into monoclinic crystals. This compound is known for its high volatility and finds application in select industries. It is an odorless crystal salt, lacking any color, and is primarily utilized in fertilizers to improve plant growth by providing a readily available source of nitrogen. The production of ammonium nitrate involves the reaction of ammonium gas with nitric acid, resulting in an exothermic reaction that generates significant heat. To mitigate its volatility, it is often blended with ammonium sulfate before being applied to plants, ensuring a more stable and safer form of use.
Global Ammonium Nitrate Market Dynamics
Market Drivers
- Rising demand for fertilizers globally
- Growing demand for ammonium nitrate fuel oil (ANFO)
- Increasing demand for food
Market Restraints
- Availability of substitutes
- Increase in regulations due to potential for misuse
Market Opportunities
- Developments and regulations to improve the safety of ammonium nitrate
- Potential of ammonium nitrate for explosive due to increased investment in mining and construction sector
Ammonium Nitrate Market Report Coverage
| Market | Ammonium Nitrate Market |
| Ammonium Nitrate Market Size 2022 | USD 31.5 Billion |
| Ammonium Nitrate Market Forecast 2032 | USD 160.8 Billion |
| Ammonium Nitrate Market CAGR During 2023 - 2032 | 17.9% |
| Ammonium Nitrate Market Analysis Period | 2020 - 2032 |
| Ammonium Nitrate Market Base Year | 2022 |
| Ammonium Nitrate Market Forecast Data | 2023 - 2032 |
| Segments Covered | By Product, By Form, By Application, By End-User, And By Geography |
| Regional Scope | North America, Europe, Asia Pacific, Latin America, and Middle East & Africa |
| Key Companies Profiled | Orica, Incitec Pivot Limited, Neochim PLC, URALCHEM Holding P.L.C., Enaex S.A., San Corporation, CF Industries Holdings, Inc., EuroChem Group AG, Austin Powder Company, and Vijay Gas Industry P Ltd. |
| Report Coverage |
Market Trends, Drivers, Restraints, Competitive Analysis, Player Profiling, Covid-19 Analysis, Regulation Analysis |
Ammonium Nitrate Market Insights
Major factors bolstering the growth of the target market are the increase in demand for ammonium nitrate from the agriculture sector, coupled with rising demand for agriculture fertilizers Product with ammonium nitrate content. There is a constant increase in population and with rising population there is an increase in crop production yield. This is resulting in demand for fertilizers Product with high ammonium nitrate content. Manufacturers are introducing new fertilizers Product with ammonium nitrate content due to their benefits such as it being a water-soluble compound it accelerates the roost absorption process, causes minimal change to the PH level of soil which further results in better soil retention quality, and is cost-effective. In 2016 according to Food and Agriculture Organization, global consumption of three main fertilizer nutrients, nitrogen (N), phosphorus expressed as phosphate (P2O5), and potassium expressed as potash (K2O), was 186.67 Mn tonnes (N, P2O5, and K2O).
In addition, increasing spending on mining and excavation activities related to minerals and metals is resulting in demand for explosive Product which is expected to in turn support the growth of the target market. Rapid industrialization and urbanization in emerging economies and growing demand for metals have resulted in various mining activities in countries such as India, and China. Ammonium nitrate is used in explosive Product that is used in mining fields. According to India Brand Equity Foundation, India produces 95 minerals– 4 fuel-related minerals, 10 metallic minerals, 23 non-metallic minerals, 3 atomic minerals, and 55 minor minerals. India is expected to overtake Australia and the US in early 2020 to take the position of the world’s second-largest coal producer.
However, there is a restriction on the Mining & quarrying selling of ammonium nitrate due to the incidence of fire and explosion, along with stringent government regulations related to product approval are some major aspects that are restraining the target market growth. In addition, direct contact with ammonium nitrate has various side effects on health which is another factor limiting its adoption.
Factors that are expected to drive the future growth of the global market are business expansion approaches among major players through mergers and partnerships are expected to help the company to increase its revenue and increase global presence. In 2018 Enaex S.A. acquired 70% of the Cachimayo plant which is the only plant producing ammonium nitrate in Peru that operated under the Gloria Group. This purchase will help the company to generate a strategic alliance with Peruvian holding company which will continue to be part of this company, to develop the road map, make investments and guide the growth of Industrias Cachimayo.
Ammonium Nitrate Market Segmentation
The worldwide market for ammonium nitrate is split based on product, form, application, end-user, and geography.
Ammonium Nitrate Products
- High Density
- Low Density
- Solution
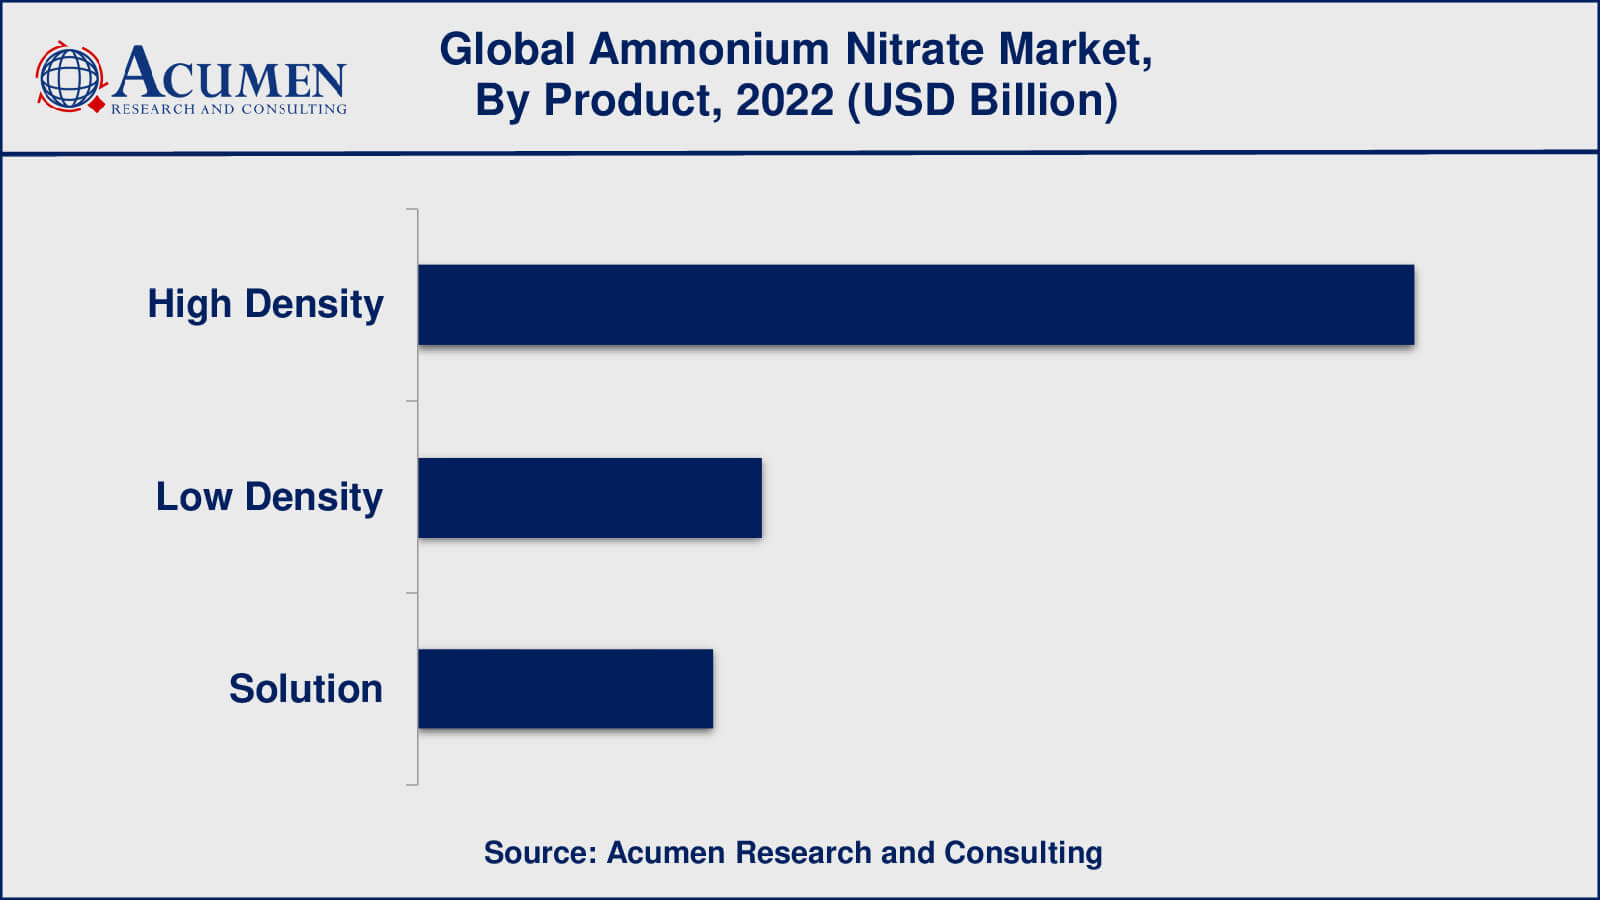
Based on the product market is segmented into high density ammonium nitrate, low density ammonium nitrate, and solution. According to ammonium nitrate industry analysis, high density has held the largest portion in the past years within the product segment and is likely to continue its dominance throughout the forecasted period from 2023 to 2032. Increasing demand for high-density ammonium nitrate (HDAM) in agriculture sectors will boost the market for this segment. HDAM used in various applications for agriculture fields such as crop yields, increase soil fertility, reduced development of vegetative mass.
Ammonium Nitrate Forms
- Solid Form
- Liquid Form
The ammonium nitrate market form segment includes solid form and liquid form. Within the form segment, the solid form category emerged as the leader in terms of revenue share in previous years. Because of consumption of percentage is higher in globally. During the forecast period also solid form has the highest percentage market share. The solid form of ammonium nitrate is manufactured from 2 components which are of different densities as well as higher density. It is used in various industries but majorly this is used in military and demolition operations.
Ammonium Nitrate Applications
- Fertilizers
- Explosives
- Others
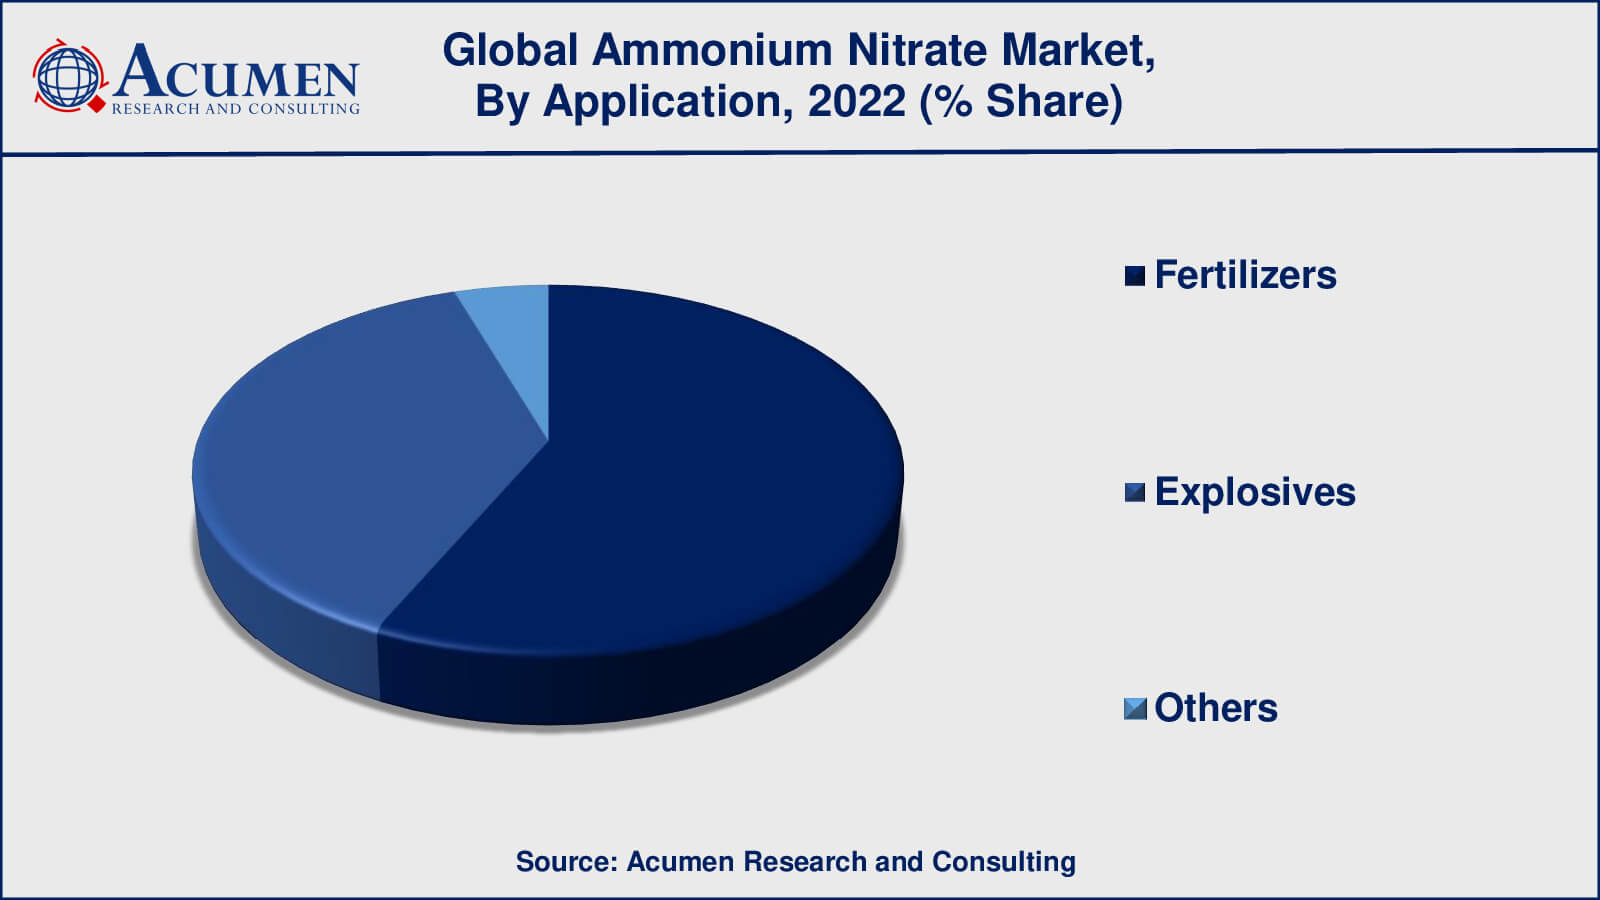
Based on application the segment is categorized in fertilizers, explosives, and others. In recent years, the fertilizer segment has emerged as the dominant application segment in the ammonium nitrate market. The use of fertilizer is increasing in the past few years because of the population is increasing and also growing awareness about food safety. Use of ammonium nitrate increases plant growth and the quality of fruits and seeds also increases this will drive the growth of the ammonium nitrate market.
Ammonium Nitrate End-Users
- Agriculture
- Construction
- Mining & Quarrying
- Others
The end-user segment is classified into agriculture, construction, mining, and quarrying. According to the ammonium nitrate market forecast, the agriculture segments have dominated the market share and are likely to continue their dominance throughout the forecasted timeframe from 2023 to 2032. The population is increasing day by day because of that there is a need for food this key factor will increase the demand for agriculture segment in upcoming years.
Ammonium Nitrate Market Regional Outlook
North America
- U.S.
- Canada
Europe
- U.K.
- Germany
- France
- Spain
- Rest of Europe
Asia-Pacific
- India
- Japan
- China
- Australia
- South Korea
- Rest of Asia-Pacific
Latin America
- Brazil
- Mexico
- Rest of Latin America
The Middle East & Africa
- South Africa
- GCC Countries
- Rest of the Middle East & Africa (ME&A)
Ammonium Nitrate Market Regional Analysis
The Asia-Pacific market is experiencing rapid growth during the forecast period, primarily attributed to substantial government investments in agriculture and a high demand for ammonium nitrate-based fertilizers. Moreover, the market's progress is being further bolstered by increasing collaborations between regional and international industry players in this region. Notably, China, the U.S., and Europe are the dominant players in terms of both production and consumption, collectively accounting for approximately 80% of global production and 73% of consumption.
China, in particular, has witnessed a notable increase in ammonium nitrate exports, supplying various countries such as Oman, Thailand, and Malaysia, among others. Following the Asia-Pacific region, Europe is also experiencing significant growth in the ammonium nitrate market, with countries like Germany, the UK, France, and Italy playing pivotal roles in this expansion.
Ammonium Nitrate Market Players
Some of the top ammonium nitrate companies offered in our report includes Orica, Incitec Pivot Limited, Neochim PLC, URALCHEM Holding P.L.C., Enaex S.A., San Corporation, CF Industries Holdings, Inc., EuroChem Group AG, Austin Powder Company, and Vijay Gas Industry P Ltd.
Frequently Asked Questions
What was the market size of the global ammonium nitrate in 2022?
The market size of ammonium nitrate was USD 22.7 billion in 2022.
What is the CAGR of the global ammonium nitrate market from 2023 to 2032?
The CAGR of ammonium nitrate is 3.8% during the analysis period of 2023 to 2032.
Which are the key players in the ammonium nitrate market?
The key players operating in the global market are including Orica, Incitec Pivot Limited, Neochim PLC, URALCHEM Holding P.L.C., Enaex S.A., San Corporation, CF Industries Holdings, Inc., EuroChem Group AG, Austin Powder Company, and Vijay Gas Industry P Ltd.
Which region dominated the global ammonium nitrate market share?
Asia-Pacific held the dominating position in ammonium nitrate industry during the analysis period of 2023 to 2032.
Which region registered fastest CAGR from 2023 to 2032?
North America region exhibited fastest growing CAGR for market of ammonium nitrate during the analysis period of 2023 to 2032.
What are the current trends and dynamics in the global ammonium nitrate industry?
The current trends and dynamics in the ammonium nitrate industry include rising demand for fertilizers globally, growing demand for ammonium nitrate fuel oil (ANFO), and increasing demand for food.
Which product held the maximum share in 2022?
The high density held the maximum share of the ammonium nitrate industry.


