Alternative Sweetener Market | Acumen Research and Consulting
Alternative Sweetener Market Size - Global Industry, Share, Analysis, Trends and Forecast 2023 - 2032
Published :
Report ID:
Pages :
Format :
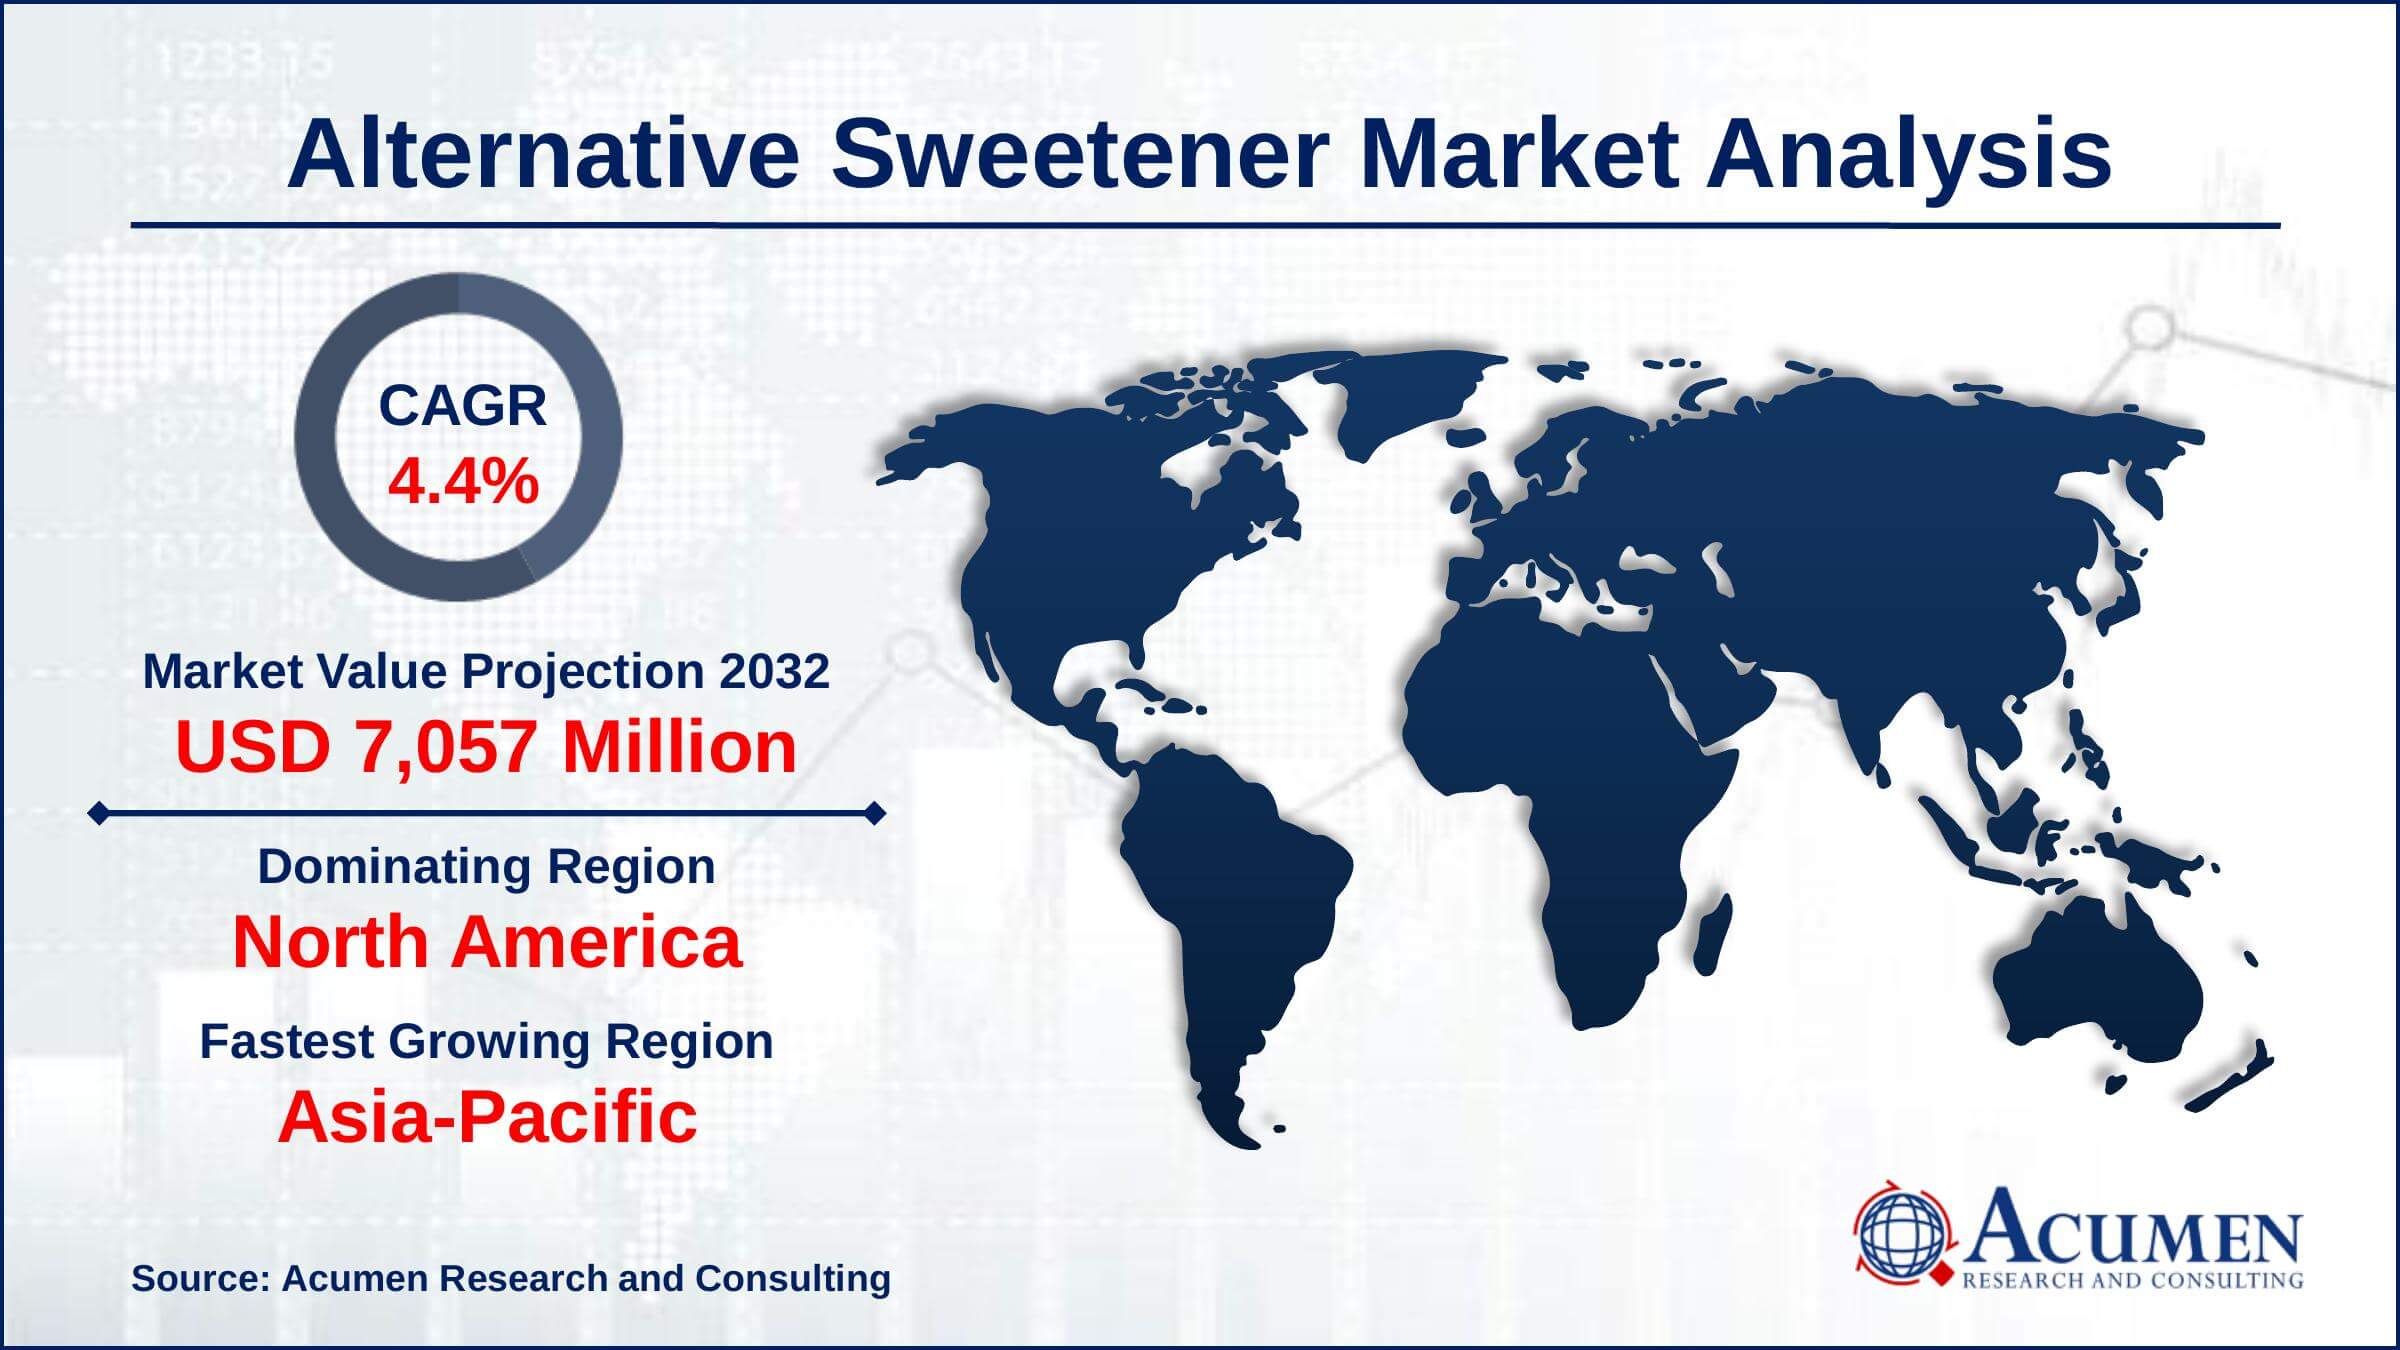
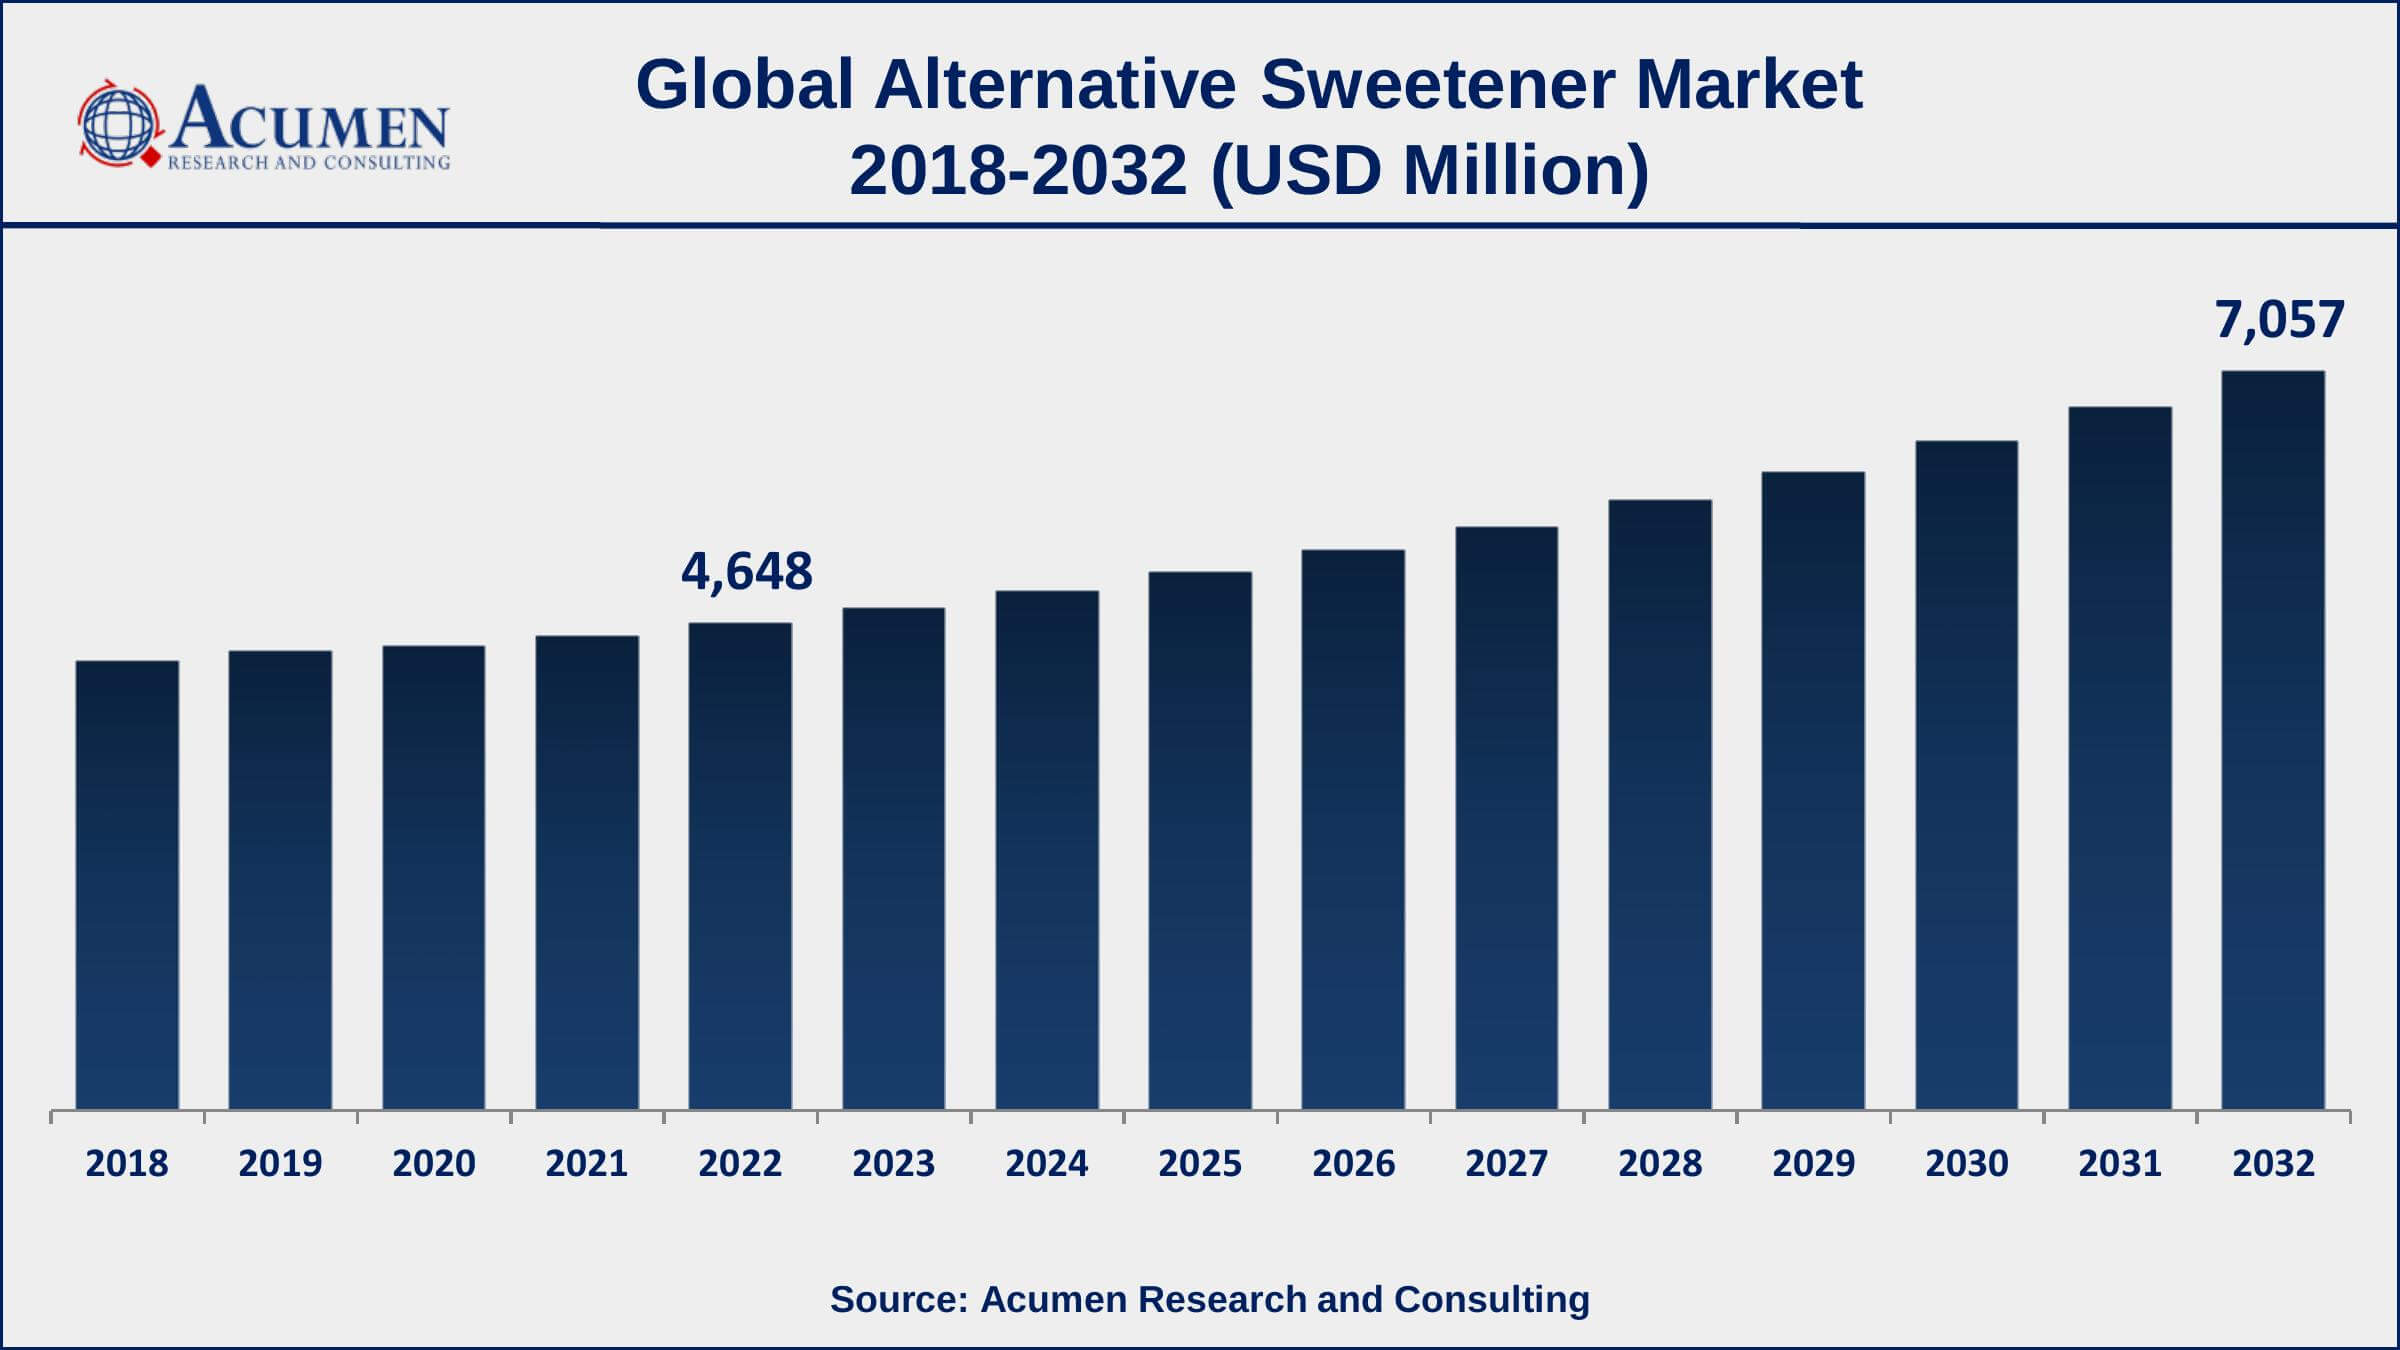
The Global Alternative Sweetener Market Size accounted for USD 4,648 Million in 2022 and is estimated to achieve a market size of USD 7,057 Million by 2032 growing at a CAGR of 4.4% from 2023 to 2032. The growing demands for low-calorie and natural sweeteners, as well as increased concerns about the health repercussions of consuming too much sugar, are driving the alternative sweeteners market growth. Furthermore, rising health consciousnesses, as well as the incidence of diabetes and obesity, are predicted to fuel the alternative sweeteners market value in the coming years.
Alternative Sweetener Market Report Key Highlights
- Global alternative sweetener market revenue is expected to increase by USD 7,057 Million by 2032, with a 4.4% CAGR from 2023 to 2032
- According to the World Health Organization (WHO), worldwide obesity has nearly tripled since 1975
- North America region led with more than 38% of alternative sweetener market share in 2022
- Asia-Pacific region would exhibit the highest CAGR of 5.2% during 2023-2032
- By product type, the high-intensity sweeteners segment has accounted market share of over 45% in 2022
- By application, the food and beverages segment captured the majority of the market
- Rising incidence of obesity and diabetes, drives the alternative sweetener market size
Alternative sweeteners are substances that can be used as a substitute for sugar to sweeten foods and beverages. They can come in many forms such as natural sweeteners like stevia and honey, or artificial sweeteners like aspartame and saccharin. They are often used in products marketed as "diet" or "sugar-free" as they have fewer calories and do not have the same negative health effects associated with excessive sugar consumption.
Global Alternative Sweetener Market Trends
Market Drivers
- Increasing consumer demand for low-calorie and natural sweeteners
- Rising incidence of obesity and diabetes
- Government regulations and policies
- Growing food and beverage industry
Market Restraints
- Lack of consumer awareness
- Expensive than traditional sweeteners
Market Opportunities
- Development of new alternative sweeteners
- Innovation in packaging and marketing
Alternative Sweetener Market Report Coverage
| Market | Alternative Sweetener Market |
| Alternative Sweetener Market Size 2022 | USD 4,648 Million |
| Alternative Sweetener Market Forecast 2032 | USD 7,057 Million |
| Alternative Sweetener Market CAGR During 2023 - 2032 | 4.4% |
| Alternative Sweetener Market Analysis Period | 2018 - 2032 |
| Alternative Sweetener Market Base Year | 2022 |
| Alternative Sweetener Market Forecast Data | 2023 - 2032 |
| Segments Covered | By Product Type, By Source, By Application, And By Geography |
| Regional Scope | North America, Europe, Asia Pacific, Latin America, and Middle East & Africa |
| Key Companies Profiled | Cargill Incorporated, GLG Life Tech Corporation, Archer Daniels Midland Company, Tate & Lyle, Heartland Food Products Group, Roquette Freres, DuPont de Nemours, Inc., Ingredion Inc., Ajinomoto Co., Inc., and JK Sucralose Inc. |
| Report Coverage |
Market Trends, Drivers, Restraints, Competitive Analysis, Player Profiling, Covid-19 Analysis, Regulation Analysis |
Alternative sweetener is an important food additive that provides a sweet taste to food similar to that of sugar while containing a very low number of calories. Both natural and synthetic types of alternative sweeteners are available for sale in the market. The market of alternative sweeteners across the globe is anticipated to experience steady growth during the forecast period. The rising demand for low-calorie content food products by health-conscious consumers across the globe is the primary factor analyzed to boost the demand for alternative sweeteners in the coming years. Due to rising health consciousness among consumers, various manufacturers aim to introduce different types of sugar substitutes into the market.
In addition, fluctuating prices of sugar are expected to boost the demand for alternative sweeteners across various application segments in the coming years. Moreover, the health concern relating to the problem of cancer on using low calories sweeteners is also curtailed by a recent study. Alternative sweeteners are used to reduce carbohydrates and to manage the calorie count of an individual. Thus, this factors improving the overall health of the consumer. On the other hand, the rising rate of obesity, the increasing diabetic population, and other high calorie-related health problems are also predicted to fuel the demand for alternative sweeteners in the coming years.
Alternative Sweetener Market Segmentation
The global alternative sweetener market segmentation is based on product type, source, application, and geography.
Alternative Sweetener Market By Product Type
- High Fructose Syrup
- Low-Intensity Sweeteners
- High-Intensity Sweeteners
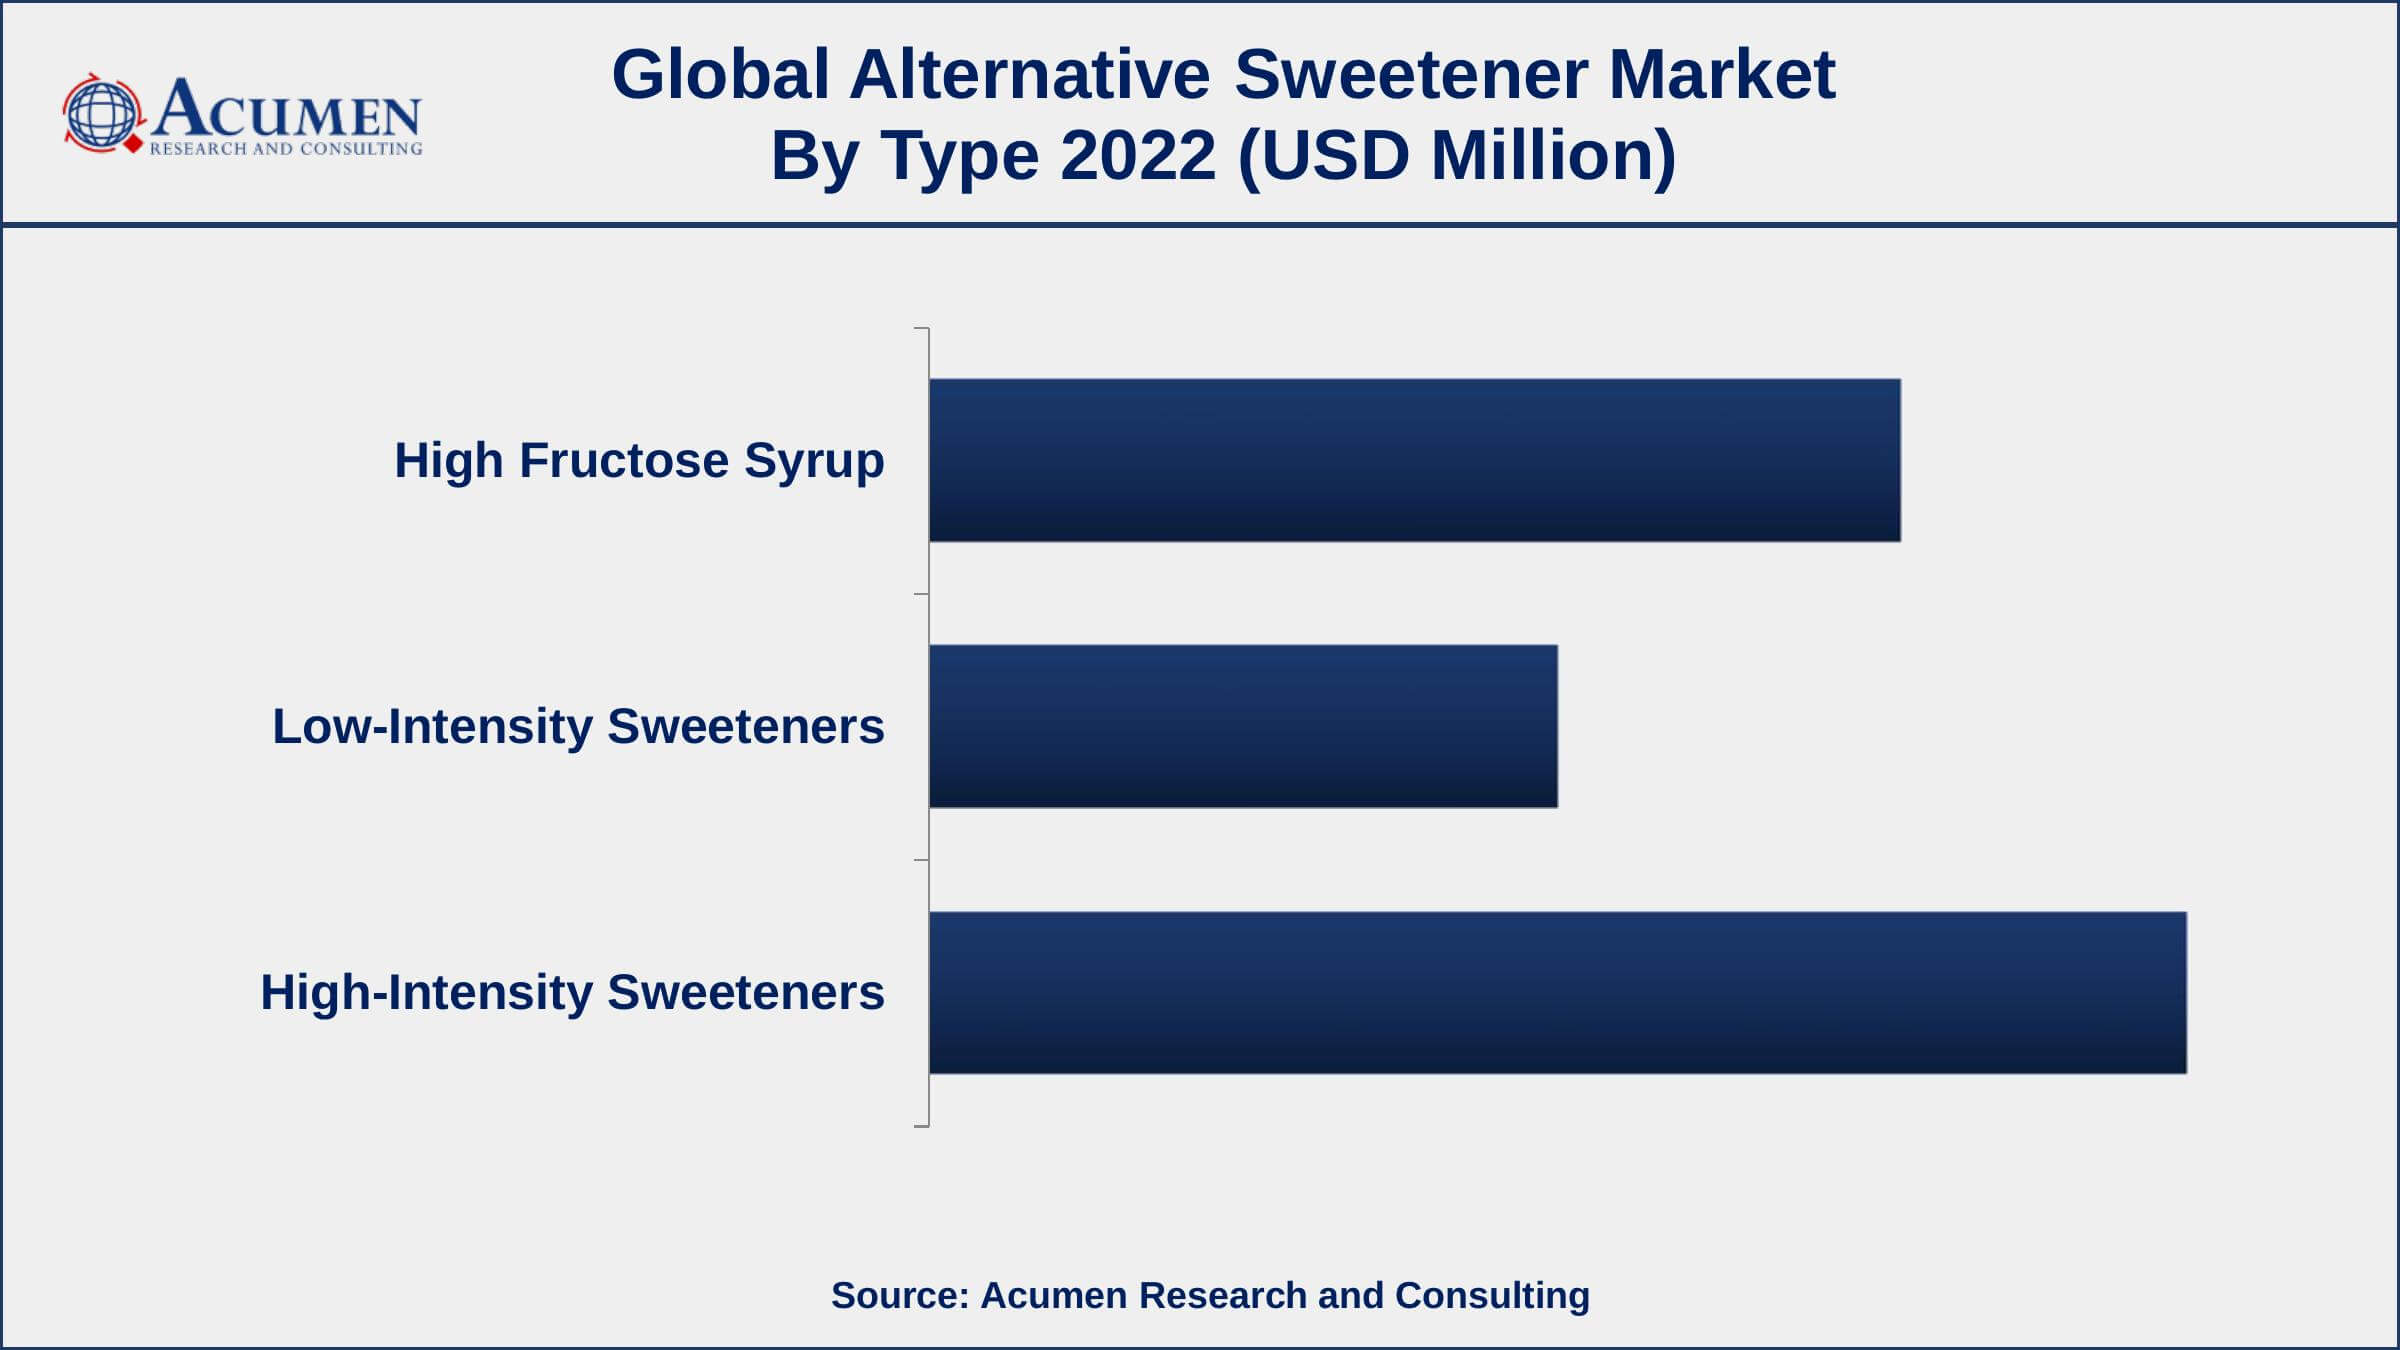
According to an alternative sweetener industry analysis, the high-intensity sweeteners segment is the largest and most dominant segment of the market. High-intensity sweeteners are artificial sweeteners that are many times sweeter than sugar, but with a much lower calorie content. They are widely used in food and beverages, including soft drinks, baked goods, and confectionery products. Some of the most popular high-intensity sweeteners include Aspartame, Sucralose, and Acesulfame Potassium. The popularity of high-intensity sweeteners is driven by their ability to provide a sweet taste without adding calories. They are also heat-stable, which makes them suitable for use in a wide range of food and beverage applications. In addition, high-intensity sweeteners are approved by regulatory bodies, such as the FDA and EFSA, which further increases their popularity and trust among consumers. As a result, the High-Intensity Sweeteners segment is expected to continue its dominance in the alternative sweetener market in the foreseeable future.
Alternative Sweetener Market By Source
- Synthetic
- Natural
In terms of source, the natural segment is a rapidly growing segment of the alternative sweetener market. Natural sweeteners are derived from natural sources, such as plants, fruits, and vegetables, and do not contain any artificial ingredients. Some of the most popular natural sweeteners include Stevia, Erythritol, Xylitol, and Honey. The popularity of natural sweeteners is driven by the increasing consumer demand for natural and organic food products. Natural sweeteners are perceived as healthier and safer than artificial sweeteners, which is driving the growth of this segment.
Alternative Sweetener Market By Application
- Food and Beverages
- Confectionery
- Bakery
- Dairy
- Beverage
- Others
- Pharmaceuticals
- Others
According to the alternative sweetener market forecast, the pharmaceutical industry is a growing segment of the market. This is because many pharmaceutical products, such as cough syrups and liquid medications, require a sweet taste to mask their bitter or unpleasant taste. Alternative sweeteners, such as stevia, monk fruit, and erythritol, are being used more frequently in these products as they are considered healthier options compared to traditional sugar. Additionally, these sweeteners are also being used in dietary supplements and functional foods to provide a sweet taste without adding calories.
Alternative Sweetener Market Regional Outlook
North America
- U.S.
- Canada
Europe
- U.K.
- Germany
- France
- Spain
- Rest of Europe
Asia-Pacific
- India
- Japan
- China
- Australia
- South Korea
- Rest of Asia-Pacific
Latin America
- Brazil
- Mexico
- Rest of Latin America
The Middle East & Africa
- South Africa
- GCC Countries
- Rest of the Middle East & Africa (ME&A)
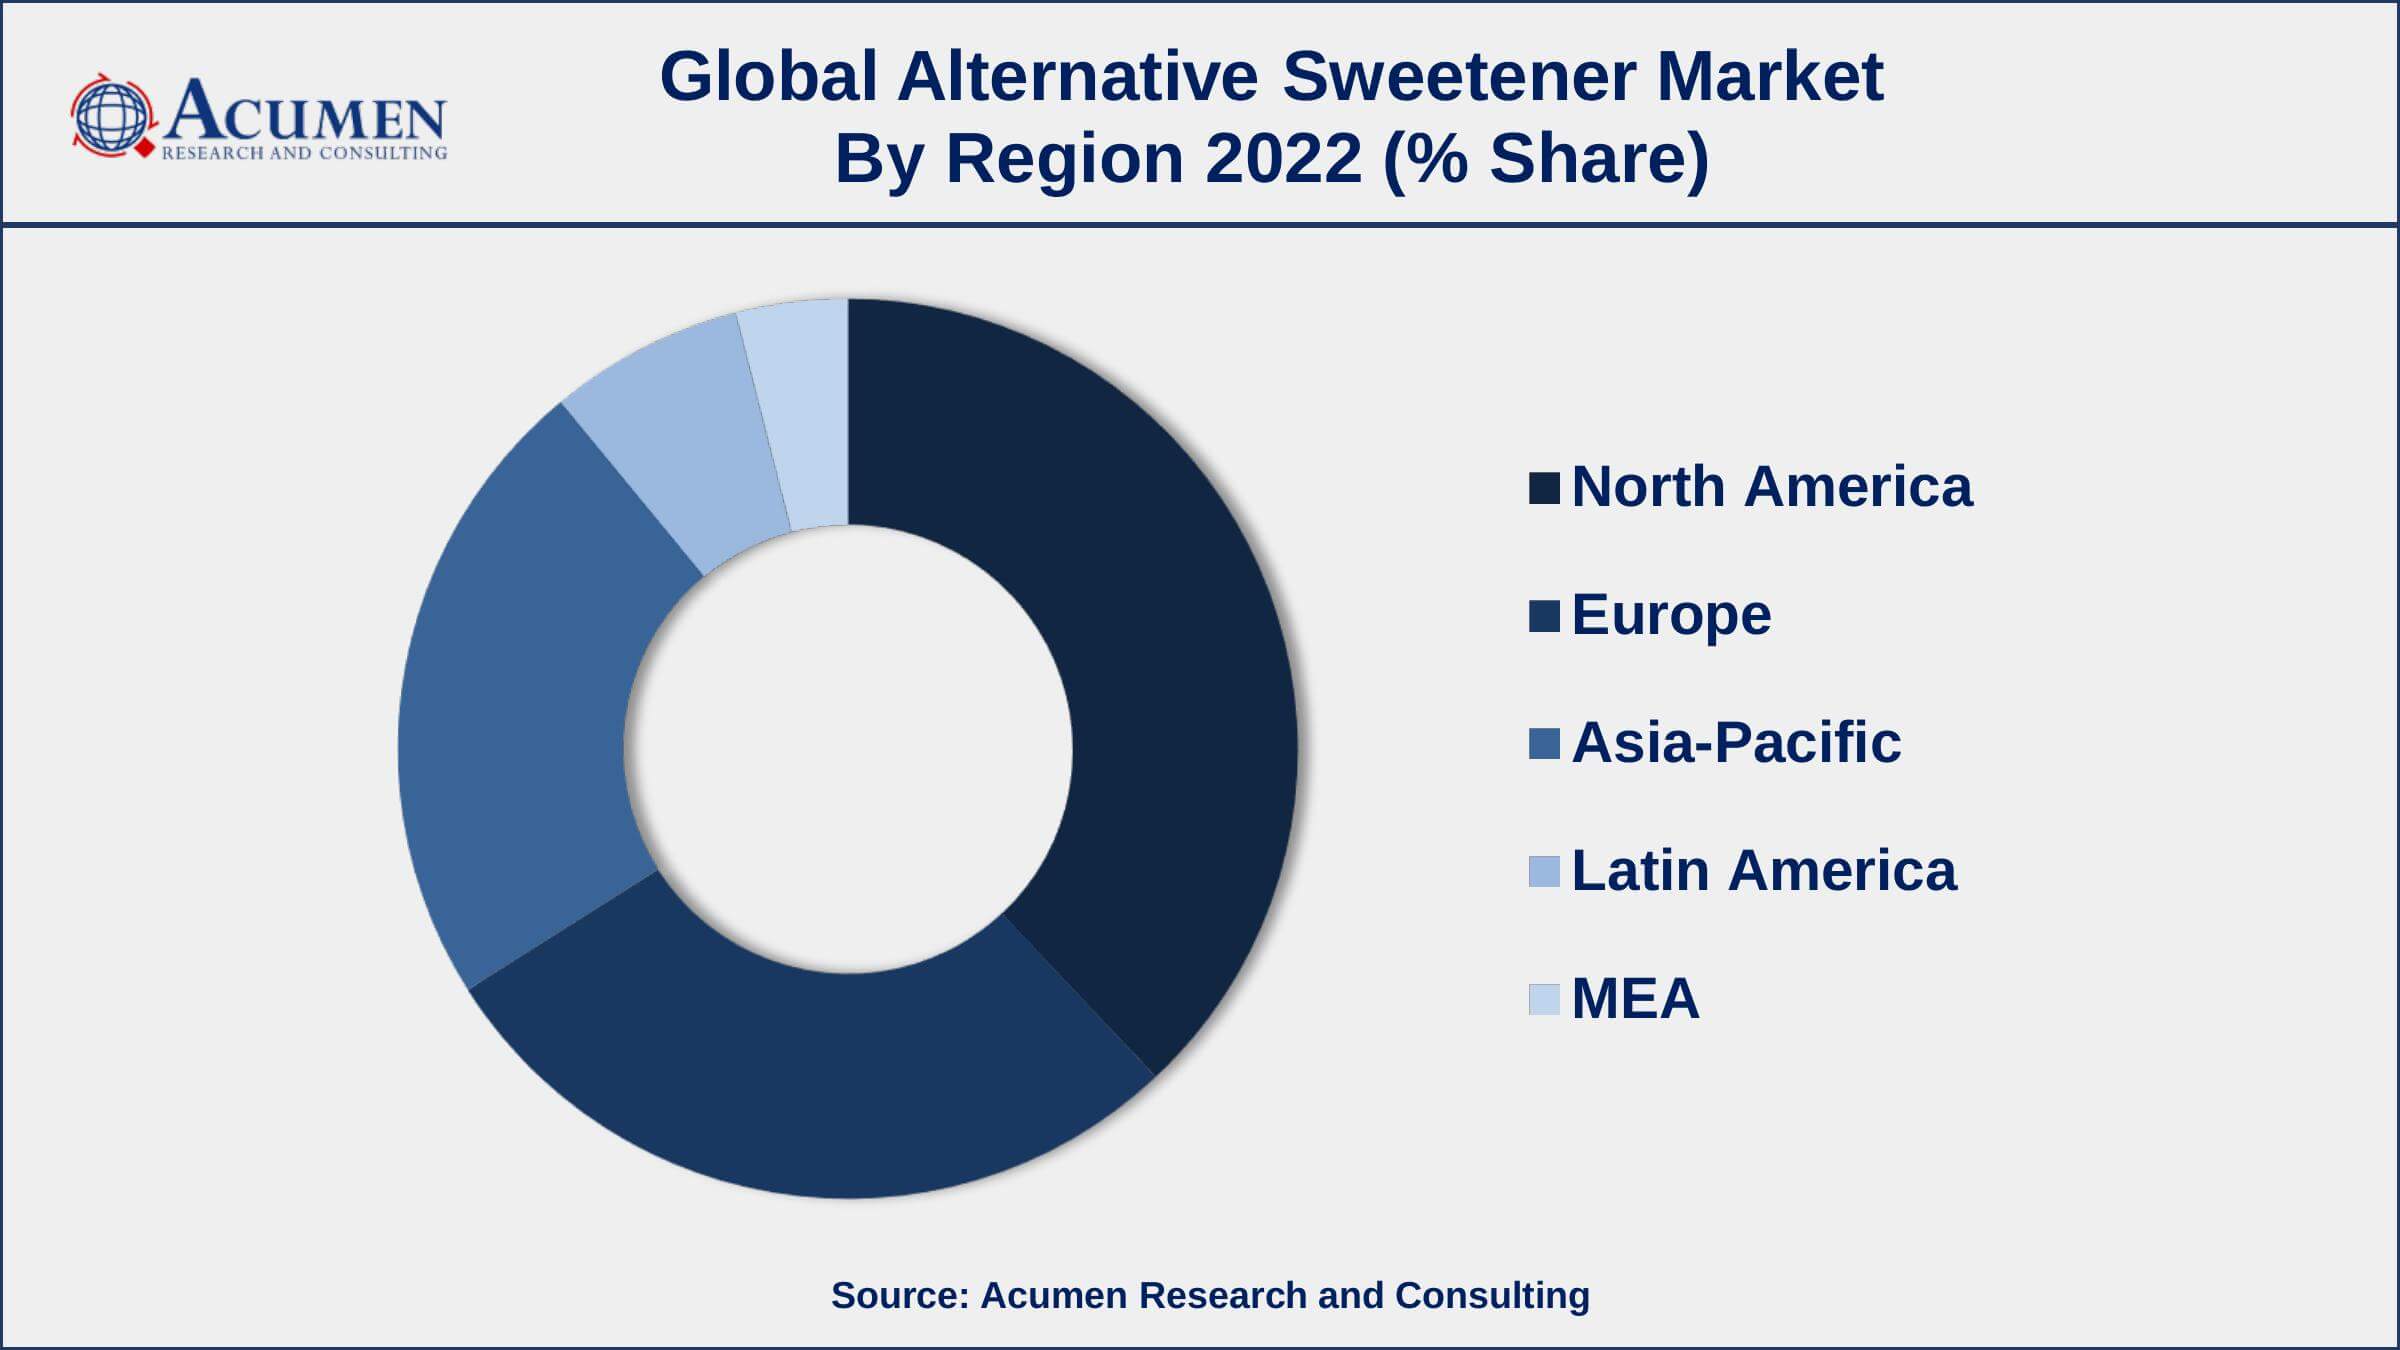
Geographically, North America is currently dominating the alternative sweetener market due to a variety of factors. One of the main reasons is the high demand for alternative sweeteners in the food and beverage industry, as consumers in the region have become more health-conscious and are looking for healthier options to traditional sugar. Additionally, the availability of a wide range of alternative sweeteners in the region, such as stevia, monk fruit, and erythritol, has also contributed to the market's growth. The region also benefits from a strong regulatory environment, which allows the fast development and commercialization of new products. The North American market is also driven by the growing demand for low-calorie, low-sugar, and natural sweeteners in the region. Furthermore, the high disposable income and strong purchasing power of consumers in the region are also contributing to the market's growth.
Alternative Sweetener Market Players
Some of the top alternative sweetener market companies offered in the professional report include Cargill Incorporated, GLG Life Tech Corporation, Archer Daniels Midland Company, Tate & Lyle, Heartland Food Products Group, Roquette Freres, DuPont de Nemours, Inc., Ingredion Inc., Ajinomoto Co., Inc., and JK Sucralose Inc.
Frequently Asked Questions
How big is the alternative sweetener market?
The alternative sweetener market size was USD 4,648 Million in 2022.
What is the CAGR of the global alternative sweetener market during forecast period of 2023 to 2032?
The CAGR of alternative sweetener market is 4.4% during the analysis period of 2023 to 2032.
Which are the key players operating in the market?
The key players operating in the global alternative sweetener market are Cargill Incorporated, GLG Life Tech Corporation, Archer Daniels Midland Company, Tate & Lyle, Heartland Food Products Group, Roquette Freres, DuPont de Nemours, Inc., Ingredion Inc., Ajinomoto Co., Inc., and JK Sucralose Inc.
Which region held the dominating position in the global alternative sweetener market?
North America held the dominating position in alternative sweetener market during the analysis period of 2023 to 2032.
Which region registered the fastest growing CAGR for the forecast period of 2023 to 2032?
Asia-Pacific region exhibited fastest growing CAGR for alternative sweetener market during the analysis period of 2023 to 2032.
What are the current trends and dynamics in the global alternative sweetener market?
The current trends and dynamics in the alternative sweetener industry include the increasing consumer demand for low-calorie and natural sweeteners and rising incidence of obesity and diabetes.
Which application held the maximum share in 2022?
The food and beverages application held the maximum share of the alternative sweetener market.


