Air Suspension Systems Market | Acumen Research and Consulting
Air Suspension Systems Market Size - Global Industry, Share, Analysis, Trends and Forecast 2022 - 2030
Published :
Report ID:
Pages :
Format : ![]()
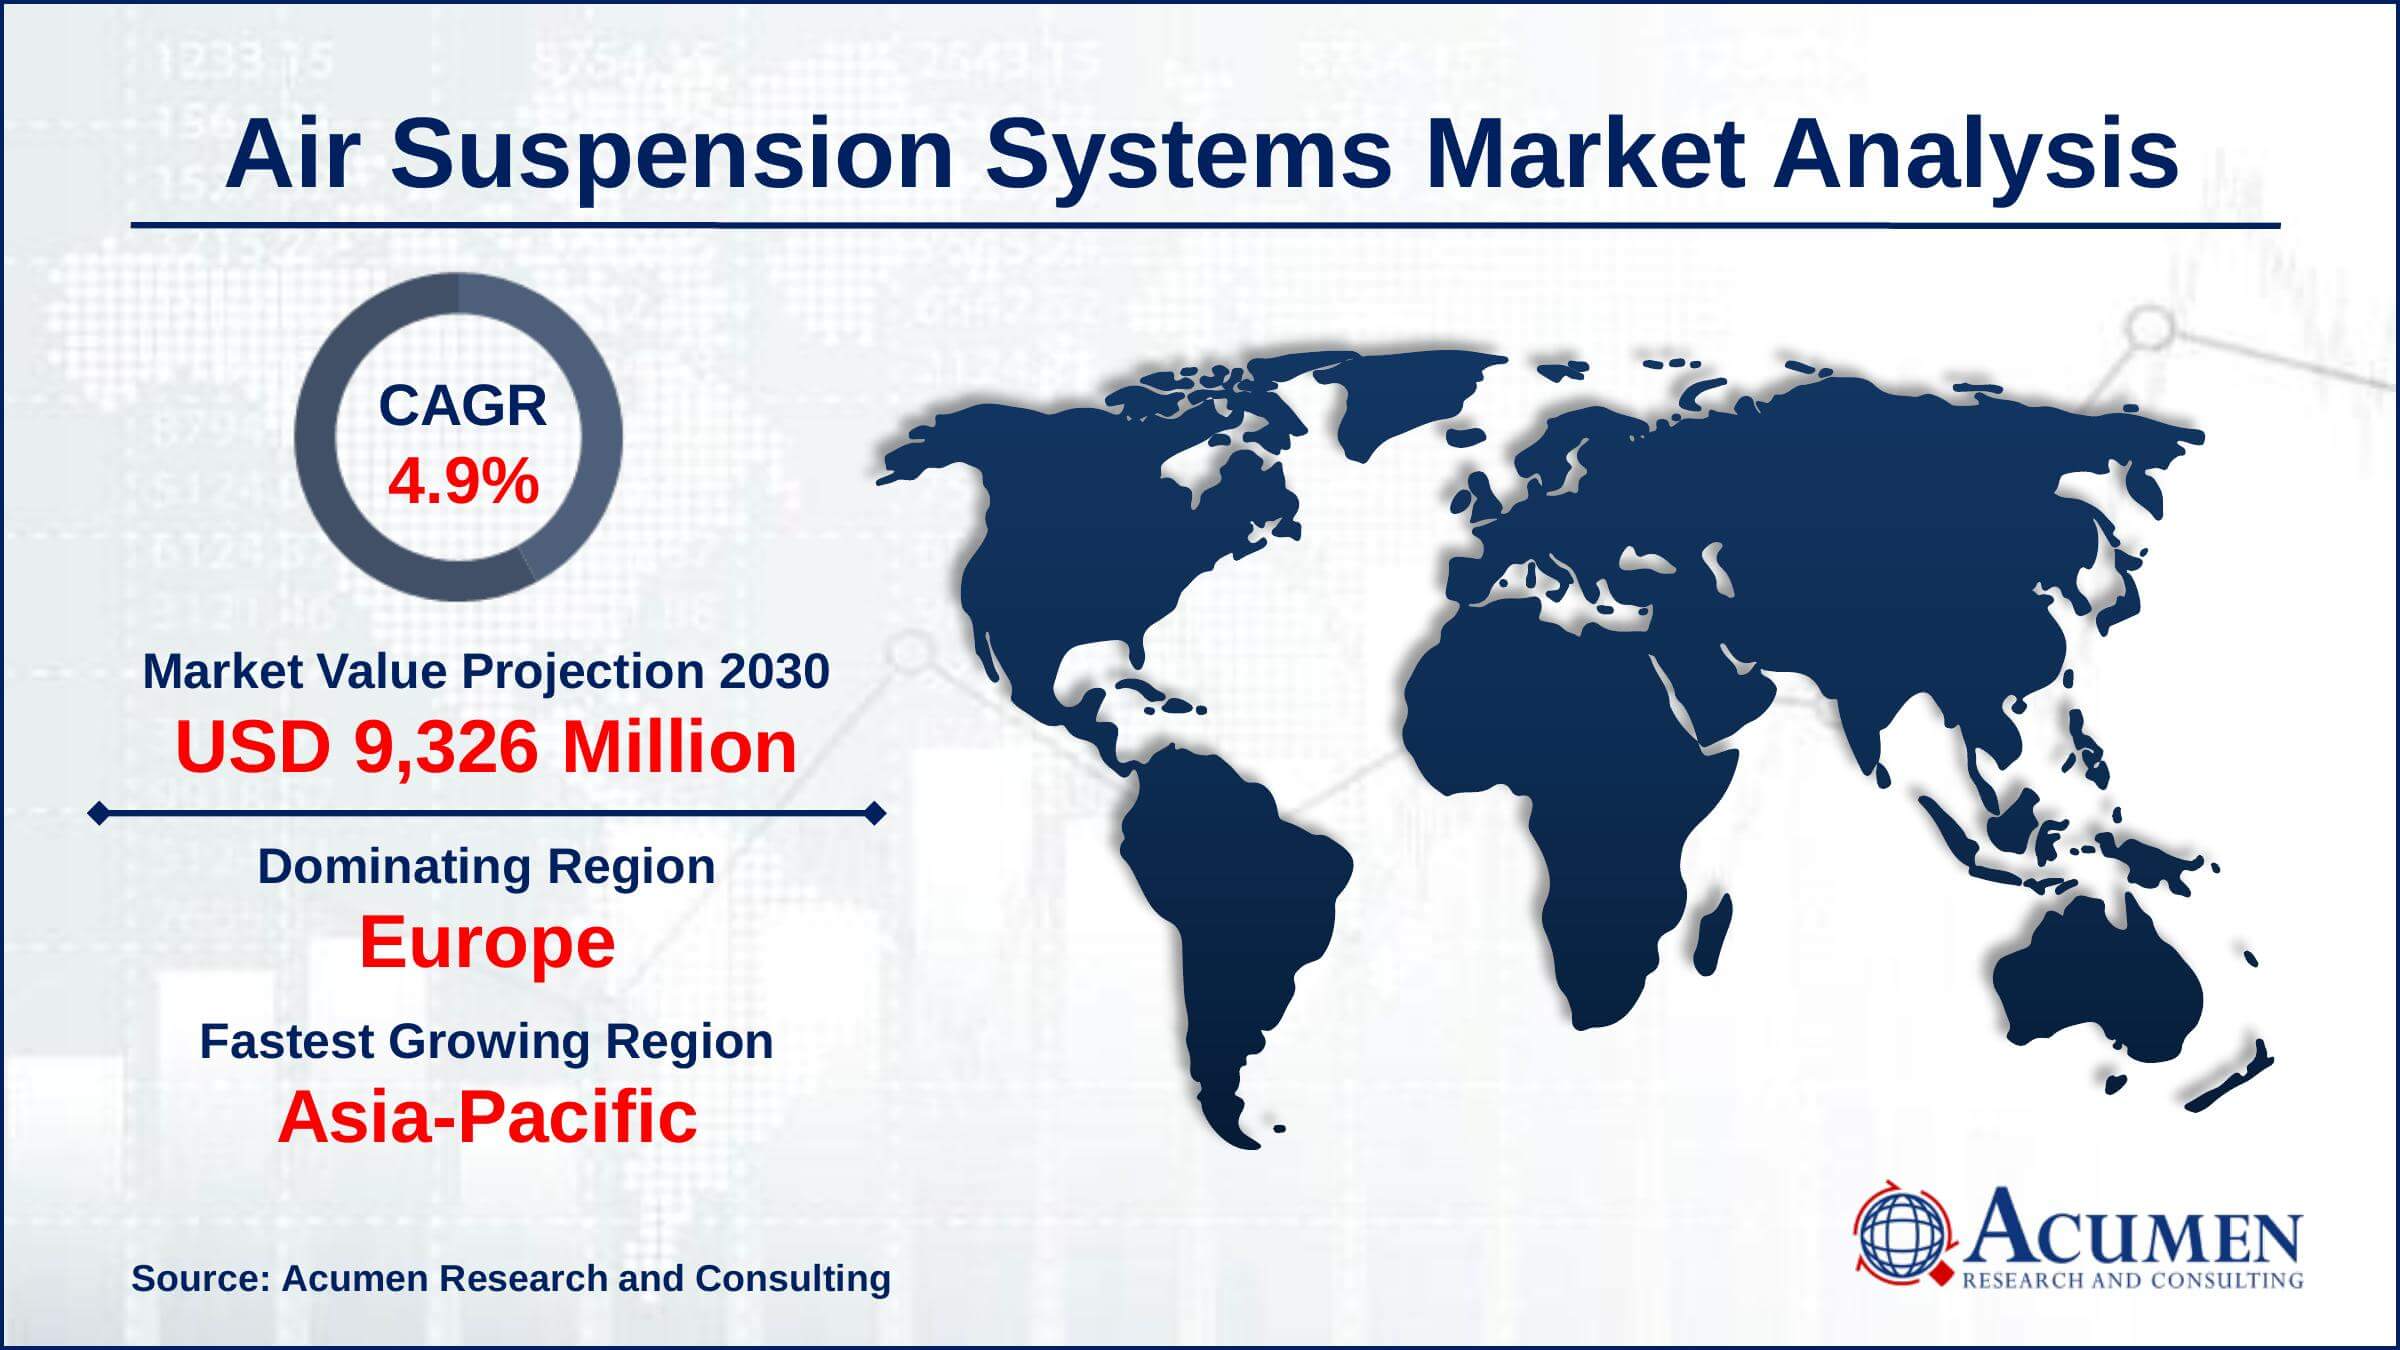
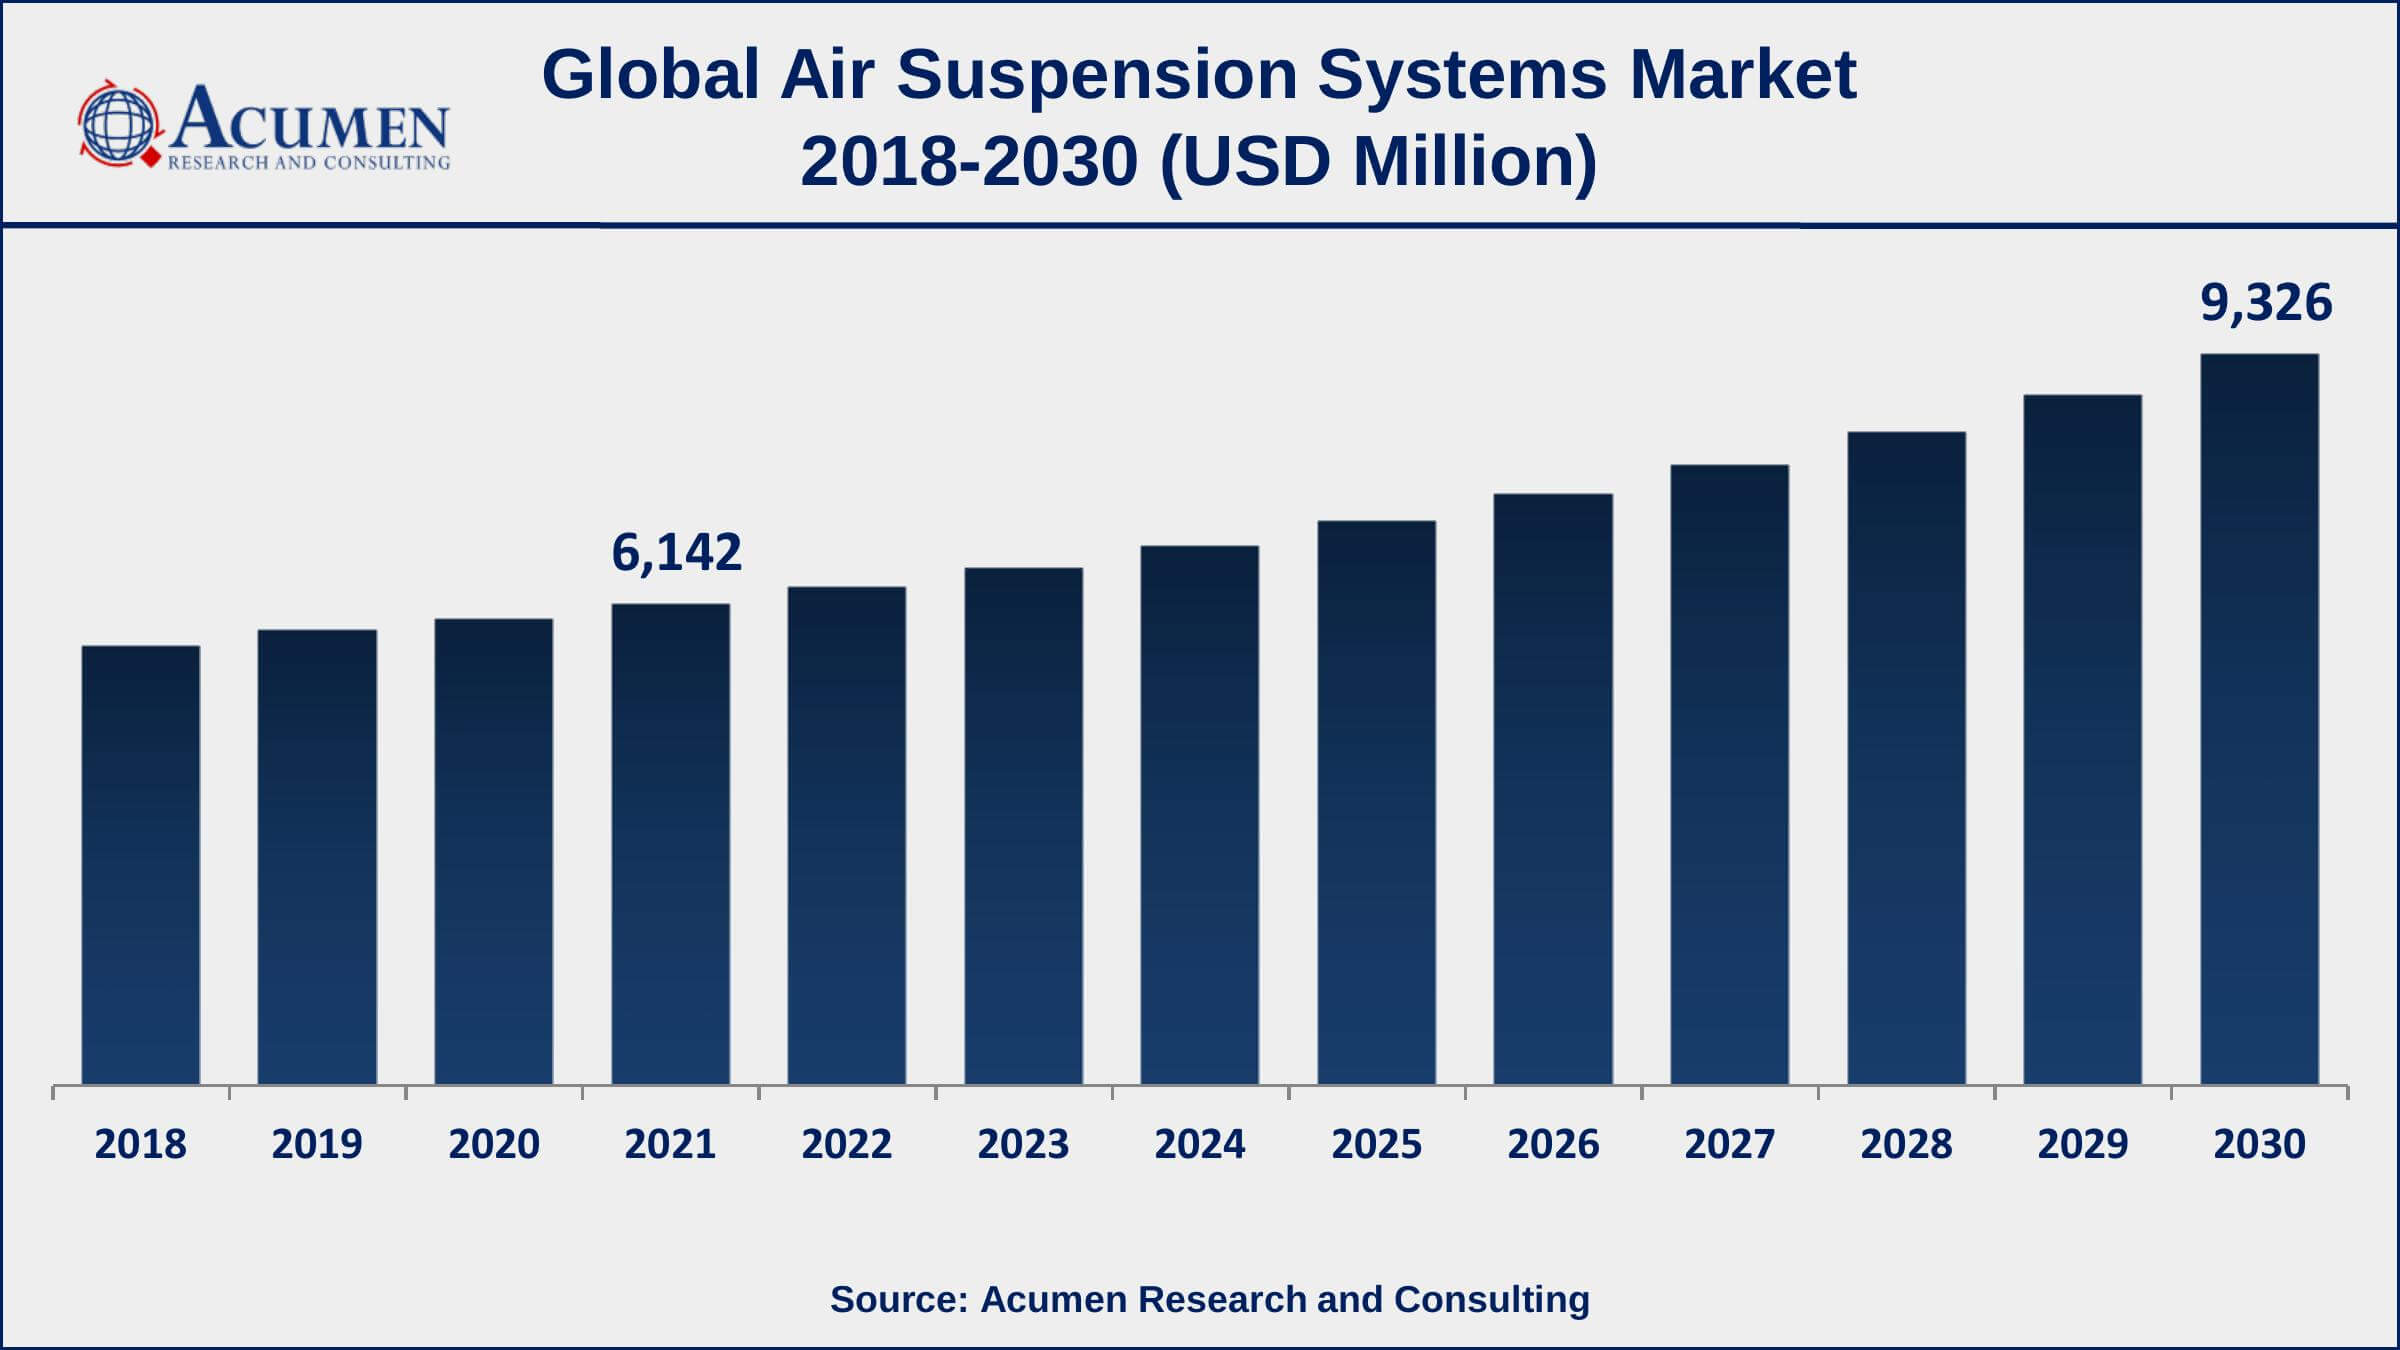
The Global Air Suspension Systems Market Size accounted for USD 6,142 Million in 2021 and is estimated to achieve a market size of USD 9,326 Million by 2030 growing at a CAGR of 4.9% from 2022 to 2030. The expanding customer preference for cars with the excellent suspension system, together with the growing importance of passenger & vehicle safety, is supporting the air suspension systems market value. Furthermore, increased aftermarket demand for air suspension and associated systems, as well as a growing adoption of lightweight air suspension systems, are likely to generate numerous opportunities for the air suspension systems market growth.
Air Suspension Systems Market Report Key Highlights
- Global air suspension systems market revenue is expected to increase by USD 9,326 million by 2030, with a 4.9% CAGR from 2022 to 2030
- Europe region led with more than 34% of air suspension systems market share in 2021
- Asia-Pacific air suspension systems market growth will observe strongest CAGR from 2022 to 2030
- By component, the air compressor segment has accounted market share of over 31% in 2021
- By technology, non-electronically controlled segment engaged more than 62% of the total market share in 2021
- Rising demand for premium and luxurious vehicles, drives the air suspension systems market size
Air suspension is a sort of vehicle suspension controlled by an electric or motor-driven pneumatic machine or compressor. This compressor siphons the air into adaptable howl, typically produced using material-strengthened elastic. The pneumatic force swells the bellows and raises the suspension from the pivot. Air suspension systems appeared in the mid-1900s. Since then different innovative upgrades and expanding entrances have prompted widespread acceptance of this suspension innovation. Further, air suspension systems are a sort of suspension framework that helps the vehicle on the axles with the incorporation of air springs (air packs) as an option for steel springs or regular leaf springs.
Global Air Suspension Systems Market Trends
Market Drivers
- Growing global commercial vehicle sales
- Rising demand for premium and luxurious vehicles
- Rapidly increasing e-commerce sector
- Increasing container transport and worldwide trade
Market Restraints
- High installation costs and a complicated structure
- Limited advancement and integration of sophisticated technology into the system
Market Opportunities
- Growing demands for a lightweight air suspension system
- Increasing demand for systems & related accessories in the aftermarket
Air Suspension Systems Market Report Coverage
| Market | Air Suspension Systems Market |
| Air Suspension Systems Market Size 2021 | USD 6,142 Million |
| Air Suspension Systems Market Forecast 2030 | USD 9,326 Million |
| Air Suspension Systems Market CAGR During 2022 - 2030 | 4.9% |
| Air Suspension Systems Market Analysis Period | 2018 - 2030 |
| Air Suspension Systems Market Base Year | 2021 |
| Air Suspension Systems Market Forecast Data | 2022 - 2030 |
| Segments Covered | By Component, By Technology, By Application, And By Geography |
| Regional Scope | North America, Europe, Asia Pacific, Latin America, and Middle East & Africa |
| Key Companies Profiled | Continental AG, Thyssenkrupp Bilstein GmbH, WABCO Holdings, Inc., Firestone Industrial Products Company LLC, Drive-Rite Ltd, Hitachi Automotive Systems Americas, Inc., BWI Group, Dunlop Systems and components, ZF Friedrichshafen AG, and AB Volvo. |
| Report Coverage |
Market Trends, Drivers, Restraints, Competitive Analysis, Player Profiling, Regulation Analysis |
The growing population along with the rising disposable income of people worldwide is driving the growth of the automobile industry. The increasing demand for luxury automobiles is therefore responsible for the high demand for air suspension systems. Consumers demand vehicles that are high in comfort, luxury, and safety. The comfort of the vehicle lies in the working of air suspension systems. Suspension systems are utilized to decrease shocks/vibrations transmitted to the vehicle body from the road/terrain being traveled in order to increase driver/passenger comfort and protect the chassis and cargo. Distinctive designs are cooperation between performance measures such as energy consumption, handling, vehicle ride, size constraints, and load capacity. These factors are responsible for the high demand for the global air suspension market growth.
The growing demands for public transport and heavy-duty trucks, passenger vehicles, including luxury automobiles to sustain contact between both the tire and the pavement and prevent road vibrations is propelling the global air suspension market value. A smoother ride increases comfort for riders, decreases cargo damage, as well as minimizes drowsy driving on long excursions, which can contribute to the need for an air suspension system. Air suspension is primarily responsible for the quality of trips and automobile handling control, since vehicles with company suspension may result in higher body control of motions and faster reactions, which may drive the air suspension market size.

Air Suspension Systems Market Segmentation
The global air suspension systems market segmentation is based on component, technology, application, and geography.
Air Suspension Systems Market By Component
- Electronic Control Unit
- Shock Absorber
- Solenoid Valve
- Air Spring
- Air Compressor
- Height and Pressure Sensors
- Others
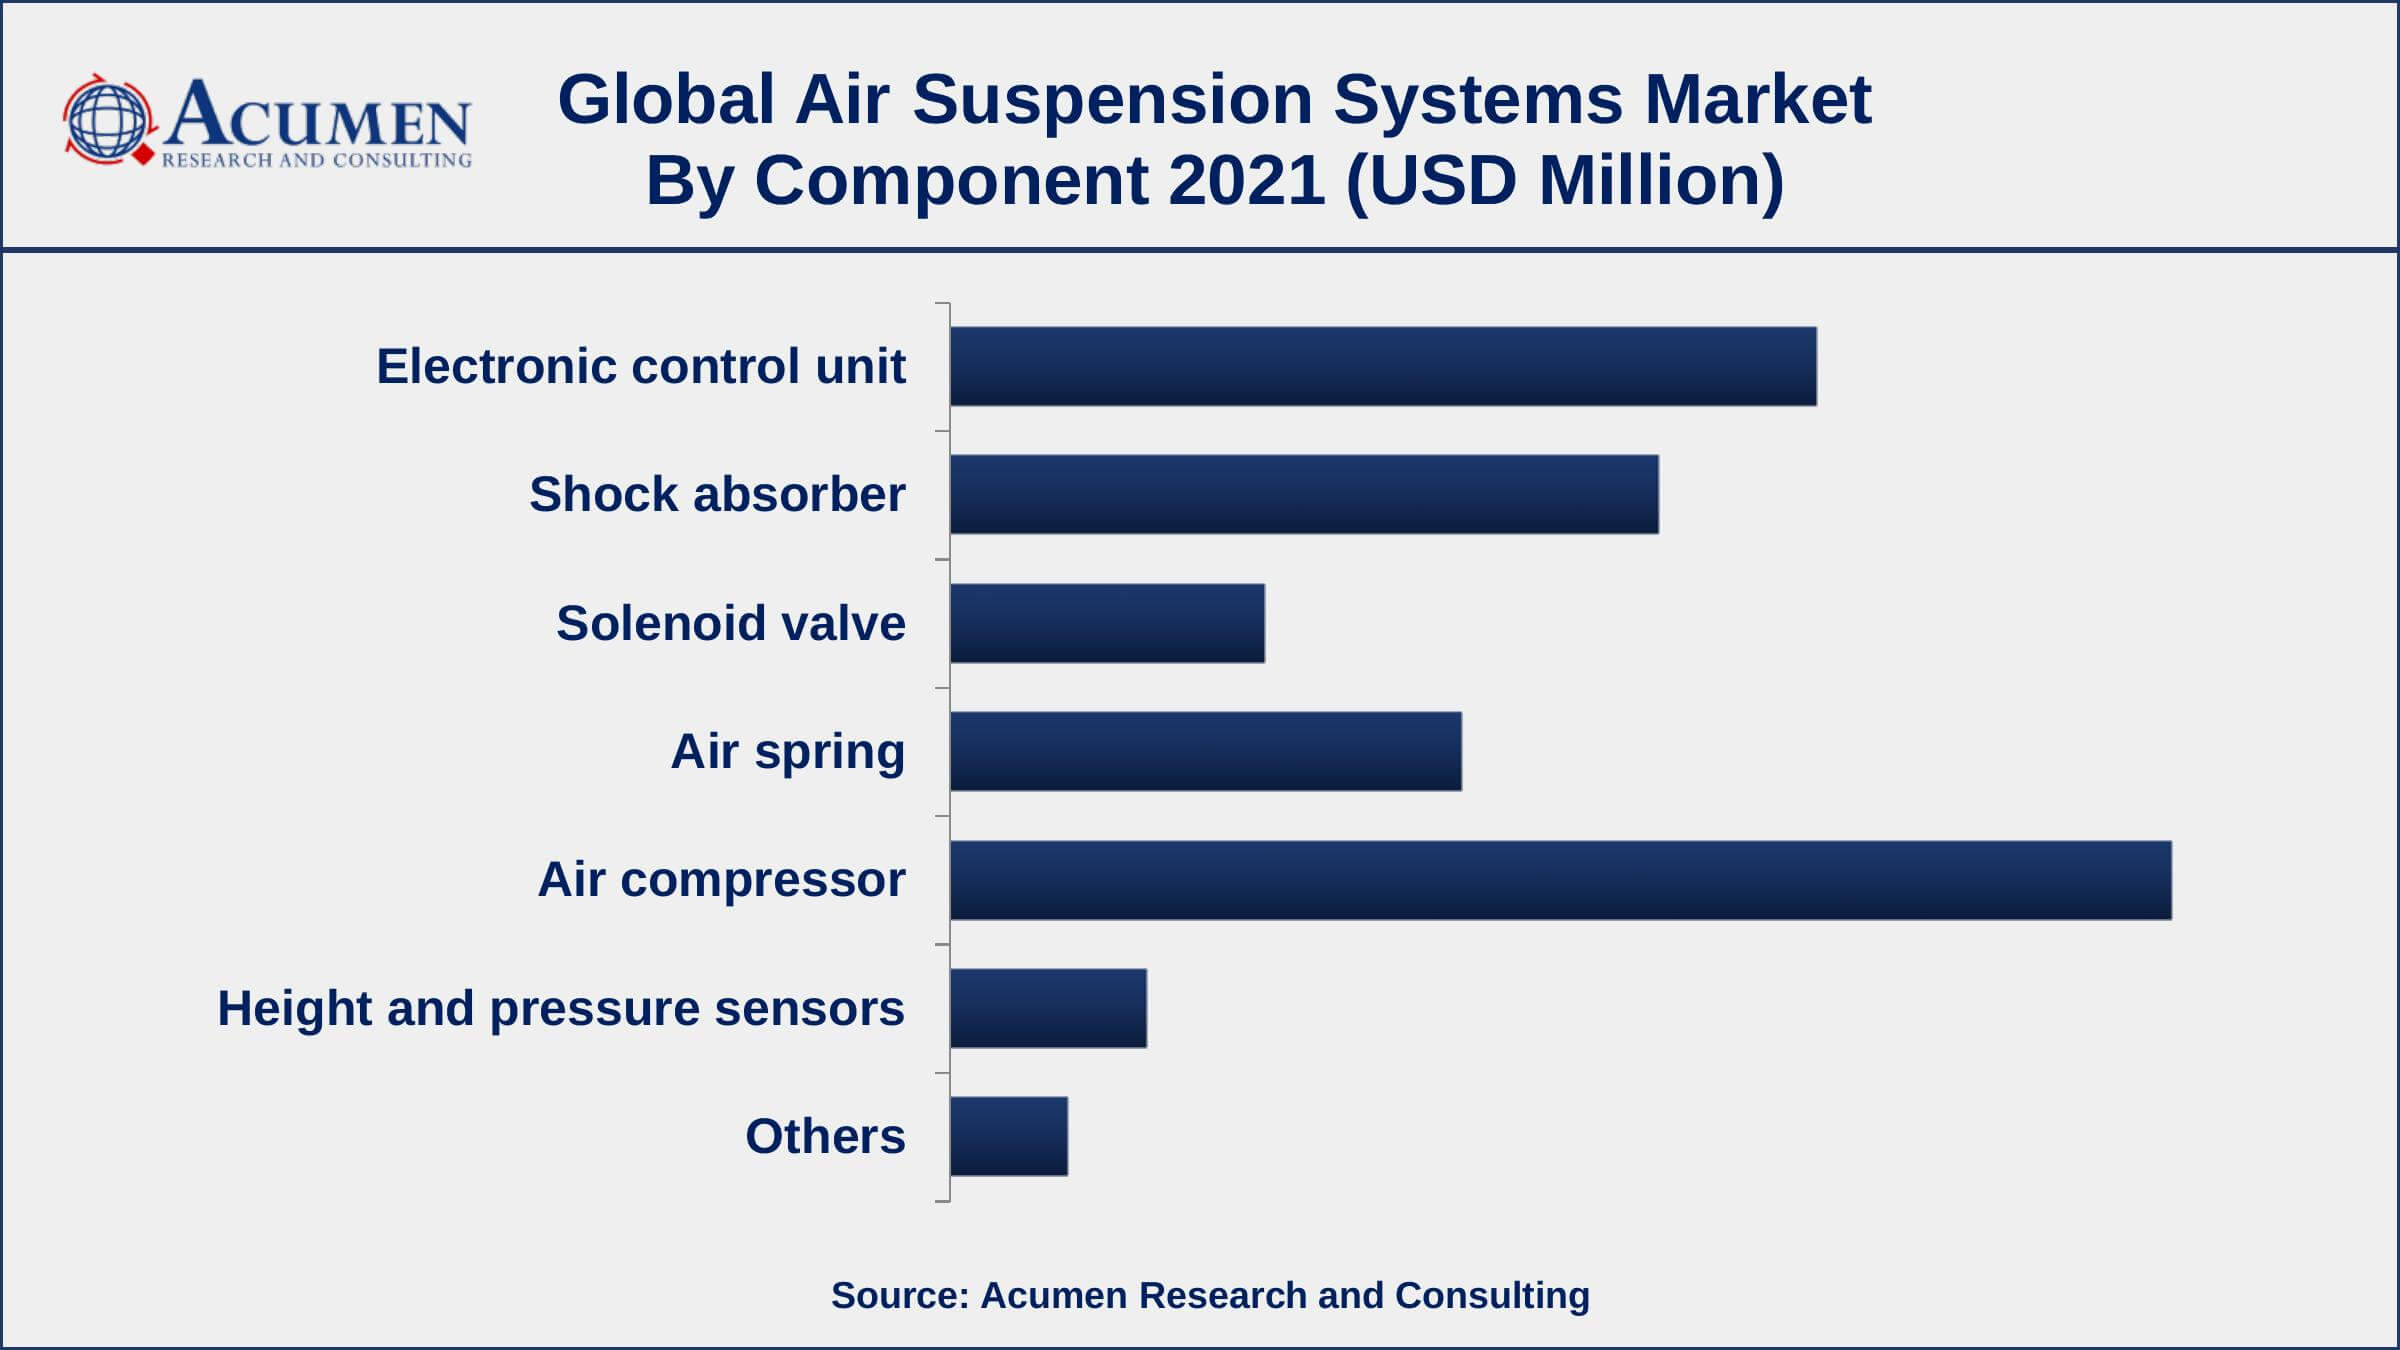
According to the air suspension systems market forecast, the electronic control unit component sector is projected to see considerable growth in the coming years. This growth is due to a growing preference for products that can help boost performance. It is an essential component of the electrically operated air suspension system, ensuring increased vibration absorbance and steering control. The rising use of parts such as lines, solenoid valves, and so on that inflate and exhaust each airbag and may be modified in various situations is driving up demand for the electronic control unit.
Air Suspension Systems Market By Technology
- Electronically Controlled Air Suspension
- Non-Electronically Controlled Air Suspension
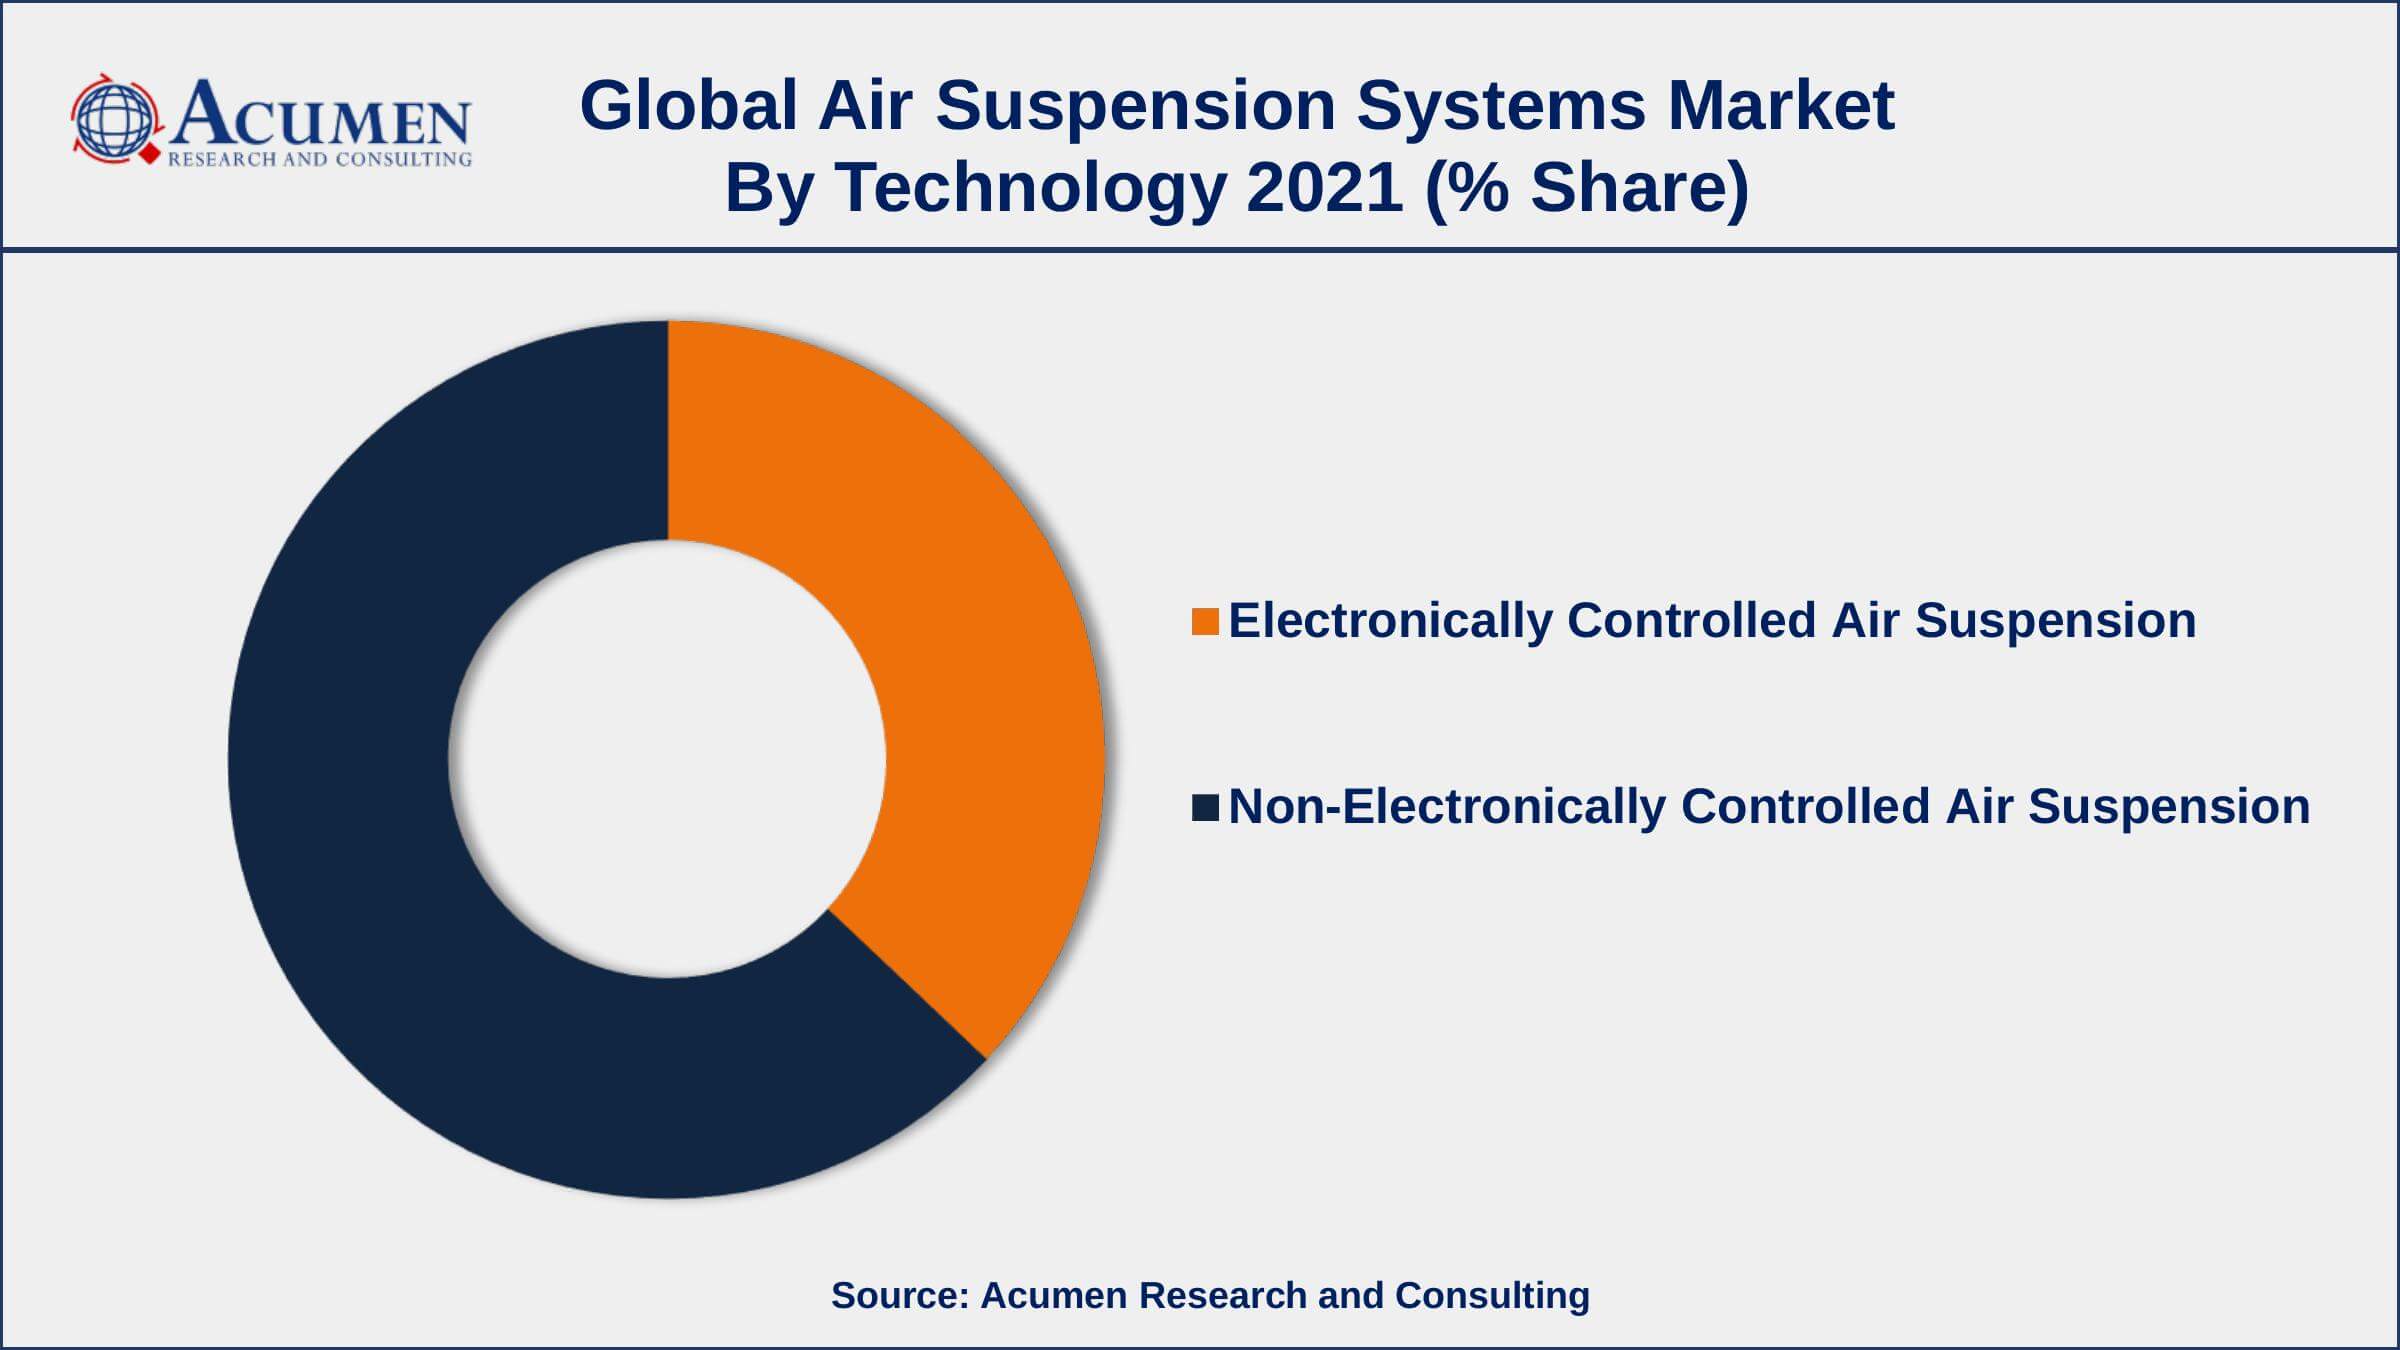
In terms of technologies, the electronically controlled air suspension segment is predicted to grow significantly in the market over the next few years. The growing need for electronic control system technologies in premium vehicles is driving up the demand for the electronically controlled air suspension. The growth is due to the adaptation of technologically enhanced equipment. The electronically controlled air suspension also includes elevation sensors that recognize friction in interface with the environment on all corners of the automobile that can provide elevation references for all four edges. Furthermore, developments are starting to include a few electronic control systems that may fit under the vehicle's footwell, enabling air suspension increasingly widely accessible.
Air Suspension Systems Market By Application
- Commercial Vehicle
- Passenger Cars
According to an air suspension systems industry analysis, the commercial segment capture a substantial market share in 2021. The rising demand for commercial trucks and buses that provide efficient transportation and cargo comfort is propelling the market forward. Moreover, the growing demand for higher ride comfort in specific applications including cold storage facilities and fragile product delivery has a favorable influence on commercial automobile sales and is supporting market growth.
Air Suspension Systems Market Regional Outlook
North America
- U.S.
- Canada
Europe
- U.K.
- Germany
- France
- Spain
- Rest of Europe
Asia-Pacific
- India
- Japan
- China
- Australia
- South Korea
- Rest of Asia-Pacific
Latin America
- Brazil
- Mexico
- Rest of Latin America
The Middle East & Africa
- South Africa
- GCC Countries
- Rest of the Middle East & Africa (ME&A)
Europe Dominates The Global Air Suspension Systems Market
In terms of geography, Europe is predicted to dominate the air suspension system market in 2021. The expansion of the construction industry, together with the predominance of regulatory requirements in Europe or other advanced nations, is likely to fuel the market expansion in the continent. The existence of multiple auto OEMs with product offerings that include sports & luxury cars is projected to drive market growth. Furthermore, substantial economic expansion in nations such as the United Kingdom, Spain, as well as Germany, combined with increased investment, is creating ample growth potential for the regional industry. During the projection period, Asia-Pacific is predicted to grow significantly. Growing technological sophistication and advancements in the automotive market in this region propel the market even further.
Air Suspension Systems Market Players
Some of the top air suspension systems market companies offered in the professional report include Continental AG, Thyssenkrupp Bilstein GmbH, WABCO Holdings, Inc., Firestone Industrial Products Company LLC, Drive-Rite Ltd, Hitachi Automotive Systems Americas, Inc., BWI Group, Dunlop Systems and components, ZF Friedrichshafen AG, and AB Volvo.
Frequently Asked Questions
What is the size of global air suspension systems market in 2021?
The estimated value of global air suspension systems market in 2021 was accounted to be USD 6,142 Million.
What is the CAGR of global air suspension systems market during forecast period of 2022 to 2030?
The projected CAGR air suspension systems market during the analysis period of 2022 to 2030 is 4.9%.
Which are the key players operating in the market?
The prominent players of the global air suspension systems market are Continental AG, Thyssenkrupp Bilstein GmbH, WABCO Holdings, Inc., Firestone Industrial Products Company LLC, Drive-Rite Ltd, Hitachi Automotive Systems Americas, Inc., BWI Group, Dunlop Systems and components, ZF Friedrichshafen AG, and AB Volvo.
Which region held the dominating position in the global air suspension systems market?
Europe held the dominating air suspension systems market during the analysis period of 2022 to 2030.
Which region registered the fastest growing CAGR for the forecast period of 2022 to 2030?
Asia-Pacific region exhibited fastest growing CAGR for air suspension systems market during the analysis period of 2022 to 2030.
What are the current trends and dynamics in the global air suspension systems market?
Growing global commercial vehicle sales and rising demand for premium and luxurious vehicles drives the growth of global air suspension systems market.
By technology segment, which sub-segment held the maximum share?
Based on technology, non-electronically controlled air suspension segment is expected to hold the maximum share of the air suspension systems market.


