Air Quality Monitoring Market Size - Global Industry, Share, Analysis, Trends and Forecast 2023 - 2032
Published :
Report ID:
Pages :
Format :
Air Quality Monitoring Market Size - Global Industry, Share, Analysis, Trends and Forecast 2023 - 2032
Report Coverage
- Industry Dynamics
- Market Size and Forecast Data
- Segment Analysis
- Competitive Landscape
- Regional Analysis with a Niche Focus on Country-Level Data
- High Level Analysis - Porter's, PESTEL, Value Chain, etc.
- Company Profiles of Key Players
- Option to Customize the Report As Per Your Specific Need
Request Sample Report
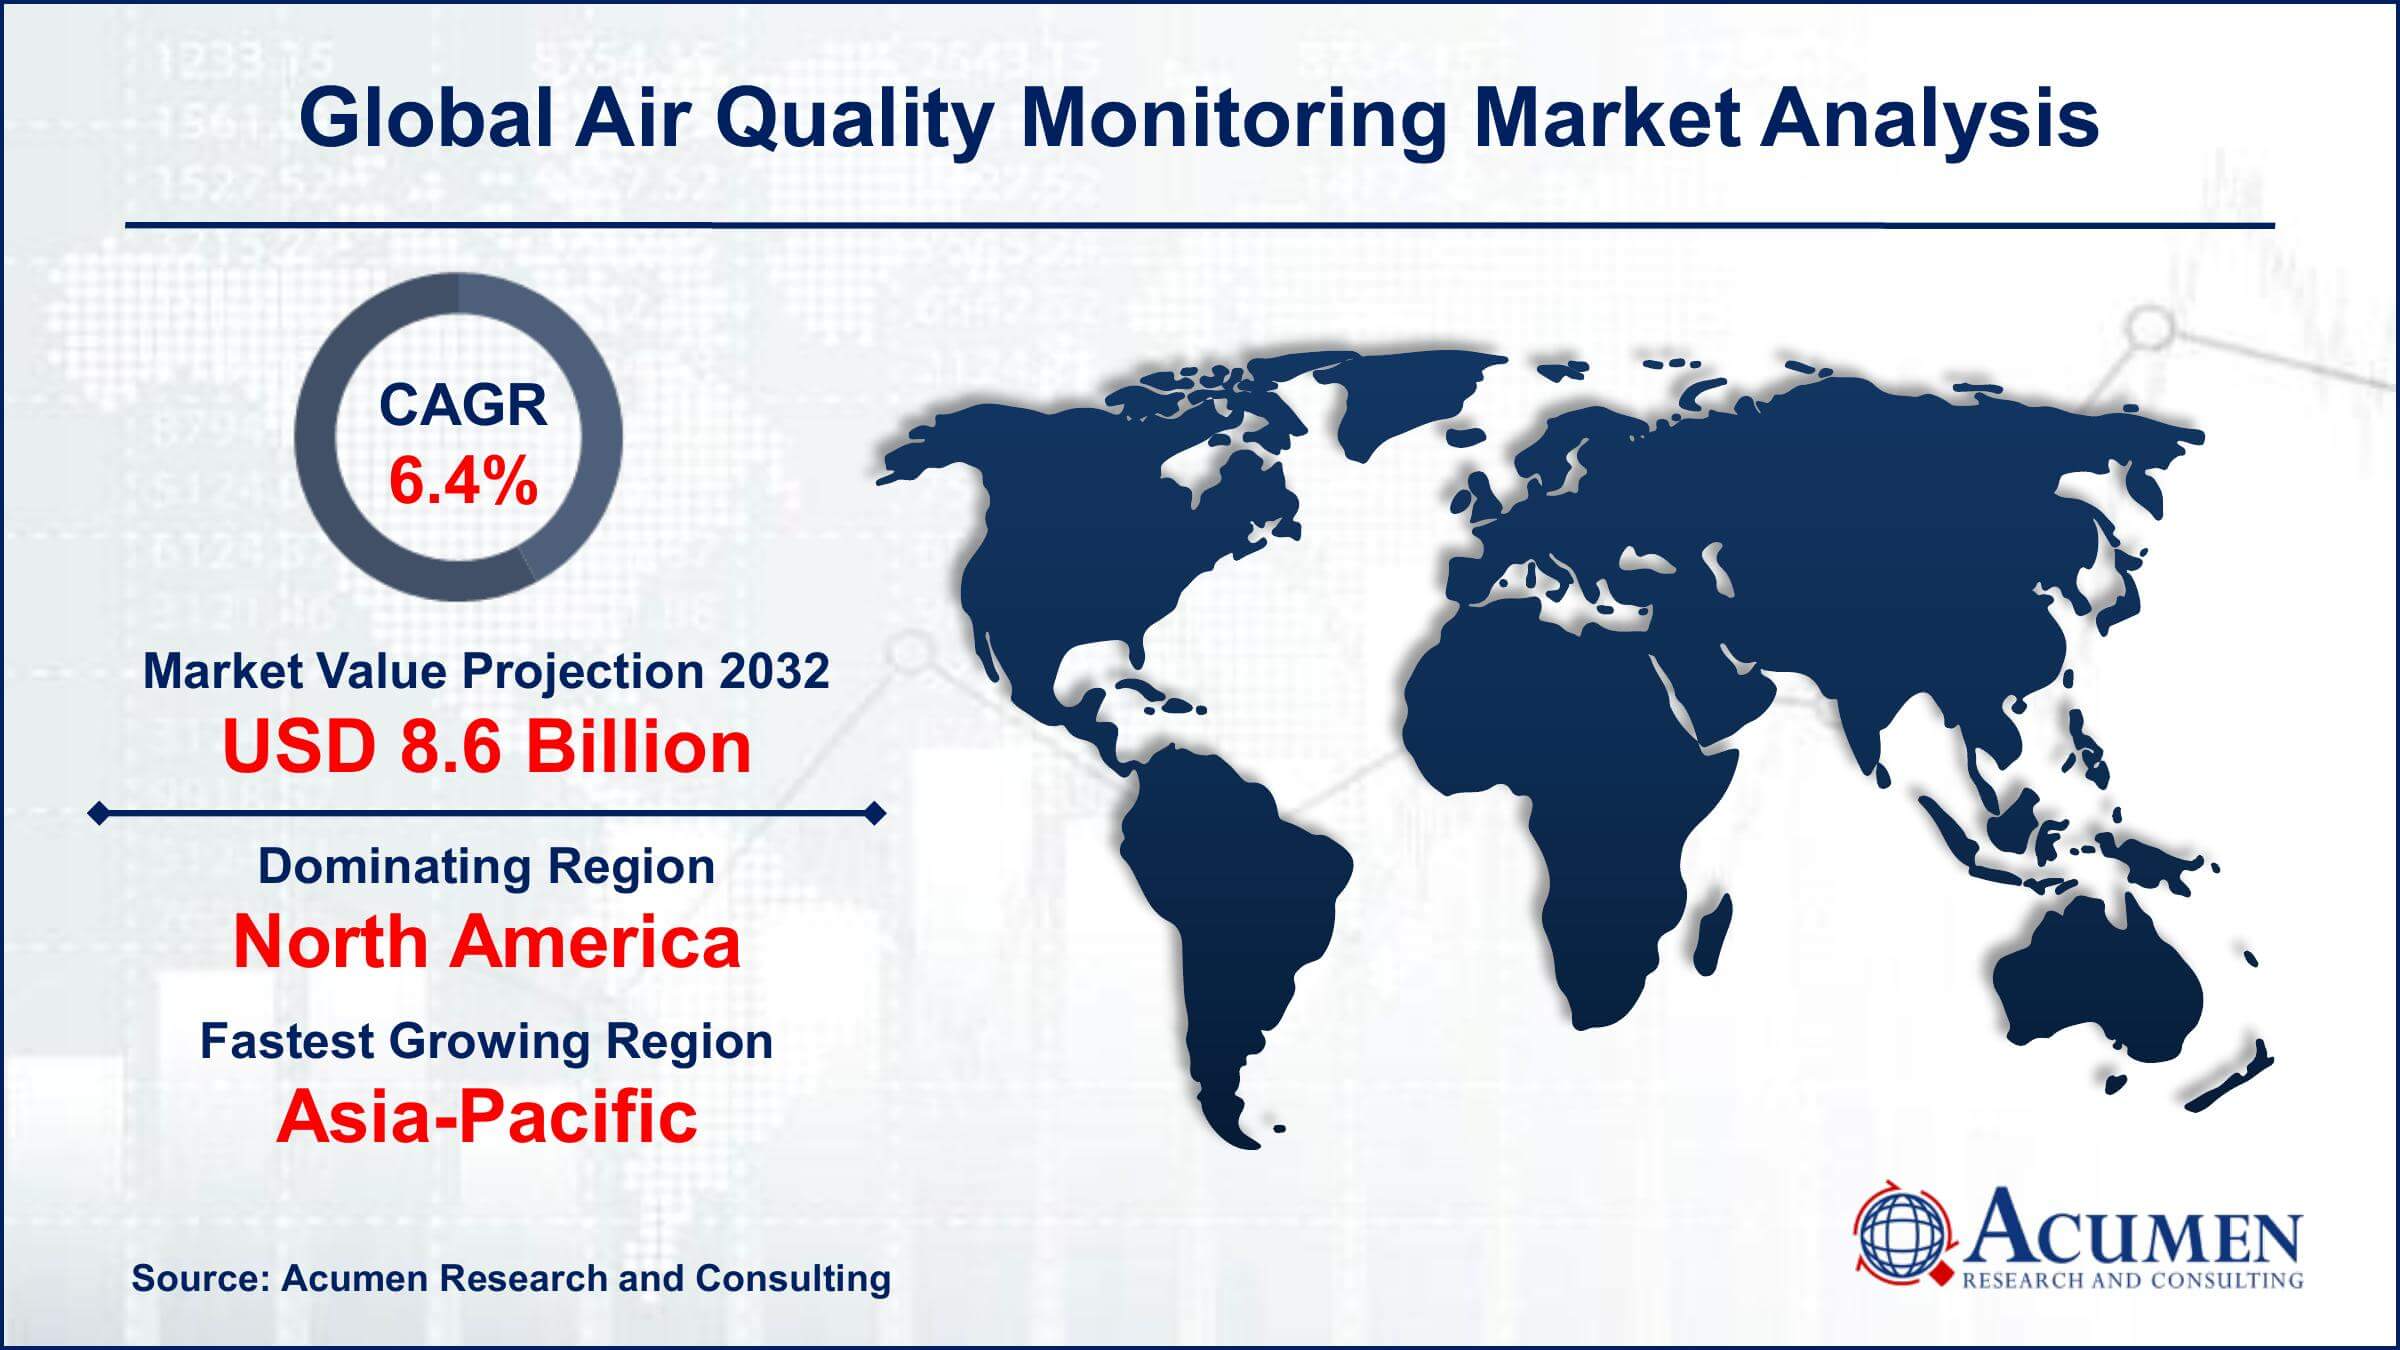
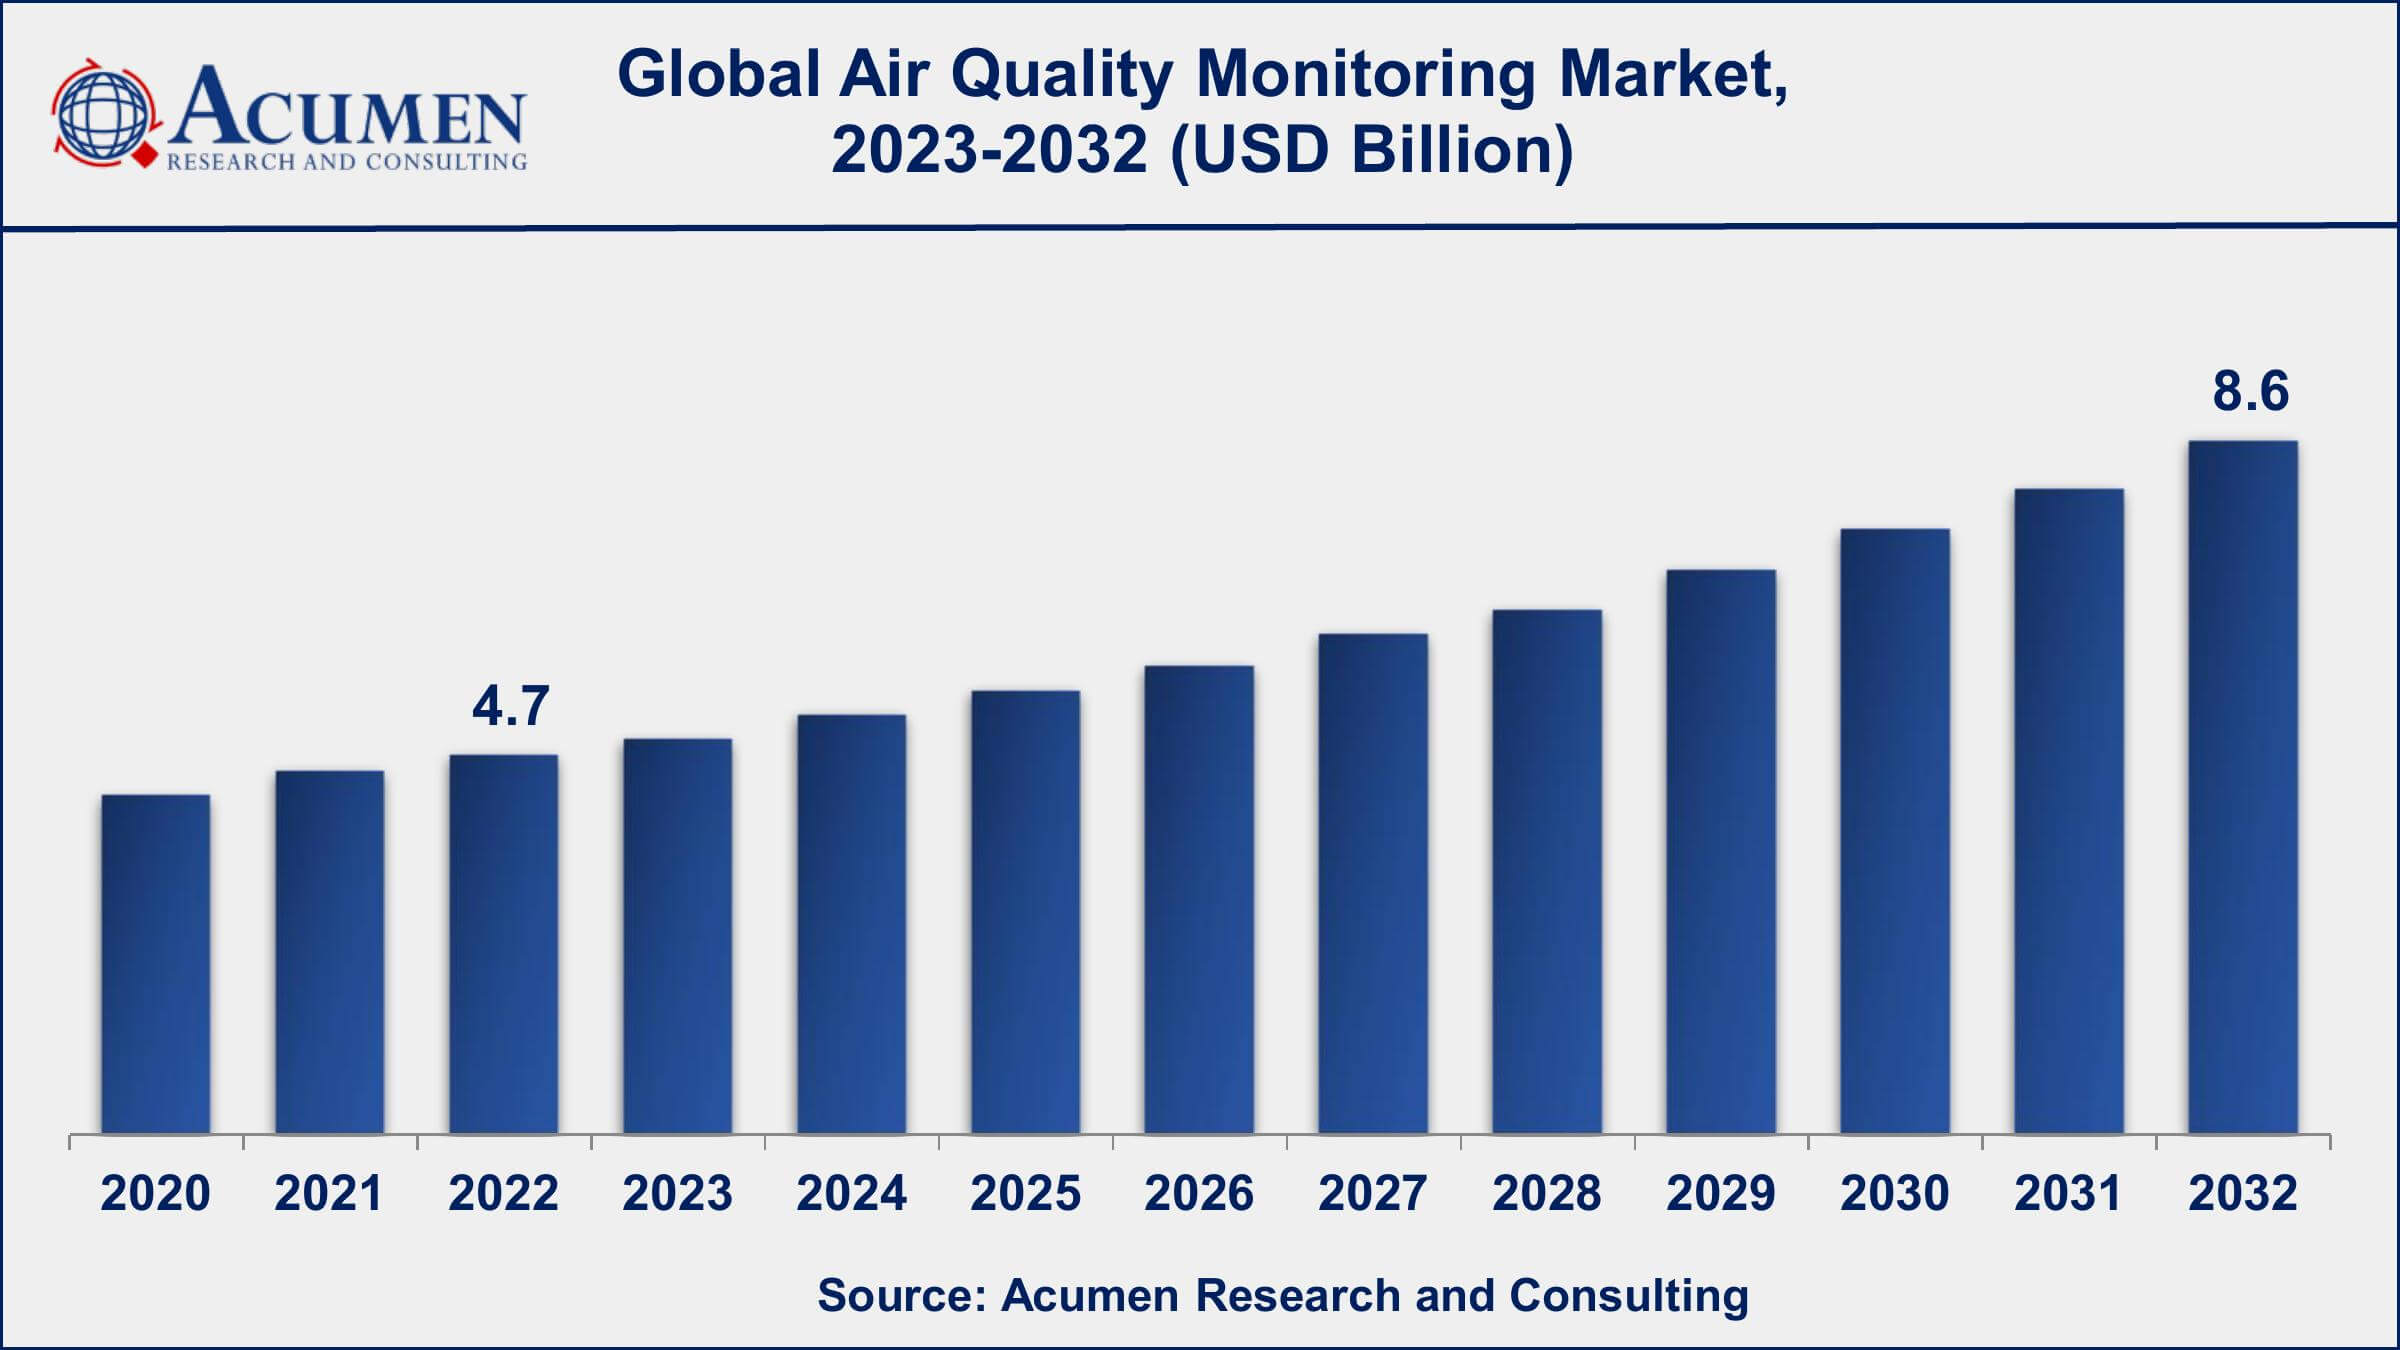
The Global Air Quality Monitoring Market Size collected USD 4.7 Billion in 2022 and is set to achieve a market size of USD 8.6 Billion in 2032 growing at a CAGR of 6.4% from 2023 to 2032.
Air Quality Monitoring Market Report Statistics
- Global air quality monitoring market revenue is estimated to reach USD 8.6 Billion by 2032 with a CAGR of 6.4% from 2023 to 2032
- North America air quality monitoring market value occupied more than USD 1.8 billion in 2022
- Asia-Pacific air quality monitoring market growth will record a CAGR of over 6% from 2023 to 2032
- Among product type, the outdoor sub-segment generated around 60% share in 2022
- Based on pollutant type, the chemical generated more than US $ 2.6 billion revenue in 2022
- Increasing adoption of wearable air quality monitors is a popular air quality monitoring market trend that fuels the Industry demand
Air quality monitoring is a process of monitoring the quality of air in the surrounding environment and such monitors are developed in accordance with EEC directives that are relevant to monitoring emissions and controlling pollutants released from large combustion plants. Air quality monitors are responsible for maintaining the quality of air in closest spaces as well as open spaces. Demand for indoor air quality monitors is on the rise due to increasing awareness towards health and hygiene among consumers. Activities like painting and cooking can deteriorate the quality of air inside the house by releasing smoke and other particulate matters. DIY hobbies and cleaning can pave the way for introduction of Volatile Organic Compounds (VOCs) in households which has several negative effects on human health. Air quality monitors are gaining significant demand due to increasing cases of air pollution.
Further, air quality monitors are used to detect the intensity of pollutants such as carbon monoxide, nitrous oxide, sulfur dioxide and other harmful gases. Increasing air pollution levels across the globe is one of the key factors driving the demand for air quality monitors. Increasing vehicle population in some of the developed and developing countries such as the U.S., India, and China among others have resulted in increased levels of pollution released from the vehicles. Thus, demand for air quality monitors is on the rise and the impact of this driver is likely to remain high over the forecast period.
Global Air Quality Monitoring Market Dynamics
Market Drivers
- Increasing awareness of air pollution
- Government regulations and initiatives
- Rising industrialization and urbanization
Market Restraints
- High initial and operating costs
- Challenges in data management and analysis
Market Opportunities
- Growing demand for indoor air quality monitoring
- Integration with IoT platforms
- Use of big data and AI
Air Quality Monitoring Market Report Coverage
| Market | Air Quality Monitoring Market |
| Air Quality Monitoring Market Size 2022 | USD 4.7 Billion |
| Air Quality Monitoring Market Forecast 2032 | USD 8.6 Billion |
| Air Quality Monitoring Market CAGR During 2023 - 2032 | 6.4% |
| Air Quality Monitoring Market Analysis Period | 2020 - 2032 |
| Air Quality Monitoring Market Base Year | 2022 |
| Air Quality Monitoring Market Forecast Data | 2023 - 2032 |
| Segments Covered | By Product Type, By Pollutant Type, By End-User Industry, And By Geography |
| Regional Scope | North America, Europe, Asia Pacific, Latin America, and Middle East & Africa |
| Key Companies Profiled | 3M Co., Emerson Electric Co., General Electric Company, Horiba, Ltd., Merck KGaA, Servomex Group Ltd., Siemens A.G., Teledyne Technologies Inc., Testo AG, and Thermo Fisher Scientific, Inc. |
| Report Coverage |
Market Trends, Drivers, Restraints, Competitive Analysis, Player Profiling, Covid-19 Analysis, Regulation Analysis |
Air Quality Monitoring Market Growth Factors
The rapid demand for air quality monitors is also attributed to the initiatives taken by regulating bodies regarding industrial emissions. The increasing levels of pollution have become a major concern for everyone due to the set-up of several new manufacturing plants across the globe. Additionally, high demand is also attributed to the increasing awareness towards health and wellness among the consumer and the urge to install air quality monitors inside their homes to maintain a clean environment.
However, high cost of such products is likely to inhibit the growth of air quality monitoring market. High cost of air quality monitoring devices is expected to restrict the market growth mainly in developing countries as the consumers in these countries refrain themselves from buying such products due to the higher cost. Less awareness towards the use of such products among the consumers is another major factor barring the growth of the market. However, rising industrialization in the developing countries is expected to be a suitable opportunity for the growth of this market. Penetration of new industries in the developing countries would result in the increase in level of pollution and therefore, would complement the growth of air quality monitoring market. Technological advancement is another suitable opportunity for the growth of air quality monitoring market. Increasing scope in the field of research and development would ensure the introduction of new and advanced air quality monitors in the future, thus complementing the growth of the market.
Air Quality Monitoring Market Segmentation
The worldwide air quality monitoring market is categorized based on product type, pollutant type, distributional channel, and geography.
Air Quality Monitoring Market By Product Type
- Indoor
- Outdoor
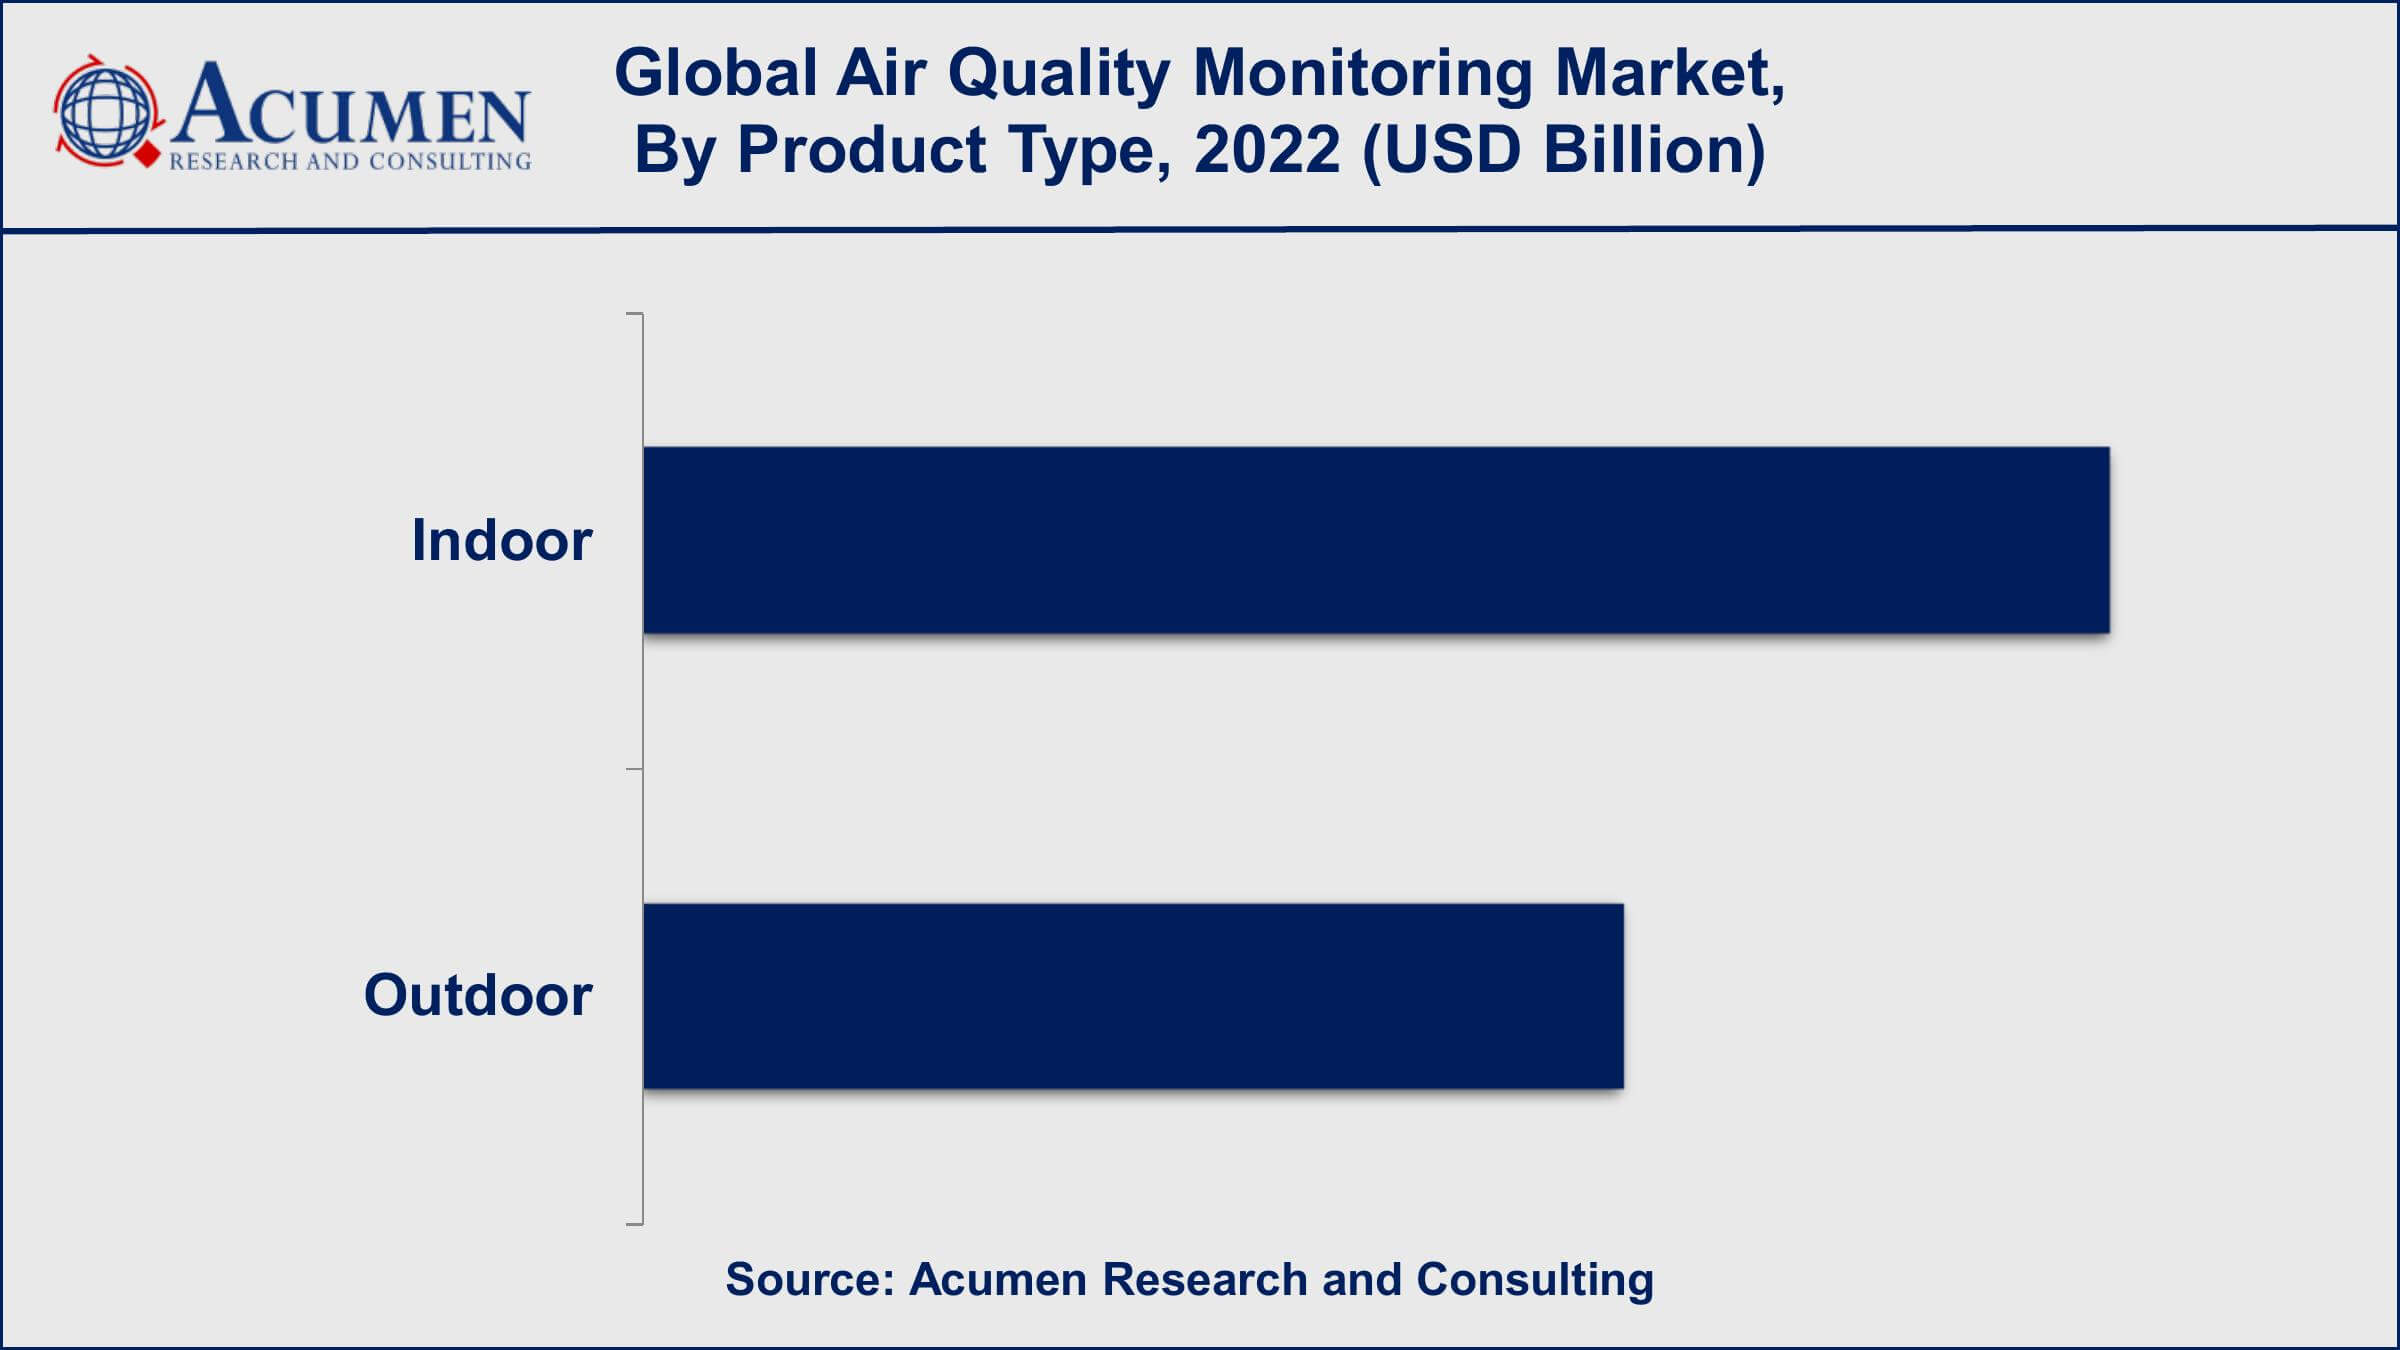
According to the air quality monitoring market forecast, outdoor air quality monitoring segment will dominate the air quality monitoring market in terms of market size and revenue. Products in the outdoor air quality monitoring segment are intended to monitor air quality in open spaces such as cities, industrial areas, and transportation hubs. To measure contaminants such as particulate matter, nitrogen dioxide, ozone, and sulphur dioxide, these products typically employ a variety of sensors. They can be stationary or mobile, and the information they collect is typically used to monitor air pollution levels and inform air pollution prevention measures. The greater levels of air pollution in outdoor environments, the requirement for regulatory compliance and monitoring of pollution hotspots, and the growing number of initiatives by governments and organizations to monitor and mitigate outdoor air pollution all contribute to the larger market size of the outdoor air quality monitoring segment.
Air Quality Monitoring Market By Pollutant Type
- Chemical
- Biological
- Physical
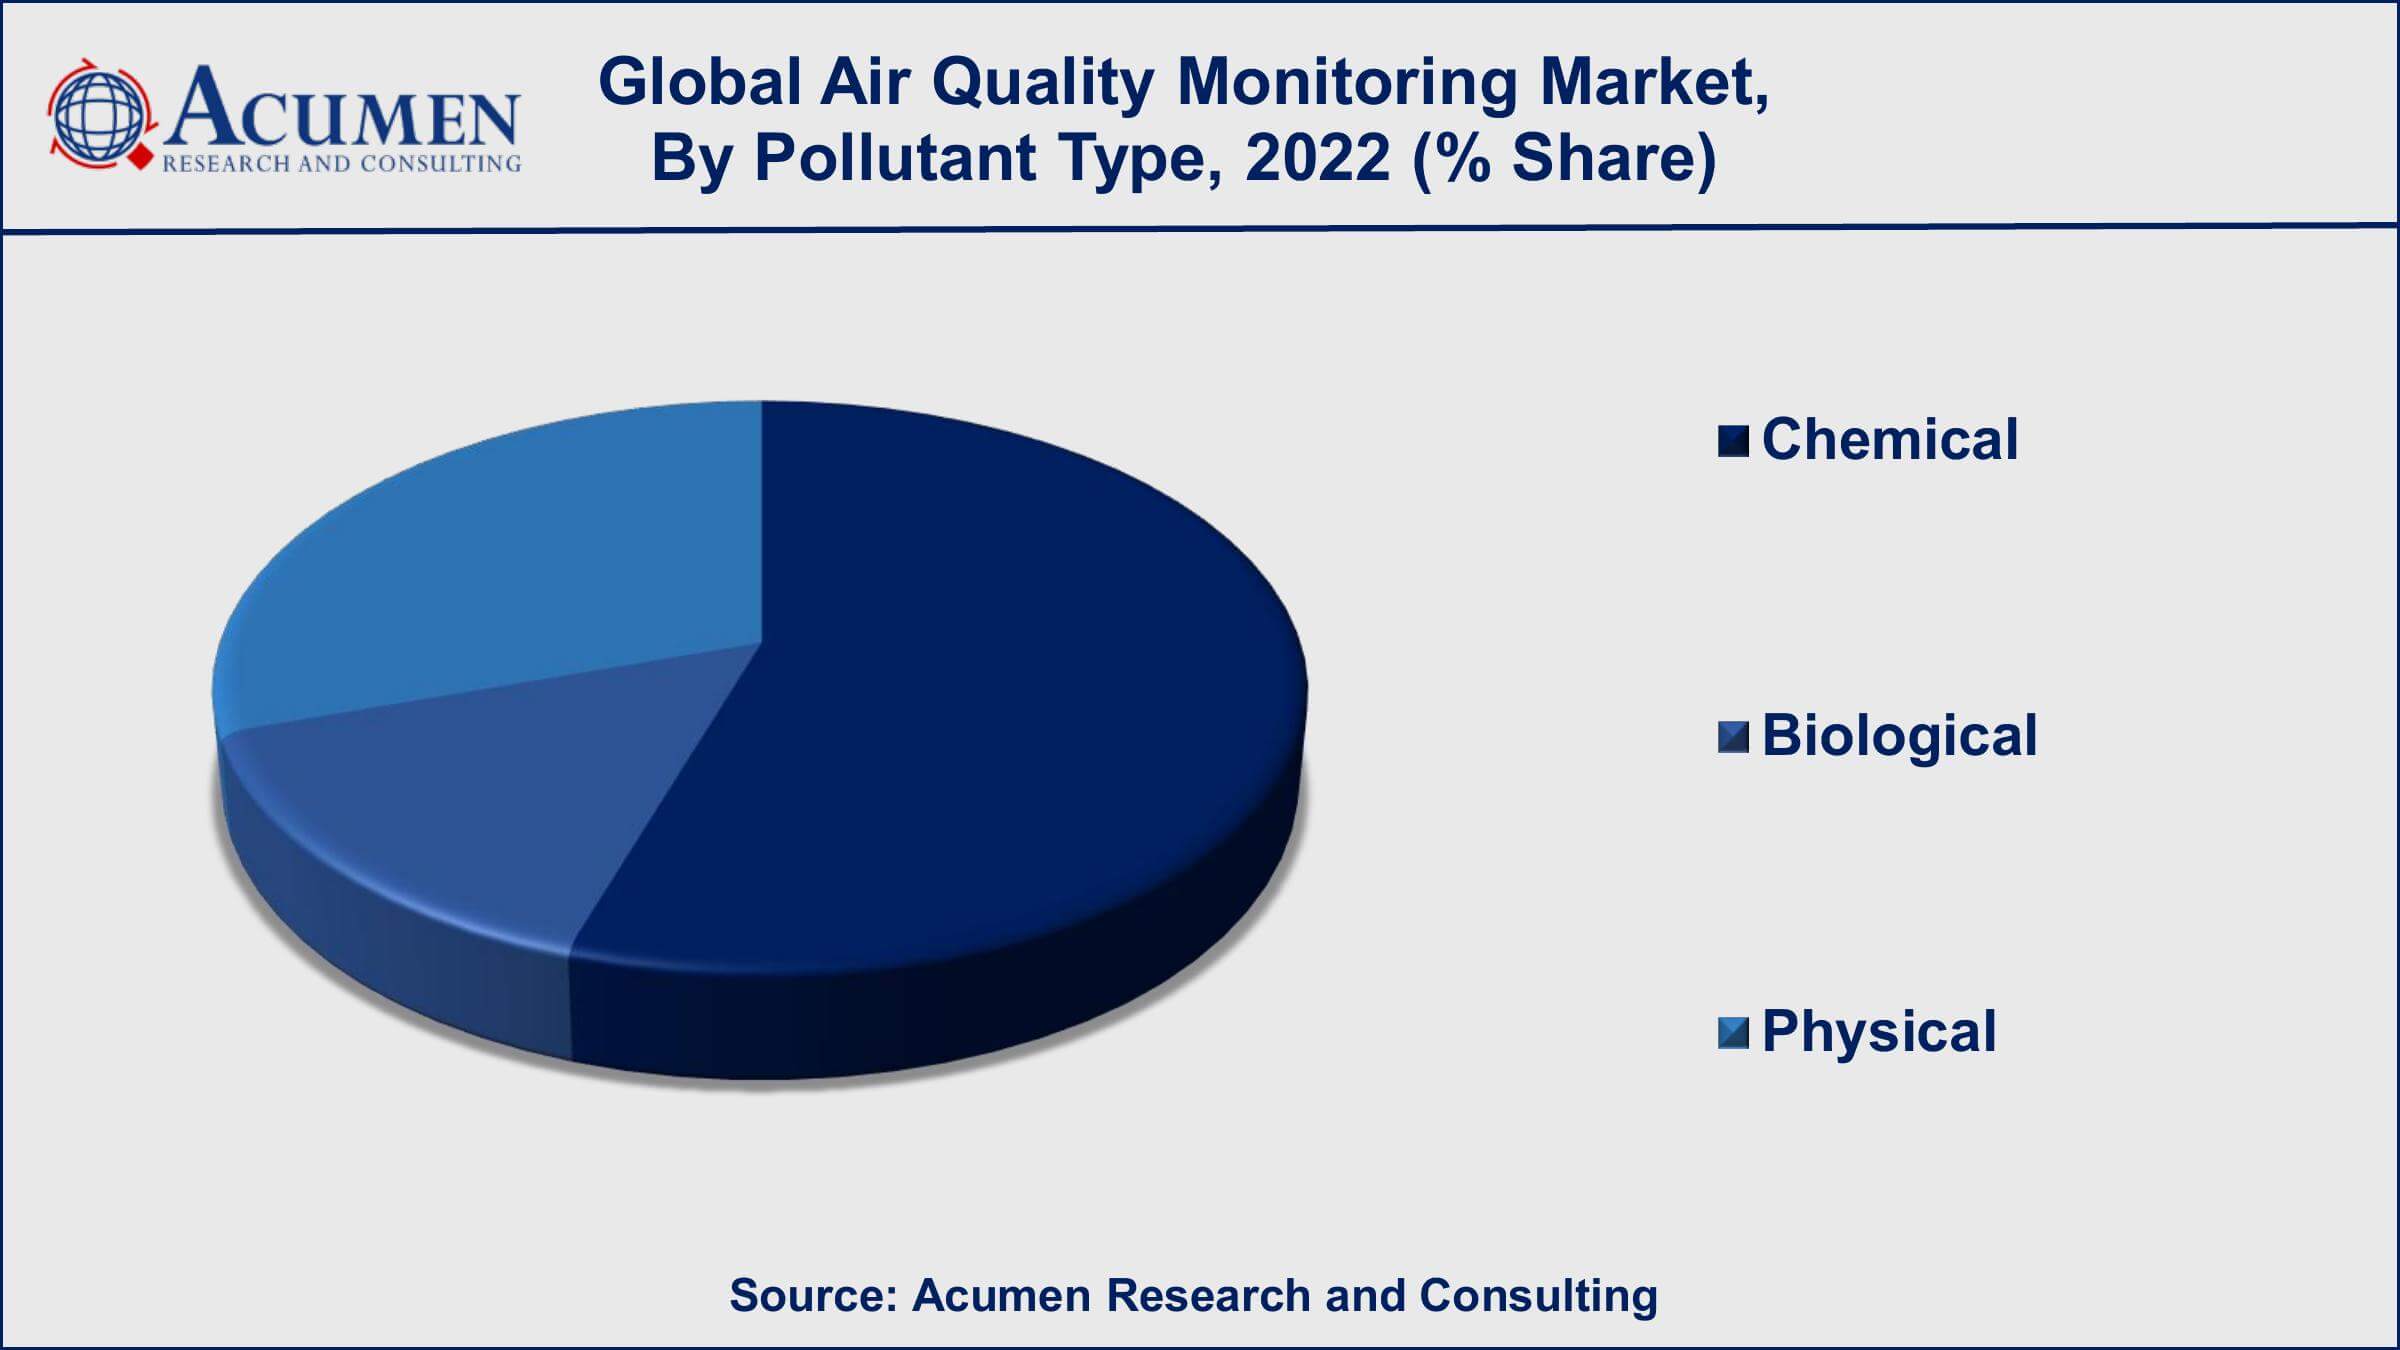
Some of the most commonly monitored pollutants are chemical pollutants such as nitrogen dioxide, sulphur dioxide, ozone, and volatile organic compounds (VOCs). These pollutants are frequently linked to human activity, such as transportation, industry, and energy production. Pollen, mould spores, and bacteria are also commonly monitored biological pollutants. These pollutants, which are frequently found in indoor environments, can cause respiratory problems and allergies. Physical pollutants like particulate matter and noise are also frequently monitored. Particulate matter, which can be caused by industrial processes, transportation, and other human activities, can cause respiratory problems, whereas noise pollution can cause hearing loss and other health problems.
Air Quality Monitoring Market By End-User Industry
- Government & Academics
- Oil & Gas
- Power Plants
- Commercial & Residential
- Others
According to an Industry analysis of air quality monitoring, the government and academics sector is currently the largest end-user of air quality monitoring systems and is expected to continue to dominate the market in the coming years. Air quality monitoring systems are used by the government and academic institutions to collect data on air pollution levels and to notify regulatory policies and public health initiatives. These organizations are frequently in charge of monitoring air quality in cities and industrial areas, making them a significant source of demand for air quality monitoring systems. Government and academic institutions have an increased need for accurate and trustworthy air quality data, which encourages the creation of more advanced and precise monitoring systems. While the government and academic sectors dominate the market for air quality monitoring, other industries are also important end users. For example, the oil and gas industry uses air quality monitoring systems to monitor emission levels from their facilities and ensure compliance with regulations. Air quality monitoring systems are also used in power plants and commercial and residential buildings to ensure healthy indoor environments and to meet regulatory requirements.
Air Quality Monitoring Market Regional Outlook
North America
- U.S.
- Canada
Europe
- U.K.
- Germany
- France
- Spain
- Rest of Europe
Asia-Pacific
- India
- Japan
- China
- Australia
- South Korea
- Rest of Asia-Pacific
Latin America
- Brazil
- Mexico
- Rest of Latin America
The Middle East & Africa
- South Africa
- GCC Countries
- Rest of the Middle East & Africa (ME&A)
Air Quality Monitoring Market Regional Analysis
Geographically, the market is bifurcated into North America, Europe, Asia-Pacific, Middle East and Africa and Latin America. Increasing industrialization in the major countries in Asia-Pacific such as India, China and Japan among others would ensure steady growth of this market throughout the forecast period. Rising number of vehicles would also ensure the growth of this market during the forecast period.
Air Quality Monitoring Market Players
Some of the key players in the global air quality monitoring market include 3M Co., Emerson Electric Co., General Electric Company, Horiba, Ltd., Merck KGaA, Servomex Group Ltd., Siemens A.G., Teledyne Technologies Inc., Testo AG, and Thermo Fisher Scientific, Inc.
Frequently Asked Questions
What was the market size of the global air quality monitoring in 2022?
The market size of air quality monitoring was USD 4.7 Billion in 2022.
What is the CAGR of the global air quality monitoring market during forecast period of 2023 to 2032?
The CAGR of air quality monitoring market is 6.4% during the analysis period of 2023 to 2032.
Which are the key players operating in the market?
The key players operating in the global market are 3M Co., Emerson Electric Co., General Electric Company, Horiba, Ltd., Merck KGaA, Servomex Group Ltd., Siemens A.G., Teledyne Technologies Inc., Testo AG, and Thermo Fisher Scientific, Inc.
Which region held the dominating position in the global air quality monitoring market?
North America held the dominating position in air quality monitoring market during the analysis period of 2023 to 2032.
Which region registered the fastest growing CAGR for the forecast period of 2023 to 2032?
Asia-Pacific region exhibited fastest growing CAGR for air quality monitoring market during the analysis period of 2023 to 2032.
What are the current trends and dynamics in the global air quality monitoring market?
The current trends and dynamics in the air quality monitoring industry include increasing awareness of air pollution, government regulations and initiatives, and rising industrialization and urbanization.
Which product type held the maximum share in 2022?
The outdoor product type held the maximum share of the air quality monitoring market.


