Agricultural Micronutrients Market Size - Global Industry, Share, Analysis, Trends and Forecast 2023 - 2032
Published :
Report ID:
Pages :
Format :
Agricultural Micronutrients Market Size - Global Industry, Share, Analysis, Trends and Forecast 2023 - 2032
Report Coverage
- Industry Dynamics
- Market Size and Forecast Data
- Segment Analysis
- Competitive Landscape
- Regional Analysis with a Niche Focus on Country-Level Data
- High Level Analysis - Porter's, PESTEL, Value Chain, etc.
- Company Profiles of Key Players
- Option to Customize the Report As Per Your Specific Need
Request Sample Report
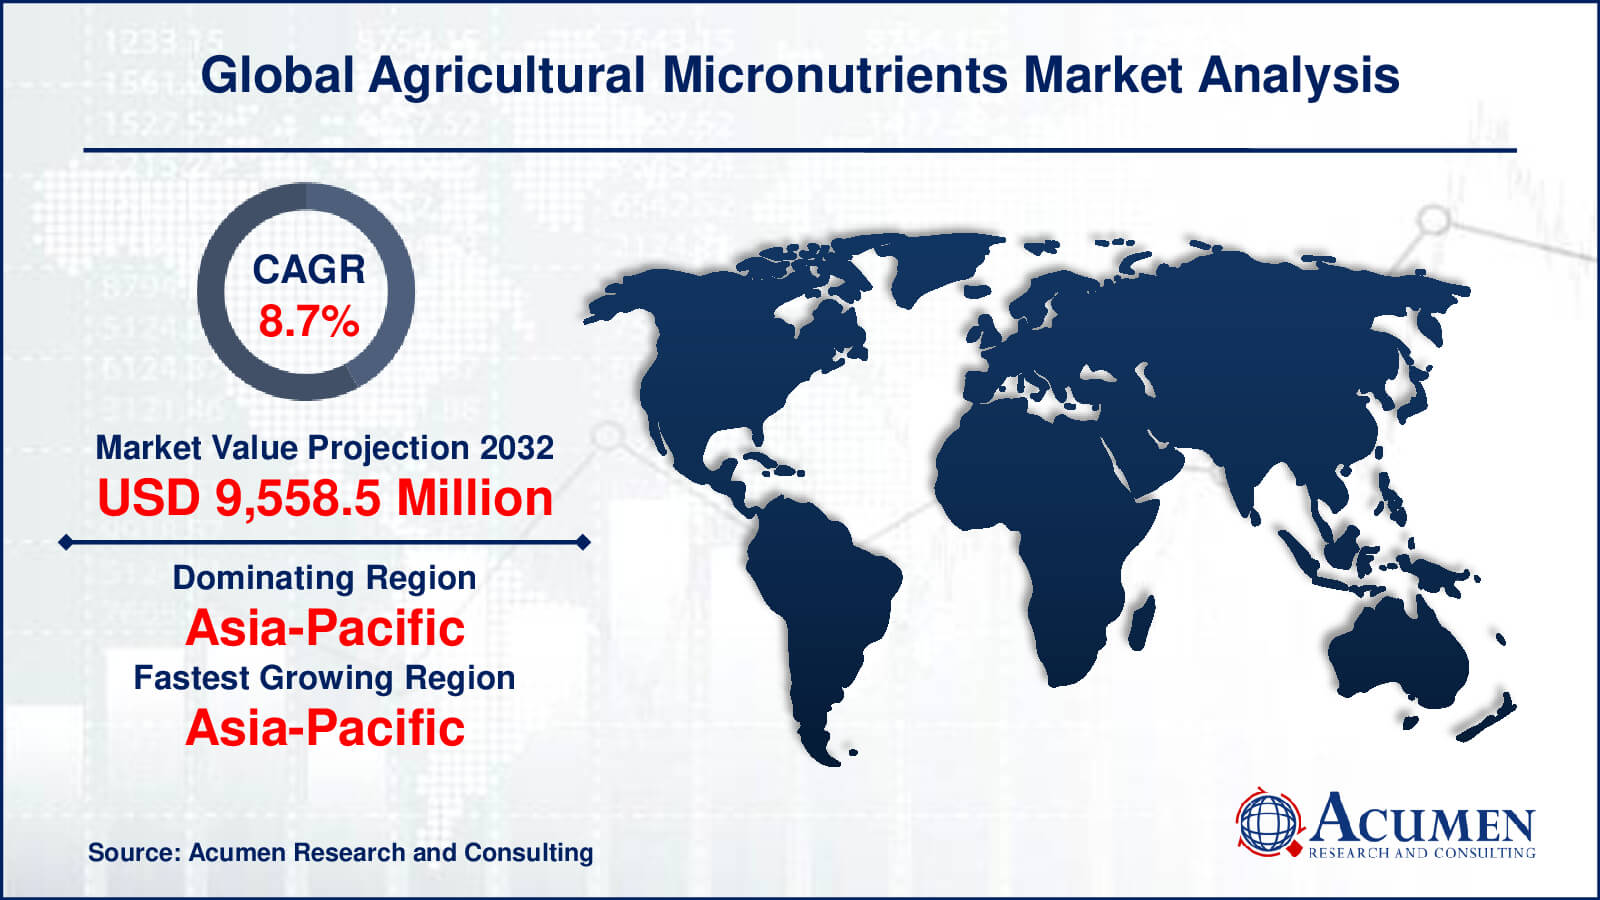
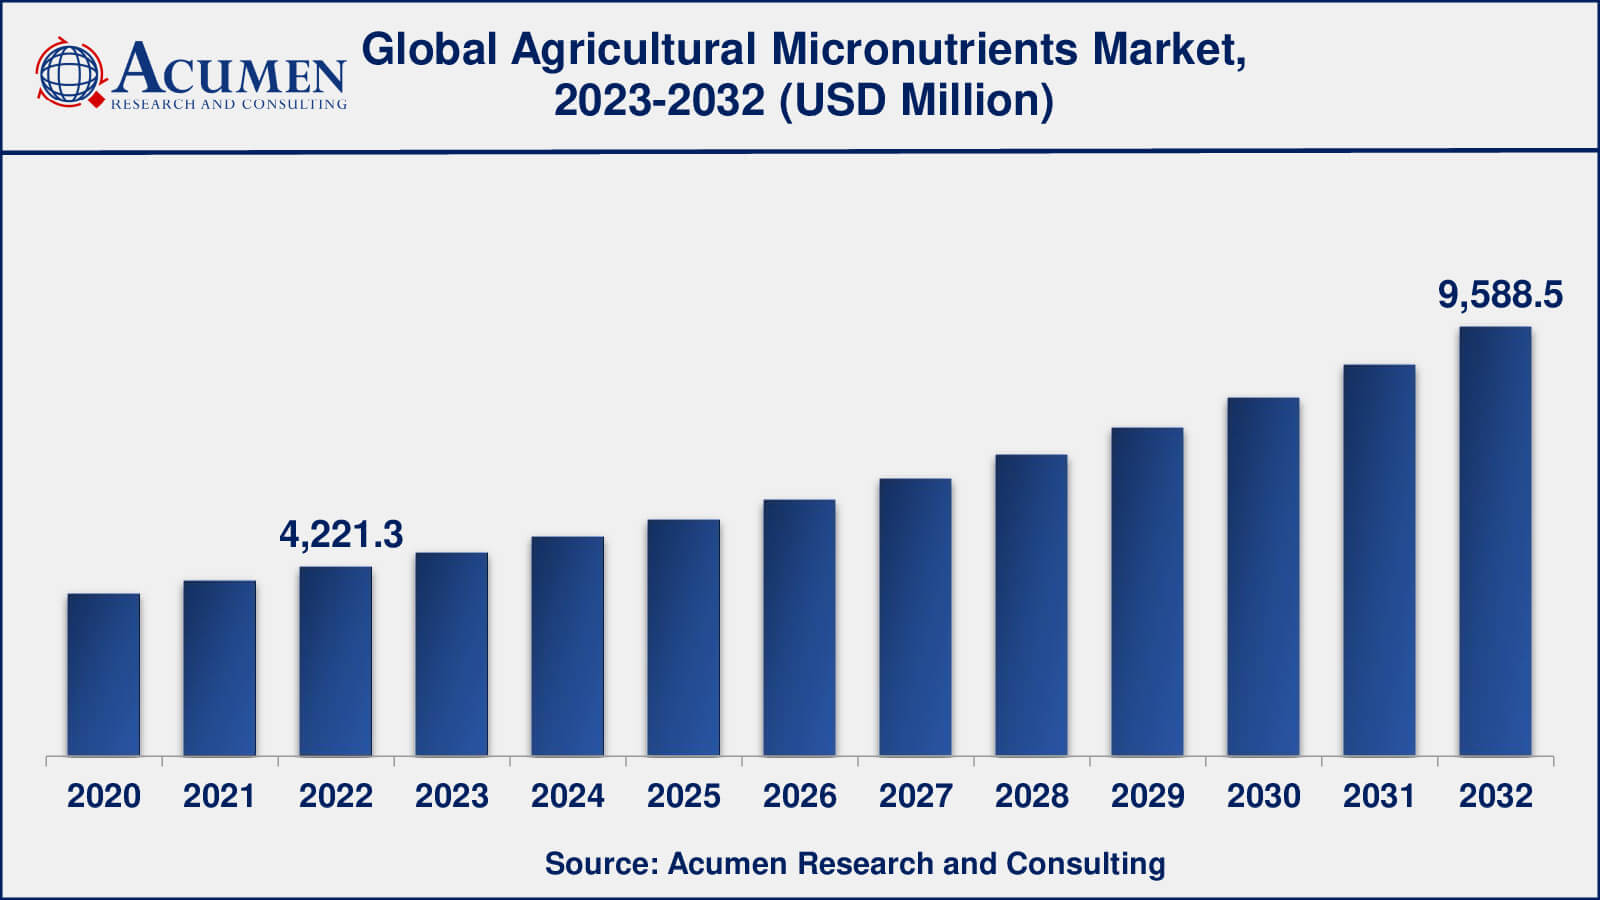
The Global Agricultural Micronutrients Market Size accounted for USD 4,221.3 Million in 2022 and is estimated to achieve a market size of USD 9,588.5 Million by 2032 growing at a CAGR of 8.7% from 2023 to 2032.
Agricultural Micronutrients Market Highlights
- Global agricultural micronutrients market revenue is poised to garner USD 9,588.5 million by 2032 with a CAGR of 8.7% from 2023 to 2032
- Asia-Pacific agricultural micronutrients market value occupied more than USD 1,857 million in 2022
- Asia-Pacific agricultural micronutrients market growth will record a CAGR of around 9% from 2023 to 2032
- Among type, the zinc sub-segment generated around US$ 1,260 million revenue in 2022
- Based on application, the soil sub-segment generated over 40% share in 2022
- Rising interest in biofortification is a popular agricultural micronutrients market trend that fuels the industry demand
Micronutrients refer to the essential elements that are used by plants to increase the yield and quality of agricultural products. According to some research enriching fertilizers with micronutrients had not only an impact on plant deficiencies but also on humans and animals, through the food chain. There are approx seven nutrients, which are essential to plant growth including boron, chlorine, copper, iron, manganese, molybdenum, and zinc. Soil micronutrient deficiencies can lead to lower crop yields, poor crop quality, and increased susceptibility to diseases and pests. As a result, using agricultural micronutrients is critical to ensuring optimal plant nutrition and increasing agricultural productivity. Agricultural micronutrients are typically applied to crops via a variety of methods such as soil application, foliar spray, and fertigation (application through irrigation systems). These micronutrients can be used in chelated and non-chelated forms, with chelated forms being more stable and bioavailable to plants.
Global Agricultural Micronutrients Market Dynamics
Market Drivers
- Increasing global population and the need for higher agricultural productivity to meet food demand
- Growing awareness about the importance of balanced plant nutrition for improved crop yield and quality
- Rising focus on precision agriculture and digital farming technologies
Market Restraints
- Lack of awareness and knowledge
- Limited access to micronutrient products and their high cost
- Environmental concerns related to micronutrient overuse or misuse
Market Opportunities
- Increasing demand for sustainable agriculture practices
- Advancements in nanotechnology and biotechnology
- Growing trend towards organic and natural farming
Agricultural Micronutrients Market Report Coverage
| Market | Agricultural Micronutrients Market |
| Agricultural Micronutrients Market Size 2022 | USD 4,221.3 Million |
| Agricultural Micronutrients Market Forecast 2032 | USD 9,588.5 Million |
| Agricultural Micronutrients Market CAGR During 2023 - 2032 | 8.7% |
| Agricultural Micronutrients Market Analysis Period | 2020 - 2032 |
| Agricultural Micronutrients Market Base Year | 2022 |
| Agricultural Micronutrients Market Forecast Data | 2023 - 2032 |
| Segments Covered | By Type, By Form, By Application, By End-Use, And By Geography |
| Regional Scope | North America, Europe, Asia Pacific, Latin America, and Middle East & Africa |
| Key Companies Profiled | AkzoNobel, ATP Nutrition, Baicor LC, Balchem, BASF SE, BMS Micronutrient NV, Compass minerals international, Coromandel International Ltd., Corteva Inc, Haifa Group, Helena Chemical Company, Nufarm, Nutrien, Ltd., Sapec SA, Stoller Enterprises Inc., The Mosaic Company, Valagro, Yara International ASA, and Zuari Agrochemicals Ltd. |
| Report Coverage |
Market Trends, Drivers, Restraints, Competitive Analysis, Player Profiling, Covid-19 Analysis, Regulation Analysis |
Agricultural Micronutrients Market Insights
The increasing micronutrient deficiency in the soil, owing to the increasing use of chemical fertilizers and unfavorable climatic conditions is driving the market value. The rising focus on crop production and quality coupled with the advancement in fertilizer technology is additionally supporting the market value. Supporting policies from the government to deal with the rising micronutrient deficiency in soil is further accelerating the market value. Furthermore, the development of biodegradable chelates and increasing health issues, along with shifting consumer preference toward a nutrient-rich diet are projected to create potential opportunities over the forecast period.
Agricultural Micronutrients Market Segmentation
The worldwide market for agricultural micronutrients is split based on type, form, application, end-user, and geography.
Agricultural Micronutrient Types
- Zinc
- Boron
- Iron
- Molybdenum
- Manganese
- Other
Zinc has historically been one of the micronutrients that generated the most revenue in the agricultural micronutrients market, according to agricultural micronutrients industry analysis. Zinc is an essential micronutrient for plant growth and development, as it is involved in enzyme activities, photosynthesis, and crop productivity overall. Zinc deficiency is common in soils around the world, resulting in lower crop yields and quality. As a result, agricultural applications have consistently seen high demand for zinc micronutrient products such as zinc fertilisers and zinc chelates.
Boron is yet another important micronutrient that has made significant contributions to the agricultural micronutrients market. Boron is required for cell division, carbohydrate metabolism, and protein and nucleic acid synthesis in plants. Iron, molybdenum, and manganese are also important micronutrients for plant growth and contribute significantly to the agricultural micronutrients market. In plants, iron is required for chlorophyll synthesis and energy transfer, whereas molybdenum is required for nitrogen fixation and enzyme functions. Other micronutrients, such as copper, cobalt, and nickel, play important roles in plant nutrition as well. They may, however, contribute less to overall revenue in the agricultural micronutrients market than zinc, boron, iron, molybdenum, and manganese.
Agricultural Micronutrient Forms
- Chelated
- Non-Chelated
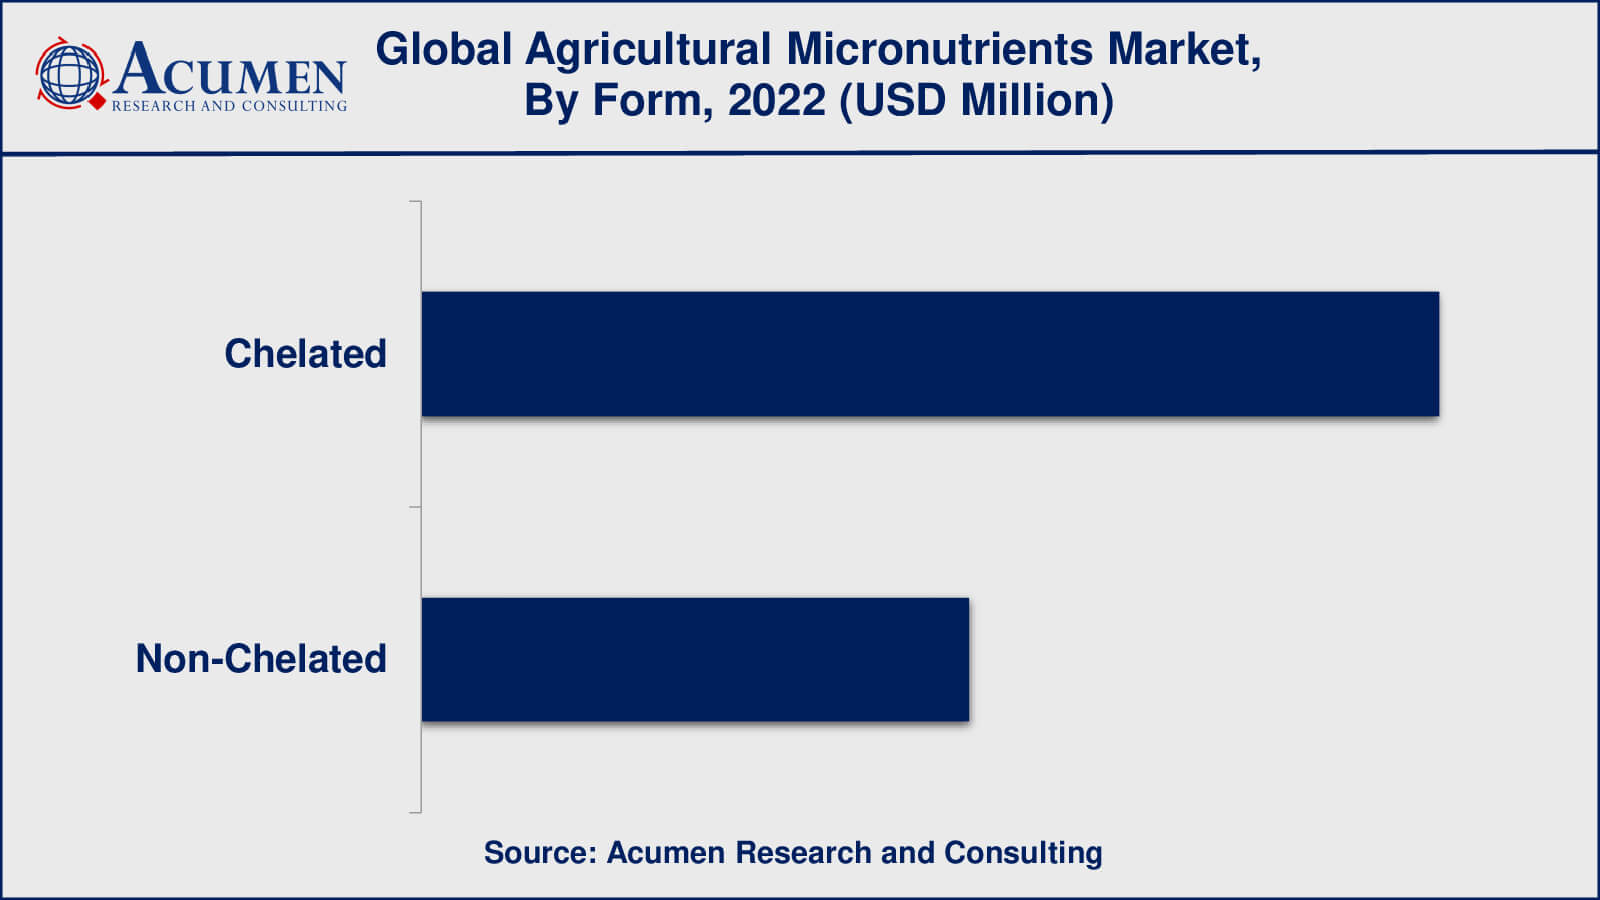
Chelated micronutrients are generally known to generate more revenue in the agricultural micronutrients market than non-chelated micronutrients. Chelation is the process of combining micronutrients with organic molecules known as chelating agents to form stable and soluble complexes that plants can absorb. Chelated micronutrients have several advantages over non-chelated micronutrients, including increased nutrient availability, improved uptake efficiency, and decreased nutrient interactions and antagonisms in soil.
Chelated micronutrients enable precise nutrient management and targeted application, which is especially useful in modern agricultural practises such as precision farming and hydroponics. Chelated micronutrients are also useful in overcoming soil pH and other soil-related limitations that may affect plant nutrient availability. As a result, chelated micronutrients are widely used to address nutrient deficiencies and improve crop yields and quality in a variety of crops, including cereals, fruits, vegetables, and cash crops.
Agricultural Micronutrient Applications
- Soil
- Foliar
- Fertigation
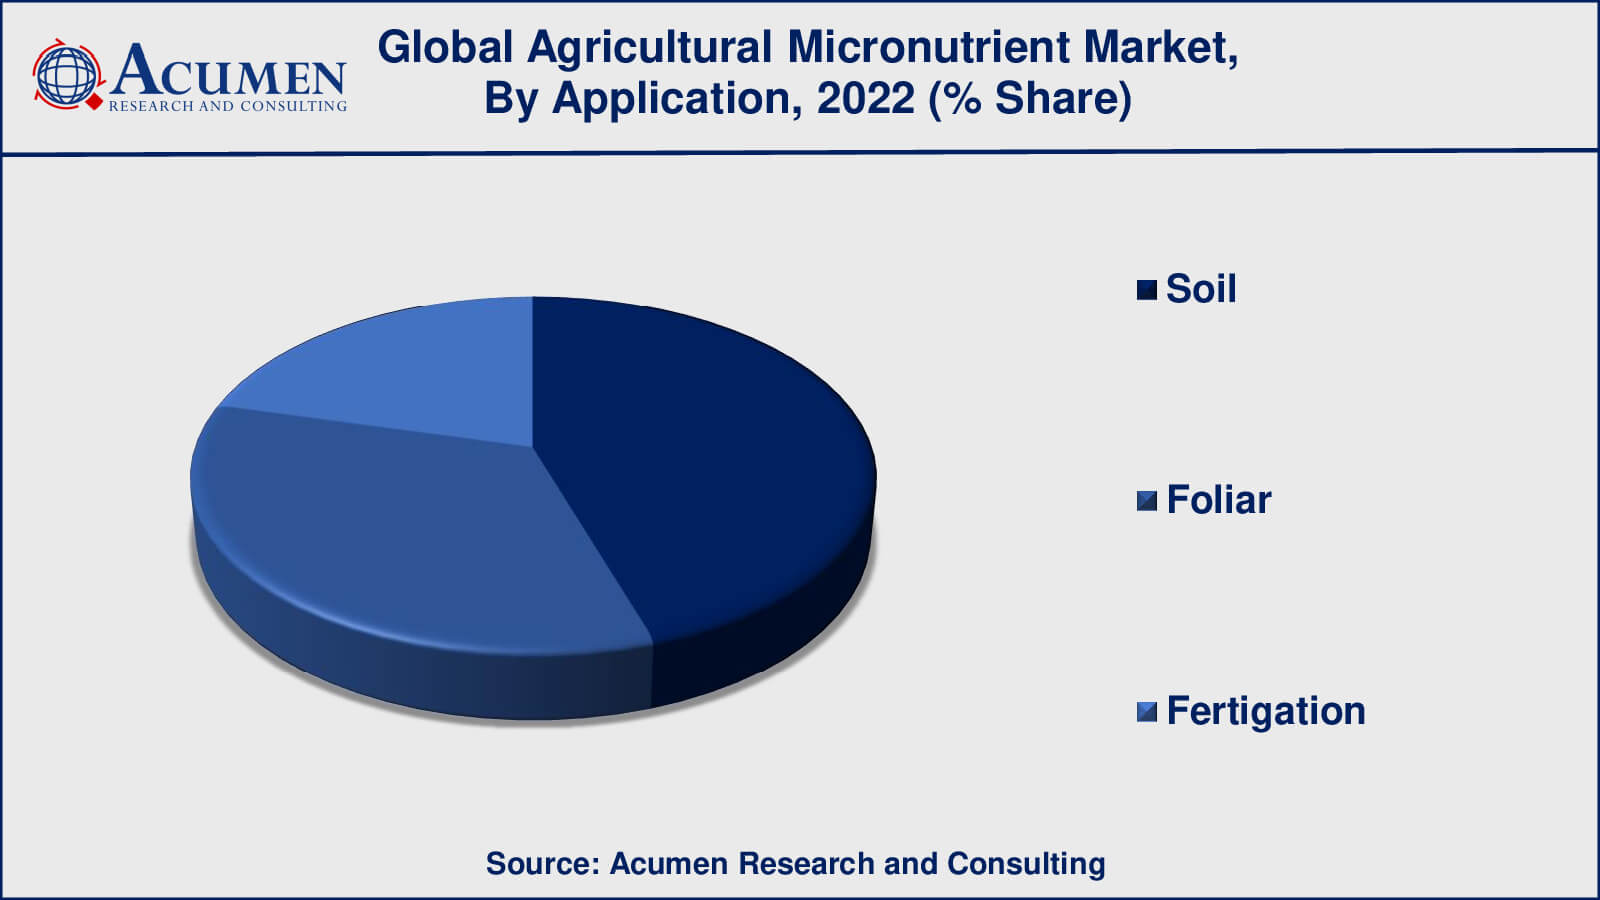
As per the agricultural micronutrients market forecast, soil application is expected to dominate the utmost shares from 2023 to 2032. Micronutrient soil application is especially common in traditional agricultural practises, where soil nutrient availability is managed to support plant growth and development. Micronutrient deficiencies in soil can occur as a result of a variety of factors, including low soil fertility, high pH, excessive nutrient leaching, and soil erosion. As a result, micronutrient applications to soil are frequently used to replenish or supplement these essential nutrients and optimise crop nutrition for increased yields and quality.
Agricultural Micronutrient End-Users
- Non-Agricultural Cereals & Grains
- Fruits & Vegetables
- Oilseeds & Pulses
- Others
Fruits and vegetables have traditionally accounted for a sizable portion of the agricultural micronutrients market. Fruits and vegetables are high-value crops that require precise nutrient management to achieve optimal yields and quality, and micronutrient deficiencies can have serious consequences for their growth and development. Micronutrients are important in a variety of physiological processes in fruits and vegetables, such as photosynthesis, enzyme activation, and nutrient transport.
Non-agricultural cereals and grains, which include crops such as maize, wheat, rice, and other non-food grains, have also been significant end-users in the agricultural micronutrients market. These crops are widely grown for industrial and feed purposes, and proper nutrient management is required for optimal growth and yield. Micronutrient deficiencies can reduce crop productivity and quality, increasing demand for micronutrient products to address these deficiencies.
Agricultural Micronutrients Market Regional Outlook
North America
- U.S.
- Canada
Europe
- U.K.
- Germany
- France
- Spain
- Rest of Europe
Asia-Pacific
- India
- Japan
- China
- Australia
- South Korea
- Rest of Asia-Pacific
Latin America
- Brazil
- Mexico
- Rest of Latin America
The Middle East & Africa
- South Africa
- GCC Countries
- Rest of the Middle East & Africa (ME&A)
Agricultural Micronutrients Market Regional Analysis
Asia-Pacific is a rapidly growing market for agricultural micronutrients, with major consumers including China, India, and Japan. In Asia-Pacific, increasing population, changing dietary preferences, and the need for higher crop productivity are driving demand for agricultural micronutrients. Micronutrient application in crops such as rice, wheat, and vegetables is gaining popularity in countries such as China and India. Adoption of modern agricultural practices such as protected cultivation, precision farming, and fertigation is also fueling the growth of the Asia-Pacific agricultural micronutrients market.
North America is an important market for agricultural micronutrients, with the United States dominating the region. The adoption of advanced agricultural practises, high-value crop production, and growing awareness about nutrient management for sustainable agriculture are driving demand for agricultural micronutrients in North America. Micronutrient products are widely used in row crops such as corn, soybeans, and wheat in North America. Furthermore, the region is seeing an increase in precision agriculture, including the use of micronutrient formulations for fertigation and foliar application.
Agricultural Micronutrients Market Players
Some of the top agricultural micronutrients companies offered in the professional report include AkzoNobel, ATP Nutrition, Baicor LC, Balchem, BASF SE, BMS Micronutrient NV, Compass minerals international, Coromandel International Ltd., Corteva Inc, Haifa Group, Helena Chemical Company, Nufarm, Nutrien, Ltd., Sapec SA, Stoller Enterprises Inc., The Mosaic Company, Valagro, Yara International ASA, and Zuari Agrochemicals Ltd.
Frequently Asked Questions
What was the market size of the global agricultural micronutrients in 2022?
The market size of agricultural micronutrients was USD 4,221.3 million in 2022.
What is the CAGR of the global agricultural micronutrients from 2023 to 2032?
The CAGR of agricultural micronutrients is 8.7% during the analysis period of 2023 to 2032.
Which are the key players in the agricultural micronutrients market?
The key players operating in the global agricultural micronutrients market is includes AkzoNobel, ATP Nutrition, Baicor LC, Balchem, BASF SE, BMS Micronutrient NV, Compass minerals international, Coromandel International Ltd., Corteva Inc, Haifa Group, Helena Chemical Company, Nufarm, Nutrien, Ltd., Sapec SA, Stoller Enterprises Inc., The Mosaic Company, Valagro, Yara International ASA, and Zuari Agrochemicals Ltd.
Which region dominated the global agricultural micronutrients market share?
Asia-Pacific held the dominating position in agricultural micronutrients industry during the analysis period of 2023 to 2032.
Which region registered fastest CAGR from 2023 to 2032?
Asia-Pacific region exhibited fastest growing CAGR for market of agricultural micronutrients during the analysis period of 2023 to 2032.
What are the current trends and dynamics in the global agricultural micronutrients industry?
The current trends and dynamics in the agricultural micronutrients industry include increasing demand for sustainable agriculture practices, advancements in nanotechnology and biotechnology, and growing trend towards organic and natural farming.
Which type held the maximum share in 2022?
The zinc held the maximum share of the agricultural micronutrients industry.?


