3D Scanning Market Size - Global Industry, Share, Analysis, Trends and Forecast 2023 - 2032
Published :
Report ID:
Pages :
Format :
3D Scanning Market Size - Global Industry, Share, Analysis, Trends and Forecast 2023 - 2032
Report Coverage
- Industry Dynamics
- Market Size and Forecast Data
- Segment Analysis
- Competitive Landscape
- Regional Analysis with a Niche Focus on Country-Level Data
- High Level Analysis - Porter's, PESTEL, Value Chain, etc.
- Company Profiles of Key Players
- Option to Customize the Report As Per Your Specific Need
Request Sample Report
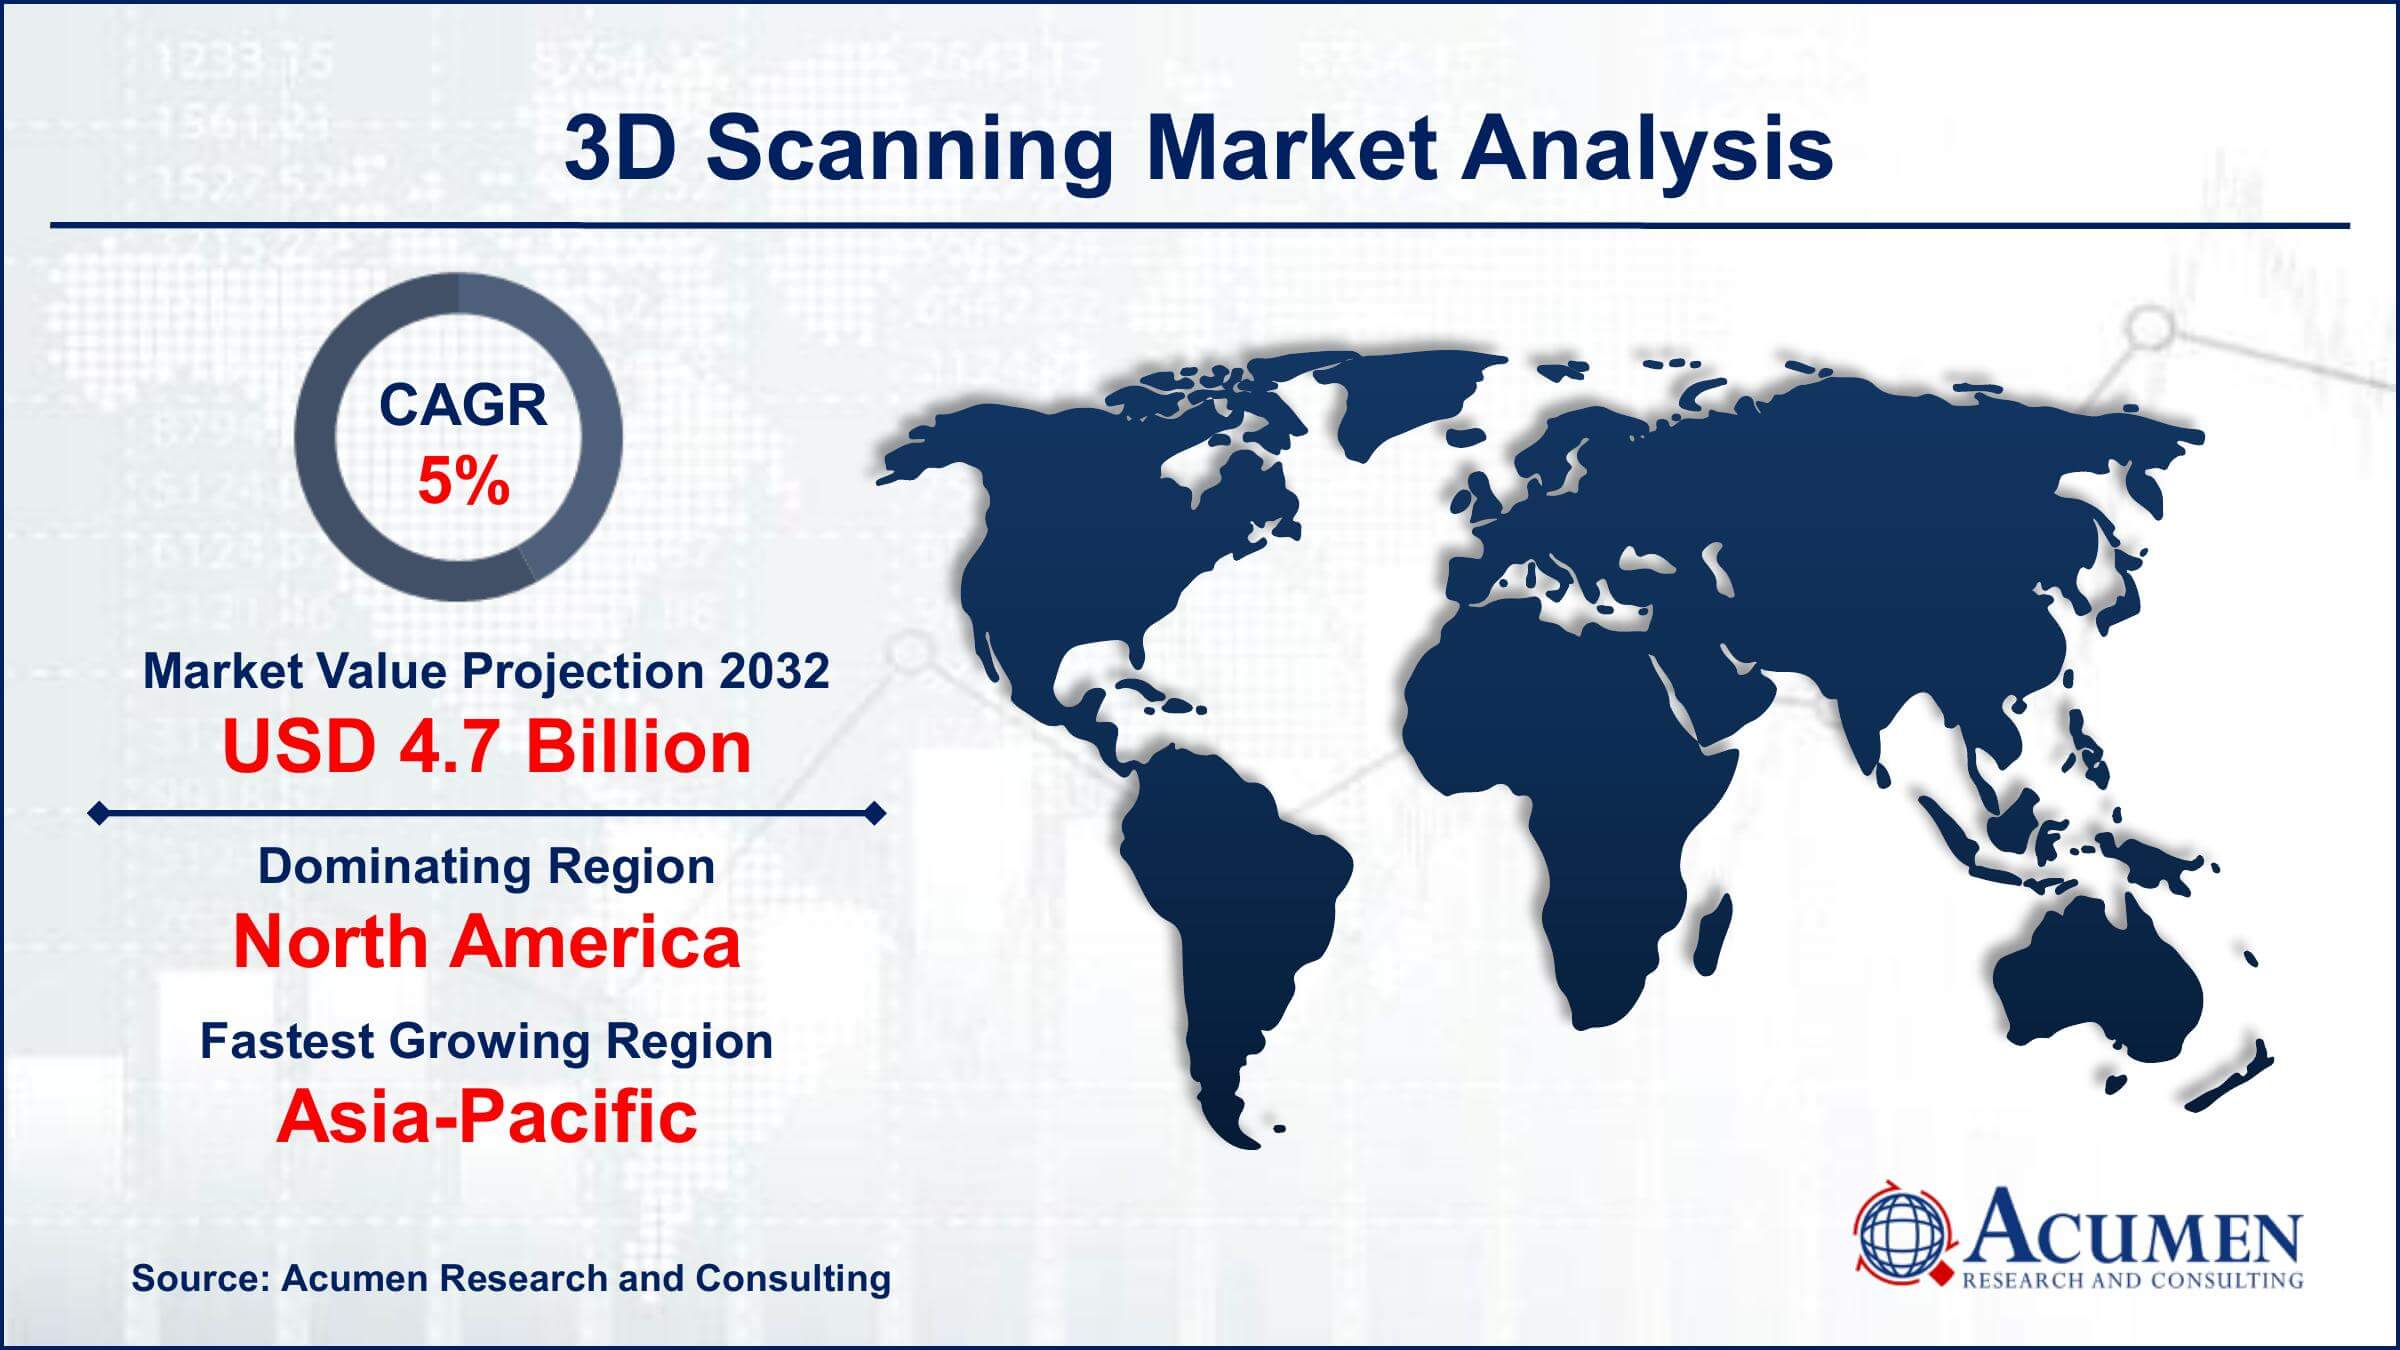
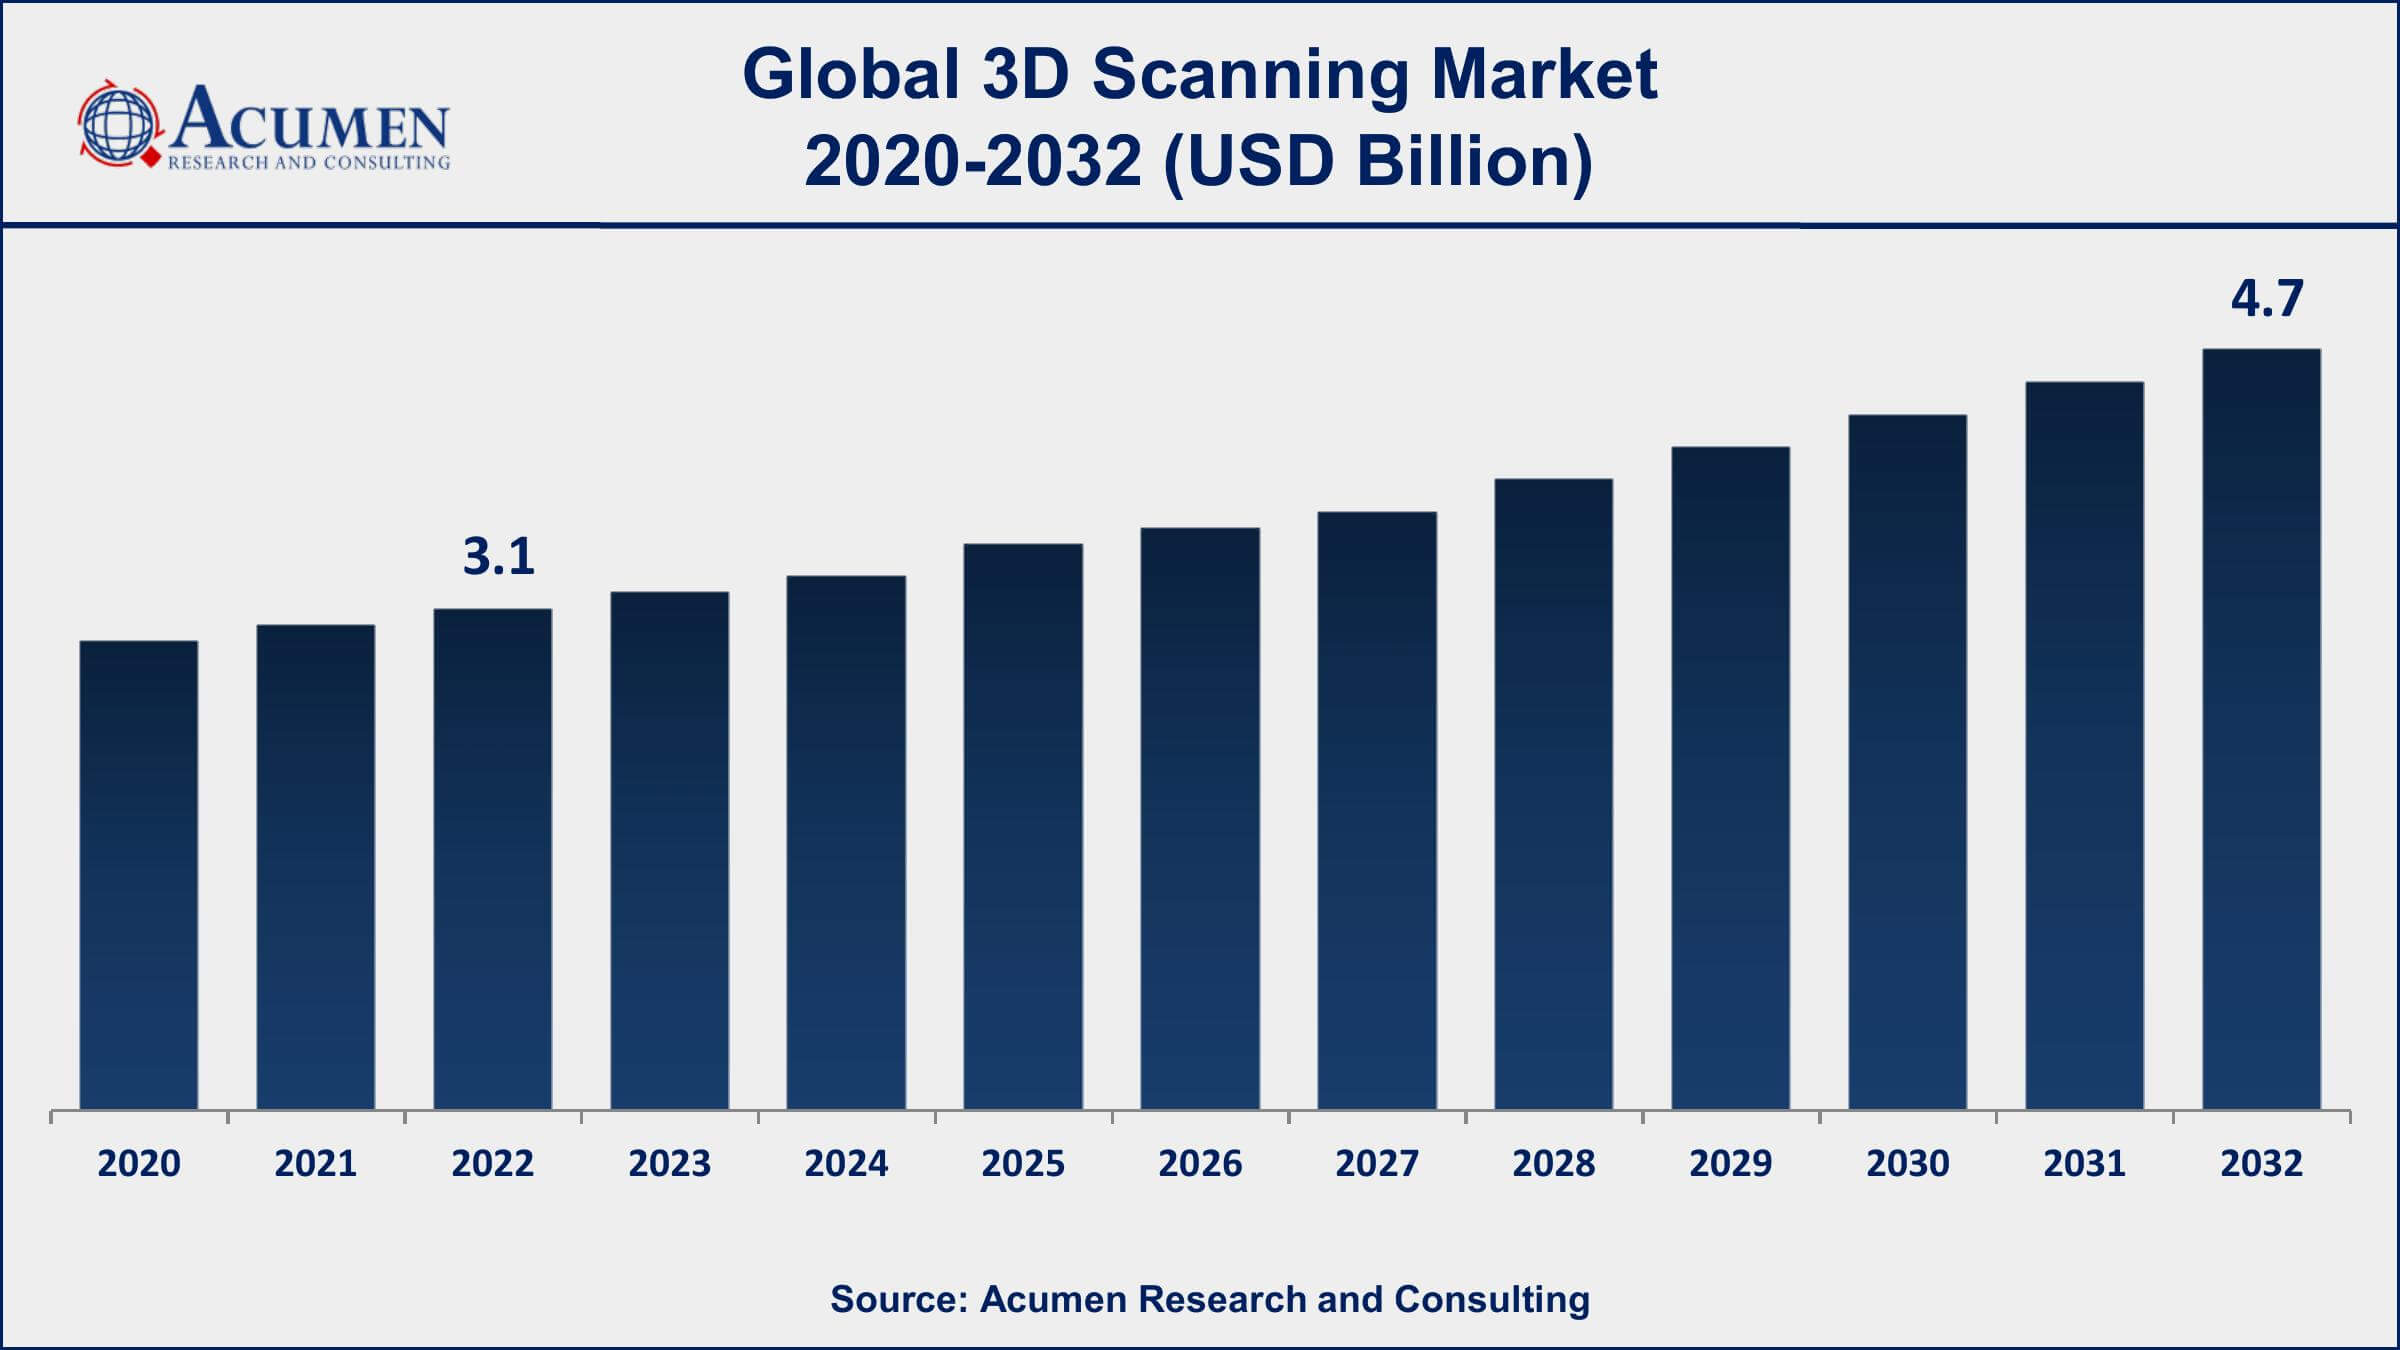
The global 3D Scanning Market size was valued at USD 3.1 Billion in 2022 and is projected to achieve a market size of USD 4.7 Billion by 2032 growing at a CAGR of 5% from 2023 to 2032.
3D Scanning Market Report Key Highlights
- Global 3D scanning market revenue is expected to increase by USD 4.7 Billion by 2032, with a 5% CAGR from 2023 to 2032
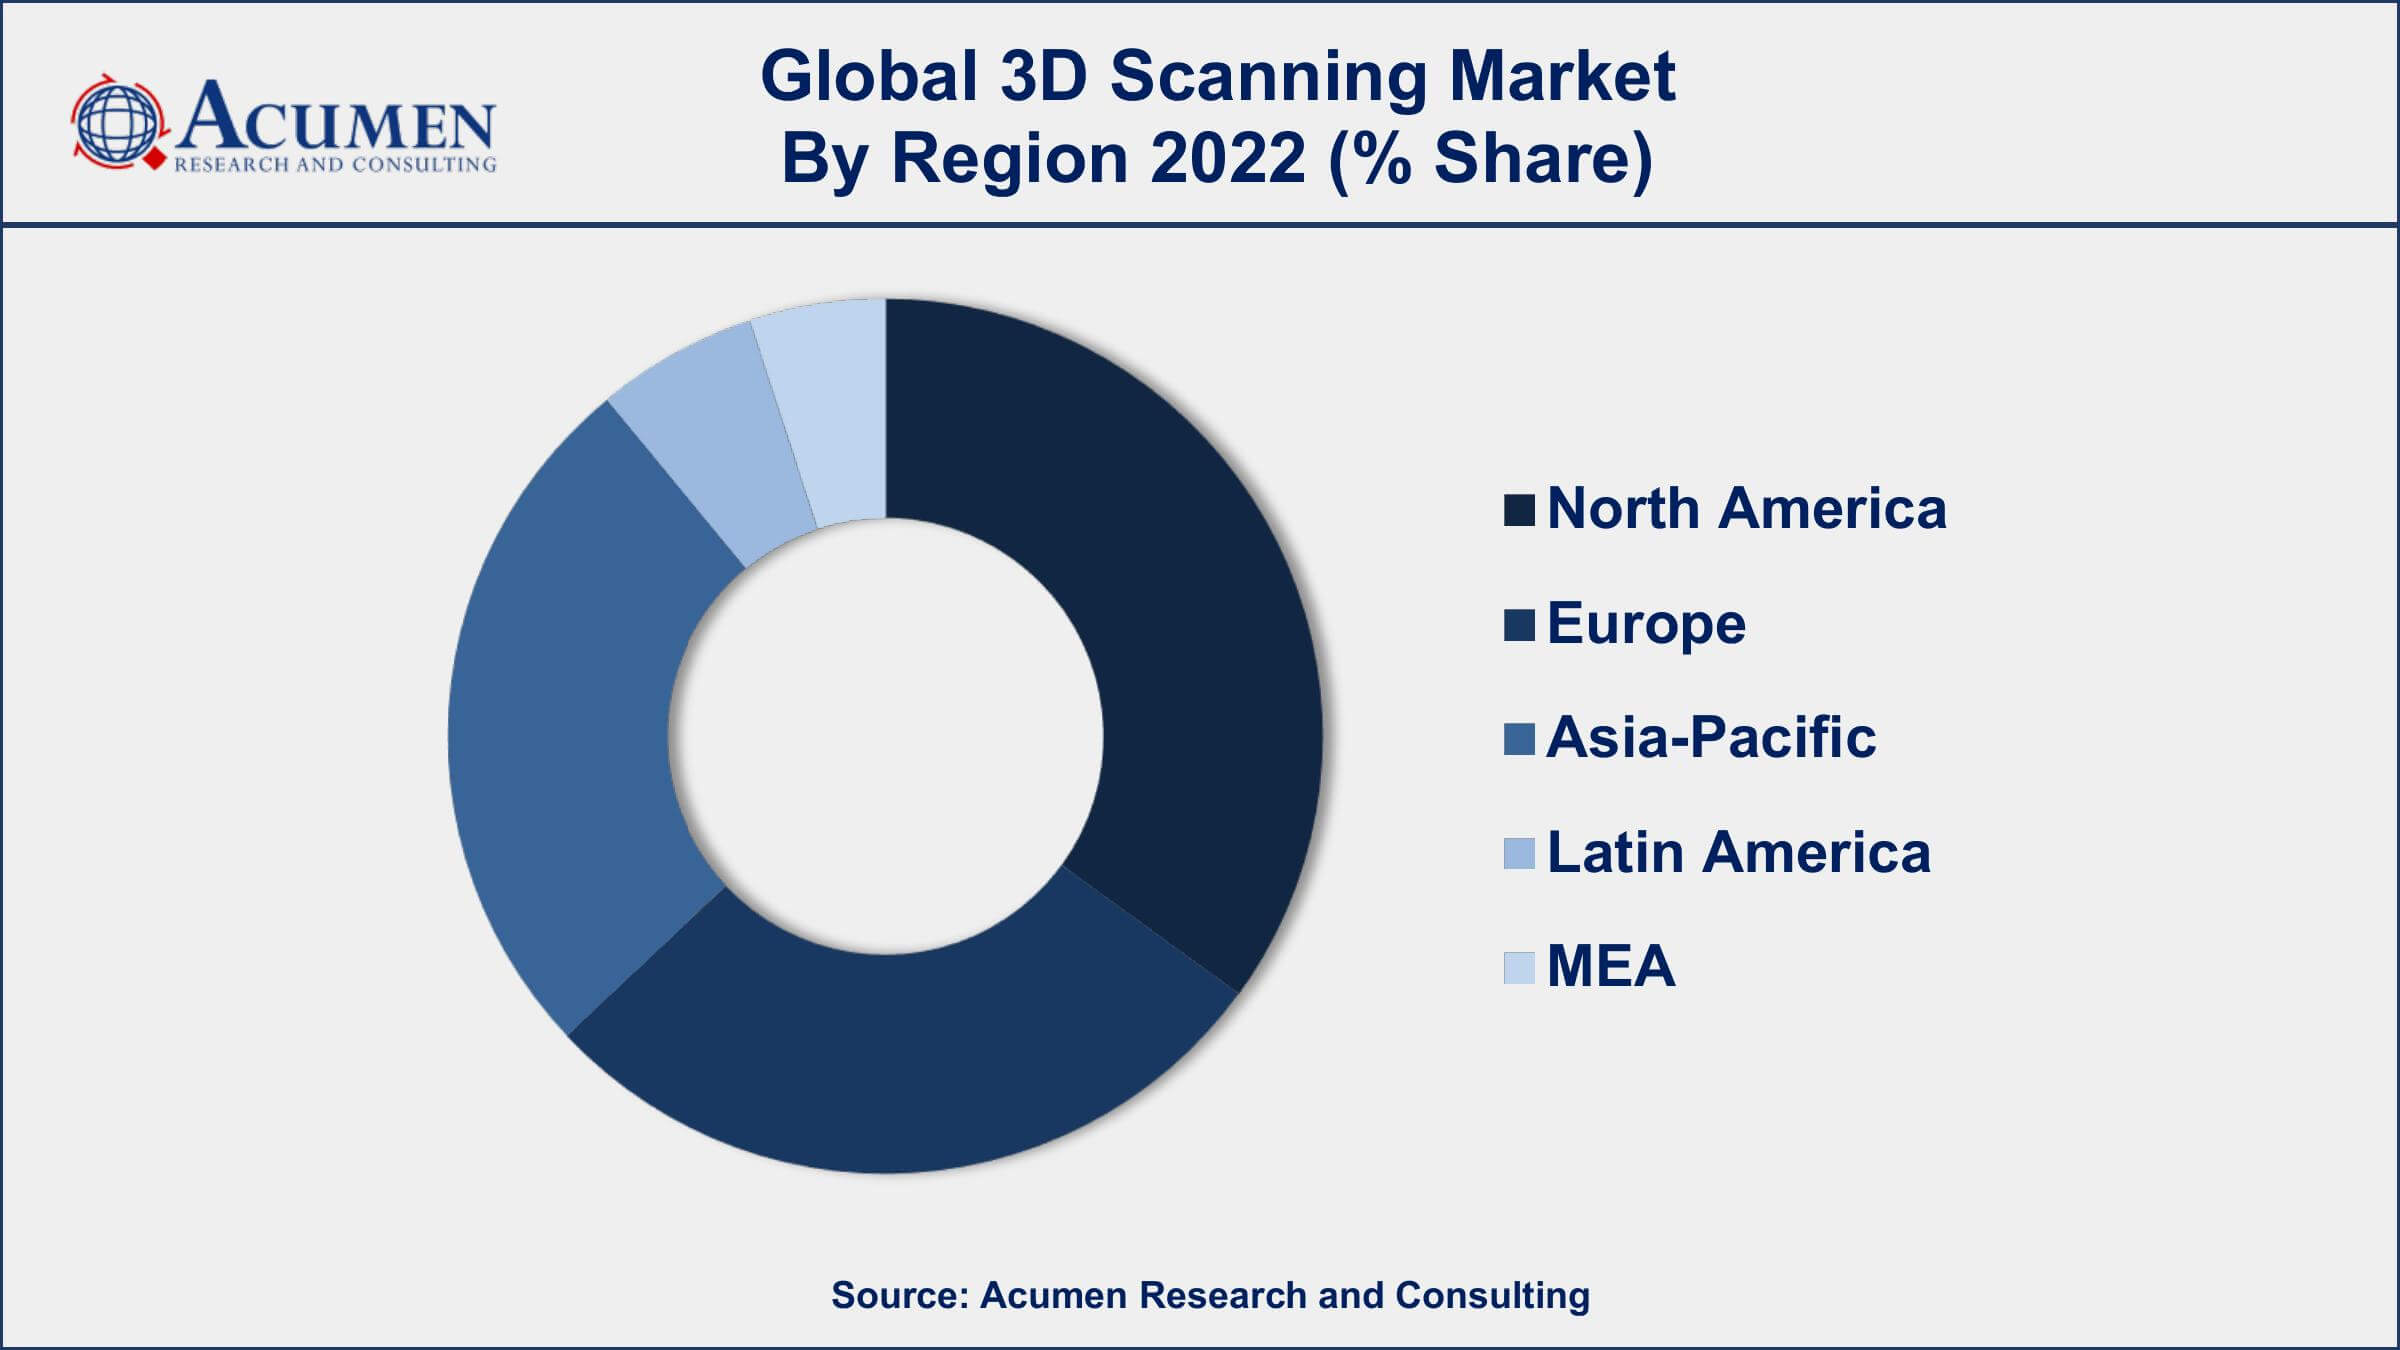
- North America region led with more than 36% of 3D scanners market share in 2022
- Among end-users, the industrial sub-segment generated around 25% share in 2022
- The healthcare industry is one of the fastest-growing segments for 3D scanning, with a projected CAGR of 7.9% from 2023 to 2032
- Medical and dental 3D scanning is rapidly growing, with applications such as creating custom prosthetics, implants, and surgical planning
- Some of the major players in the market include Autodesk, FARO Technologies, Creaform, and Hexagon
- Growing demand in the automotive and construction industries, drives the 3D scanners market size

3D scanners are devices used to measure tangible things with light, X-ray, or laser and generate polygon meshes or dense point clouds. These scanners are also called 3D digitizers, laser scanners, industrial CT, white light scanners, LiDAR, and others. Various methods are used for 3D scanning based on varied principles of imaging. Perfection of technologies differs with the type of scanning that includes short-range, mid-range, or long-range scanning. 3D scanning technology can be utilized across varied stages of manufacturing as it helps in saving time, money, and material. Several 3D technologies are used to manufacture 3D scanning devices and each of these technologies has its limitations, costs, and advantages.
The 3D scanners market has been witnessing significant growth over the past few years, driven by the increasing demand for 3D scanning technology in various industries such as automotive, aerospace, healthcare, and construction. 3D scanning technology enables the creation of highly detailed and accurate 3D models of objects, which can be used for design, prototyping, and quality control purposes. The market is also benefiting from the development of advanced 3D scannings technologies such as structured light scanning, laser triangulation, and photogrammetry. Additionally, the adoption of cloud-based 3D scanning solutions is expected to further drive the growth of the market in the coming years, as it allows for easier and more accessible data management and sharing. Overall, the 3D scanner market is expected to continue to grow at a steady pace, with increasing demand for 3D scanning technology in various applications.

Global 3D Scanning Market Trends
Market Drivers
- Increasing adoption of 3D printing technology
- Rising demand for high-quality 3D models in industries such as healthcare and aerospace
- Technological advancements in 3D scanning technology
- Growing demand for 3D scanning technology in the automotive and construction industries
Market Restraints
- High cost of 3D scanning equipment
- Limitations in scanning complex geometries
- Lack of skilled professionals in the 3D scanning field
Market Opportunities
- Growing demand for 3D scanning technology in the entertainment and gaming industries
- Rising adoption of mobile and cloud-based 3D scanning solutions
3D Scanning Market Report Coverage
| Market | 3D Scanning Market |
| 3D Scanning Market Size 2022 | USD 3.1 Billion |
| 3D Scanning Market Forecast 2032 | USD 4.7 Billion |
| 3D Scanning Market CAGR During 2023 - 2032 | 5% |
| 3D Scanning Market Analysis Period | 2020 - 2032 |
| Base Year | 2022 |
| Forecast Data | 2023 - 2032 |
| Segments Covered | By Component, By Product, By Range, By End-use, And By Geography |
| Regional Scope | North America, Europe, Asia Pacific, Latin America, and Middle East & Africa |
| Key Companies Profiled | Faro Technologies Inc., 3D Systems Inc., Hexagon AB, Creaform Inc., Nikon Metrology, Autodesk Inc., GOM GmbH, Renishaw plc, Carl Zeiss Optotechnik GmbH, Topcon Corporation, Trimble Navigation Limited, and Perceptron Inc. |
| Report Coverage |
Market Trends, Drivers, Restraints, Competitive Analysis, Player Profiling, Covid-19 Analysis, Regulation Analysis |
The increasing adoption of 3D scanners for improving the quality of products, rapid advancements in technology, and reduction in manufacturing time are the factors bolstering the market demand for 3D scanning technology. The 3D models are used for performing a dimensional and comparative analysis of a product and facilitate changes in the design of the product for its enhancement. With the increased efficiency, accuracy, and faster results, the adoption of 3D scanning devices is increasing in several industry verticals. Thus, the companies involved in the manufacturing of 3D scanning devices are intensely focusing on developing technology-equipped lightweight scanners for both outdoor and indoor applications. The 3D scanners are being implemented in different industries for various applications such as prototyping, security surveillance, and body scanning among others.
3D Scanning Market Segmentation
The global 3D scanner market segmentation is based on component, product, range, end-use, and geography.
3D Scanning Market By Component
- Hardware
- Software
According to the 3D scanning industry analysis, the hardware segment is a crucial component of the market and is expected to continue to dominate the market in the coming years. The growth of the hardware segment is driven by the increasing adoption of 3D scanning technology in various industries such as automotive, aerospace, healthcare, and construction. The demand for high-quality and accurate 3D models is driving the development of advanced 3D scanning hardware that can capture data with high precision and detail. Additionally, the availability of cost-effective 3D scanning hardware is also driving the growth of the market, making it accessible to a wider range of users.
Market By Product
- Laser Scanner
- Structured Light Scanner
- Optical Scanner
In terms of product, laser scanner technology is one of the most popular and widely used technologies in the 3D scanner market. Laser scanning involves the use of laser light to capture data and create highly accurate 3D models of objects. The laser scanner technology is widely used in industries such as aerospace, automotive, and architecture, where high precision and accuracy are crucial. The laser scanner technology is preferred over other 3D scanning technologies as it offers high accuracy, speed, and versatility. Additionally, the development of advanced laser scanners technology such as phase shift and time-of-flight scanning is driving the growth of the laser scanner segment in the global market.
Market By Range
- Short
- Medium
- Long

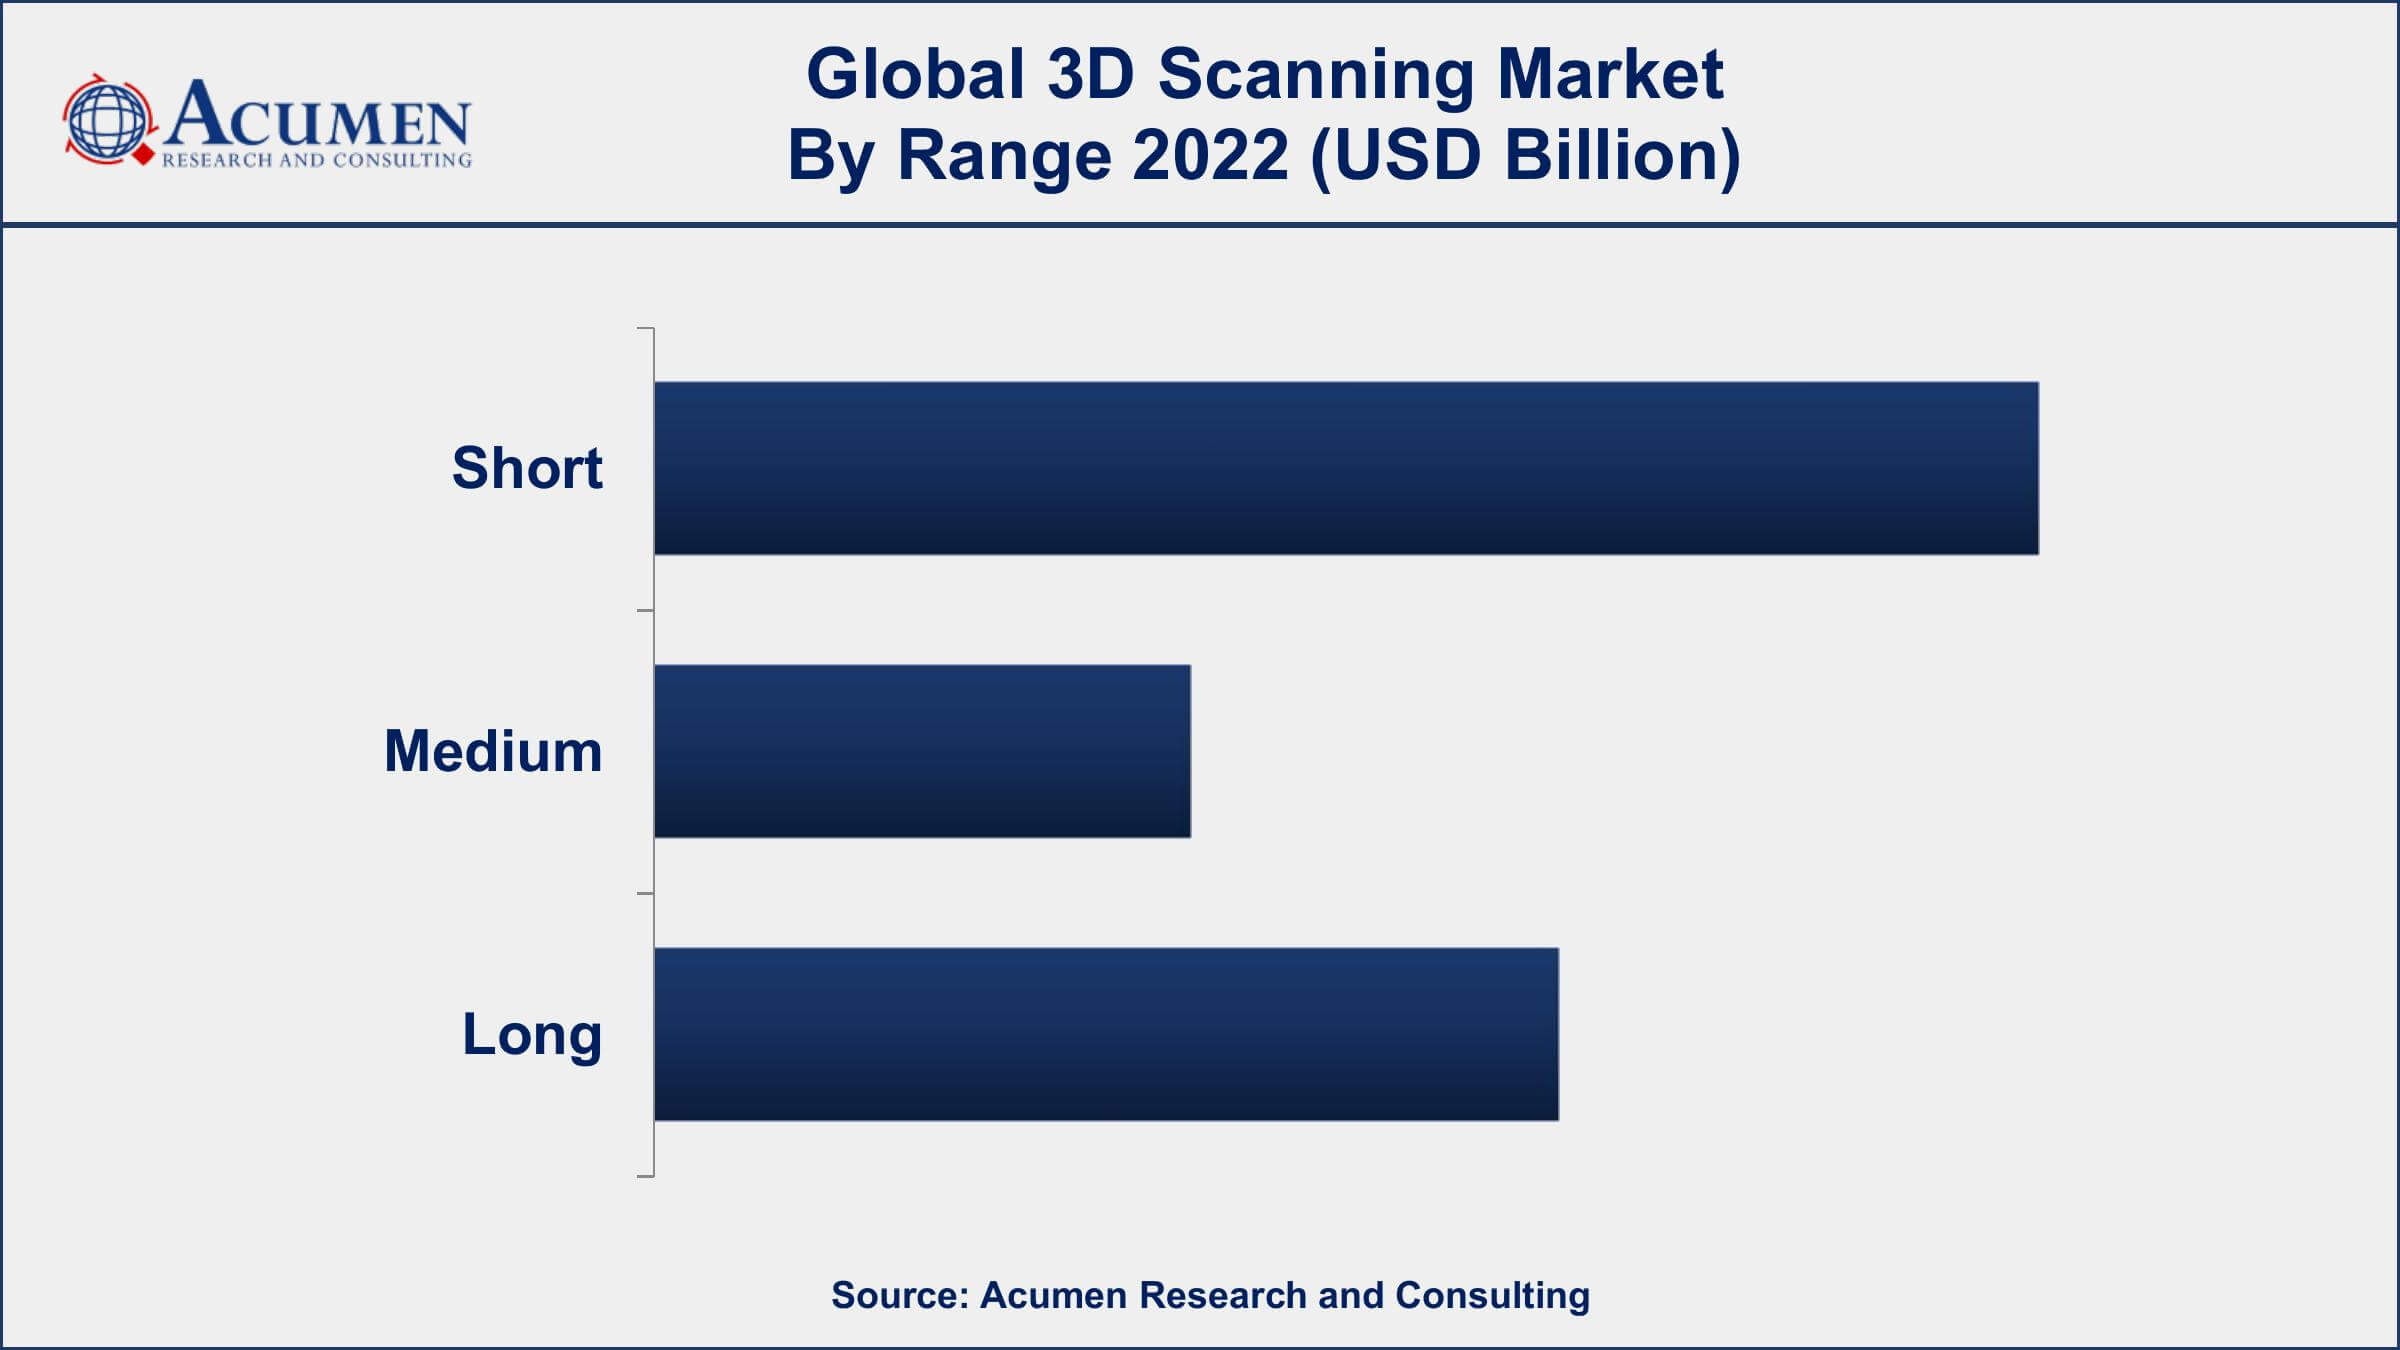
According to the 3D scanning market forecast, the long-range 3D scanning segment is one of the fastest-growing segments in the market. This is driven by several factors such as increasing demand for 3D scanning in various applications, such as quality control and inspection, reverse engineering, and cultural heritage preservation. Long-range 3D scanning is typically used for large-scale projects, such as industrial plants, construction sites, and infrastructure projects. The long-range 3D scanning segment is expected to witness significant growth due to the increasing demand for accurate and efficient 3D scanning technologies in various applications. For instance, in the construction industry, 3D scanning is used for surveying and modeling large-scale projects, which helps to reduce project timelines and costs. Similarly, in the aerospace industry, 3D scanning is used for reverse engineering and inspection of aircraft parts.
Market By End-use
- Healthcare
- Aerospace and Defense
- Industrial
- Architecture and Engineering
- Entertainment and Media
- Other
In terms of end-user, the healthcare segment is expected to account for a significant share of the market, owing to the increasing adoption of 3D scanning technologies in various healthcare applications. The healthcare industry has been increasingly adopting 3D scanning technologies to improve patient care and treatment outcomes. 3D scanning is used in various applications, such as prosthetics and implants, surgical planning, and anatomical modeling. As a result, the healthcare segment is one of the fastest-growing segments in the 3D scanner market. Moreover, the COVID-19 pandemic has accelerated the adoption of 3D scanning in the healthcare industry, as it has enabled healthcare providers to remotely create custom implants and prosthetics for patients, reducing the need for in-person appointments.
3D Scanning Market Regional Outlook
North America
- U.S.
- Canada
Europe
- U.K.
- Germany
- France
- Spain
- Rest of Europe
Asia-Pacific
- India
- Japan
- China
- Australia
- South Korea
- Rest of Asia-Pacific
Latin America
- Brazil
- Mexico
- Rest of Latin America
The Middle East & Africa
- South Africa
- GCC Countries
- Rest of the Middle East & Africa (ME&A)

3D Scanning Market Regional Analysis
North America is dominating the 3D scanning market due to several factors, including a strong focus on innovation, a large number of 3D scanning companies and research institutes, and a high demand for 3D scanning technology in various industries. The region is home to some of the world's leading tech companies, such as Google, Microsoft, and Apple, which have invested heavily in developing advanced 3D scanning technologies.
Another reason for North America's dominance in the 3D scanners market is the availability of skilled professionals and a supportive regulatory environment. The region has a large pool of trained and experienced engineers, designers, and technicians who have expertise in developing, implementing, and managing 3D scanning systems. Additionally, the regulatory environment in North America is conducive to the growth of the 3D scanning industry, with governments offering incentives and tax breaks to companies that invest in research and development.
3D Scanning Market Player
Some of the top 3D scanning market companies offered in the professional report include Faro Technologies Inc., 3D Systems Inc., Hexagon AB, Creaform Inc., Nikon Metrology, Autodesk Inc., GOM GmbH, Renishaw plc, Carl Zeiss Optotechnik GmbH, Topcon Corporation, Trimble Navigation Limited, and Perceptron Inc.
Frequently Asked Questions
How big is the global 3D scanning market?
The market size of 3D scanning was USD 3.1 Billion in 2022.
What is the CAGR of the global 3D scanning market during forecast period of 2023 to 2032?
The CAGR of 3D scanning market is 5% during the analysis period of 2023 to 2032.
Which are the key players operating in the market?
The key players operating in the global 3D scanning market are Faro Technologies Inc., 3D Systems Inc., Hexagon AB, Creaform Inc., Nikon Metrology, Autodesk Inc., GOM GmbH, Renishaw plc, Carl Zeiss Optotechnik GmbH, Topcon Corporation, Trimble Navigation Limited, and Perceptron Inc.
Which region held the dominating position in the global 3D scanning market?
North America held the dominating position in 3D scanning market during the analysis period of 2023 to 2032.
Which region registered the fastest growing CAGR for the forecast period of 2023 to 2032?
Asia-Pacific region exhibited fastest growing CAGR for 3D scanning market during the analysis period of 2023 to 2032.
What are the current trends and dynamics in the global 3D scanning market?
The current trends and dynamics in the 3D scanning industry include the increasing adoption of 3D printing technology, and rising demand for high-quality 3D models in industries such as healthcare and aerospace.
Which component held the maximum share in 2022?
The hardware component held the maximum share of the 3D scanning market.


